

The first ETF listed in the Australian market 25 years ago, spurring a fundamental shift in Australian investors’ preferences. Today the market is at an inflection point with an overwhelming preference for listed over unlisted vehicles and passive over active management. We unpack the key drivers behind this shift, where the industry sits today, and where it is heading.
Key points
Managed funds are being ETF’d
ETFs and unlisted managed funds (managed funds) share the same registered unit trust legal structure under the same governing law, the Corporations Act 2001. The key difference between the two comes from ETFs being listed and traded live on an exchange. This feature provides investors with greater price transparency, intraday liquidity and greater accessibility. By contrast managed funds are transacted directly via a fund manager or platform often just once a day.
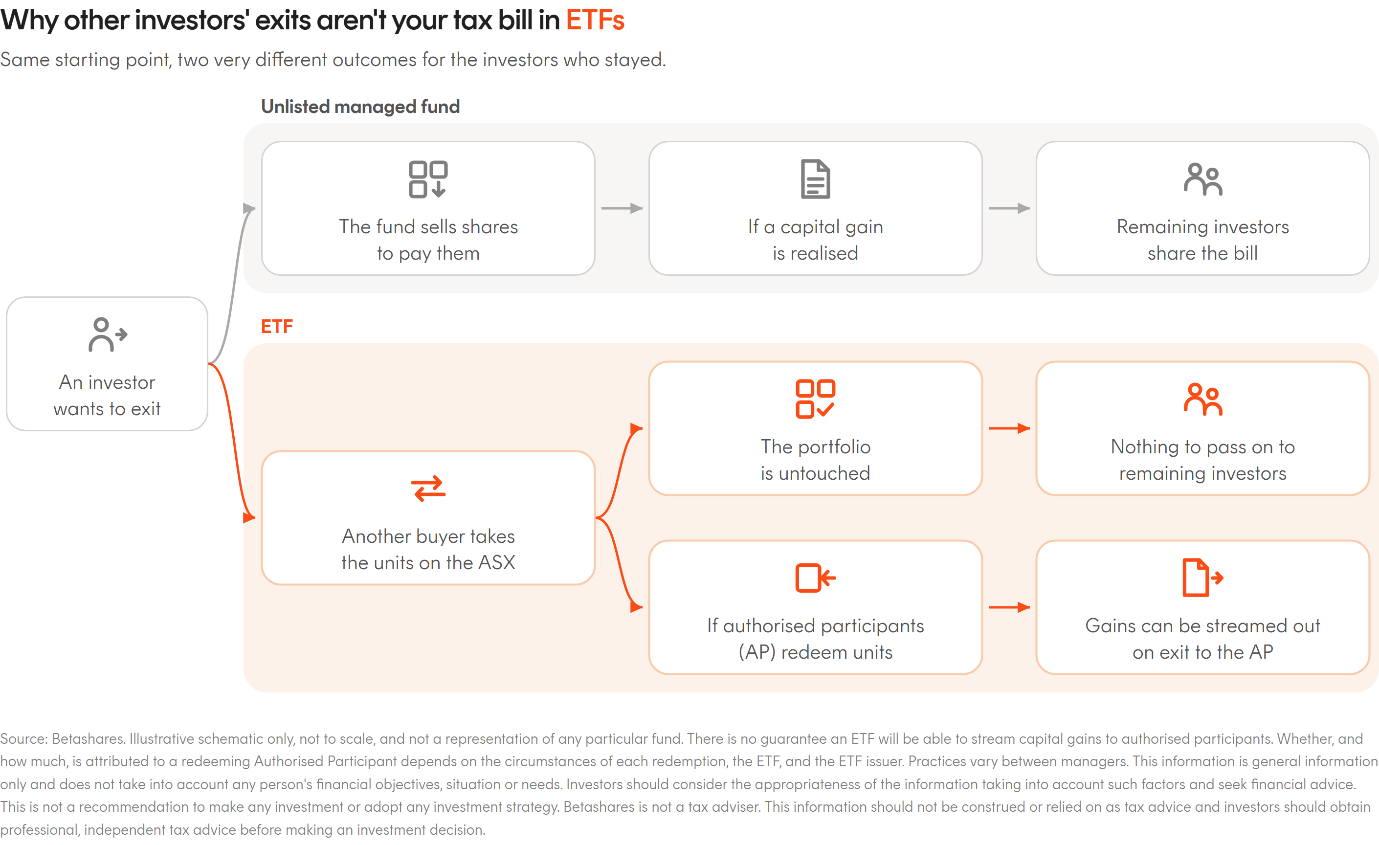
A further advantage of the ETF structure is the ability to stream realised capital gains out to authorised participants as they redeem units. The same mechanism is legally available but practically impossible for managed funds. As a result, managed fund investors can be left carrying the capital gains tax bill generated by others who exited during the year, while ETF investors typically are not.
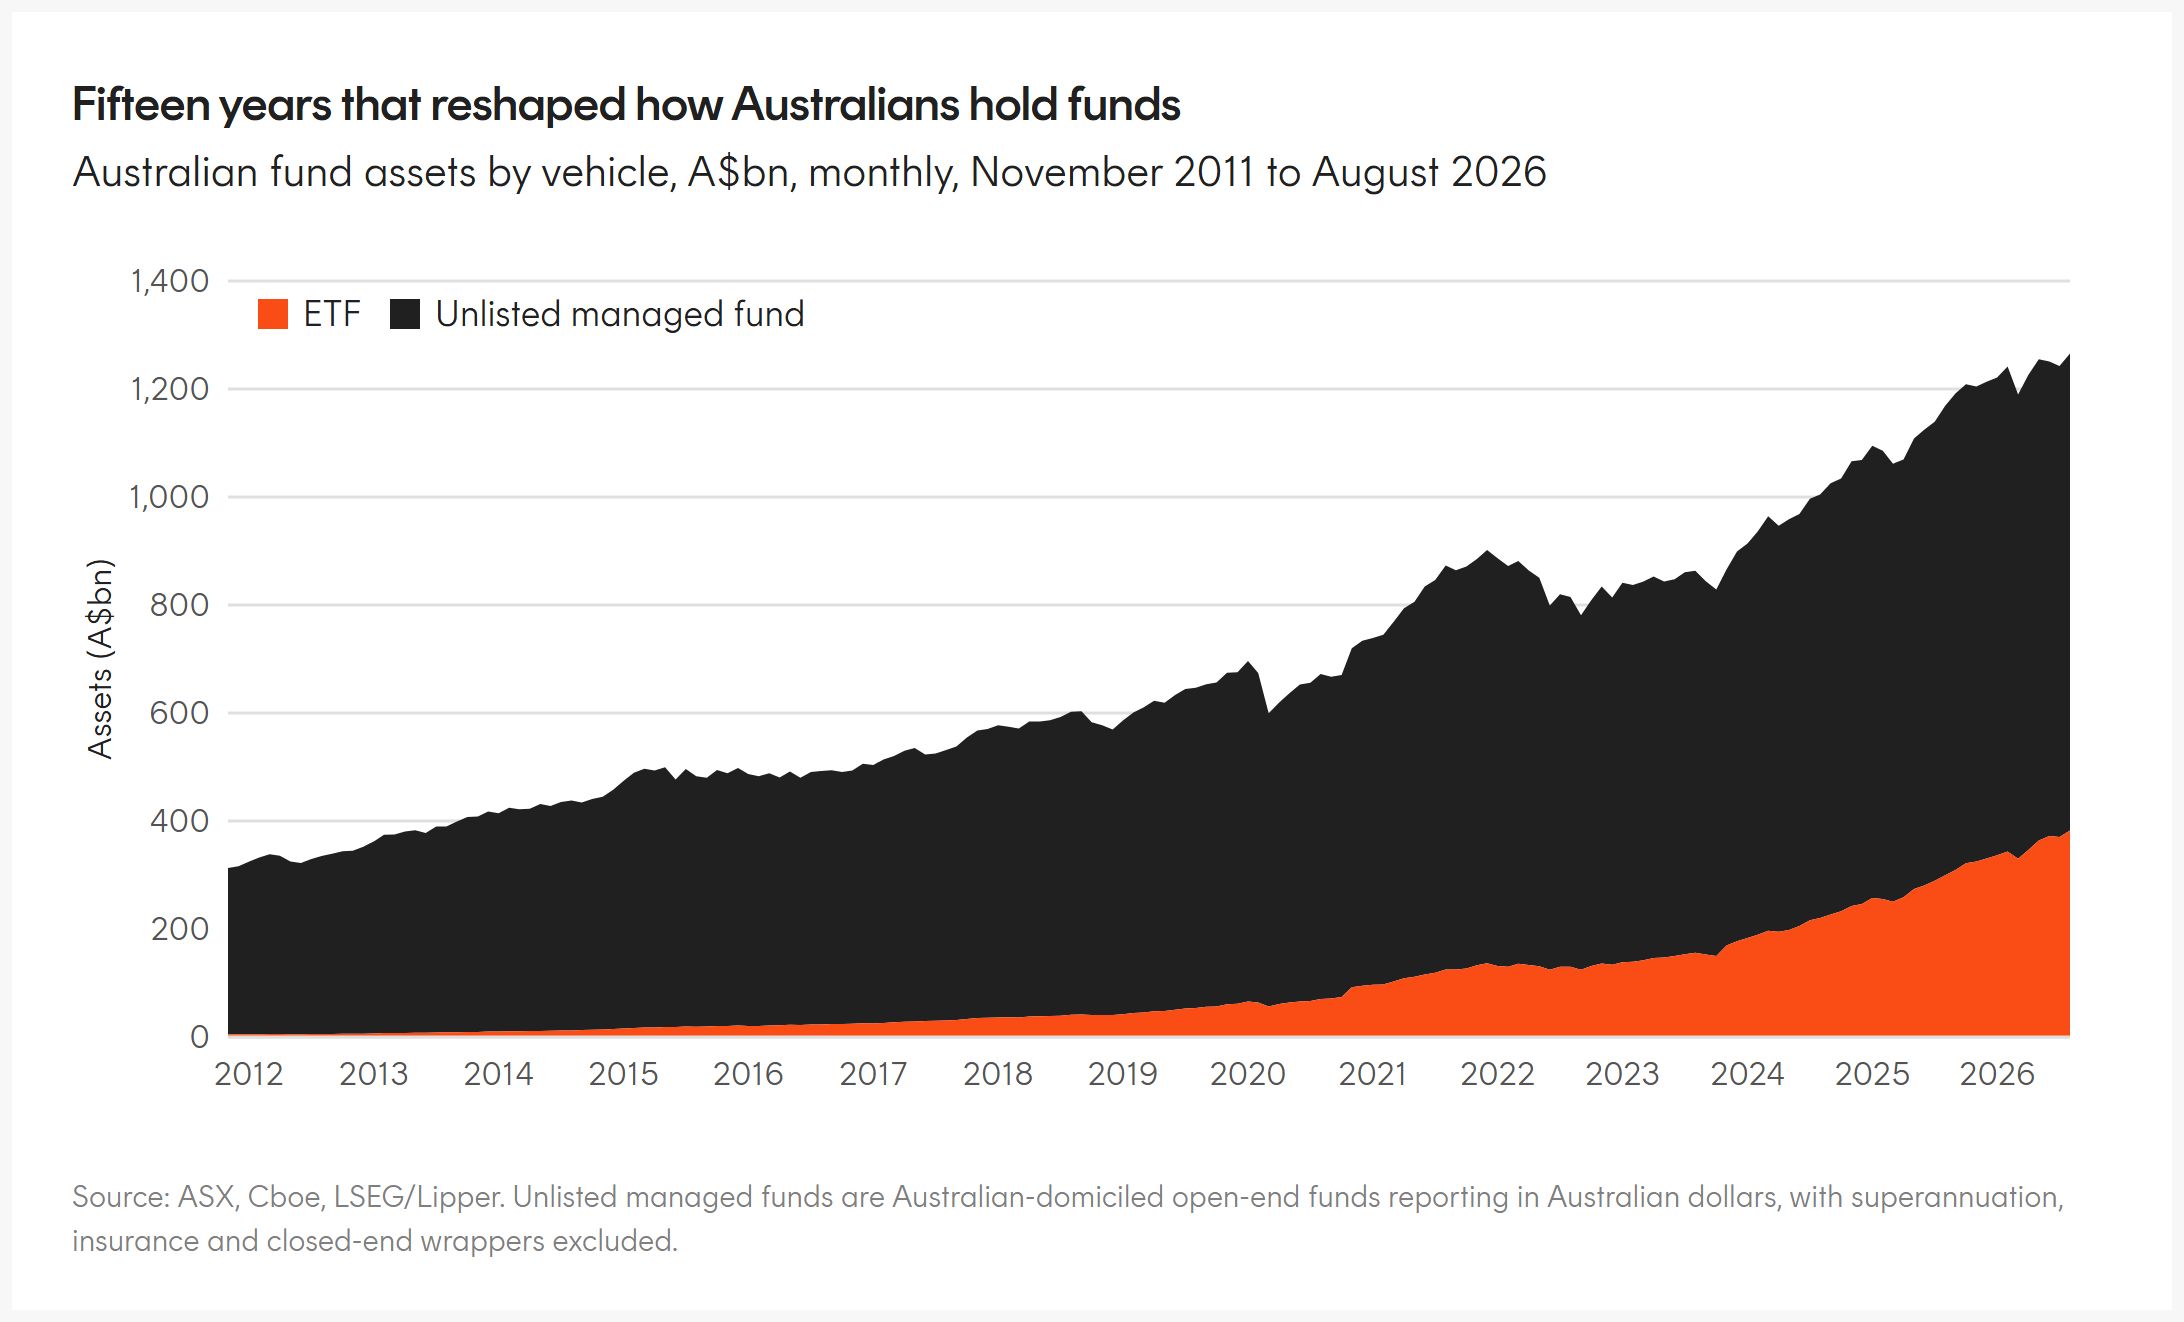
These advantages can make ETFs a more efficient vehicle for holding liquid have driven a marked shift in how Australians invest. Over the past 15 years the ETF share of fund assets has grown from below 2% to around 30%3. Over the past five financial years Australian ETFs have taken in over $150bn in net inflows while outside of private assets managed funds have shed more than $bn4.
Given these trends we expect ETF FUM in Australia to overtake managed funds by the end of the decade.
Getting active with your passive
The second major shift has been from active management to passive.
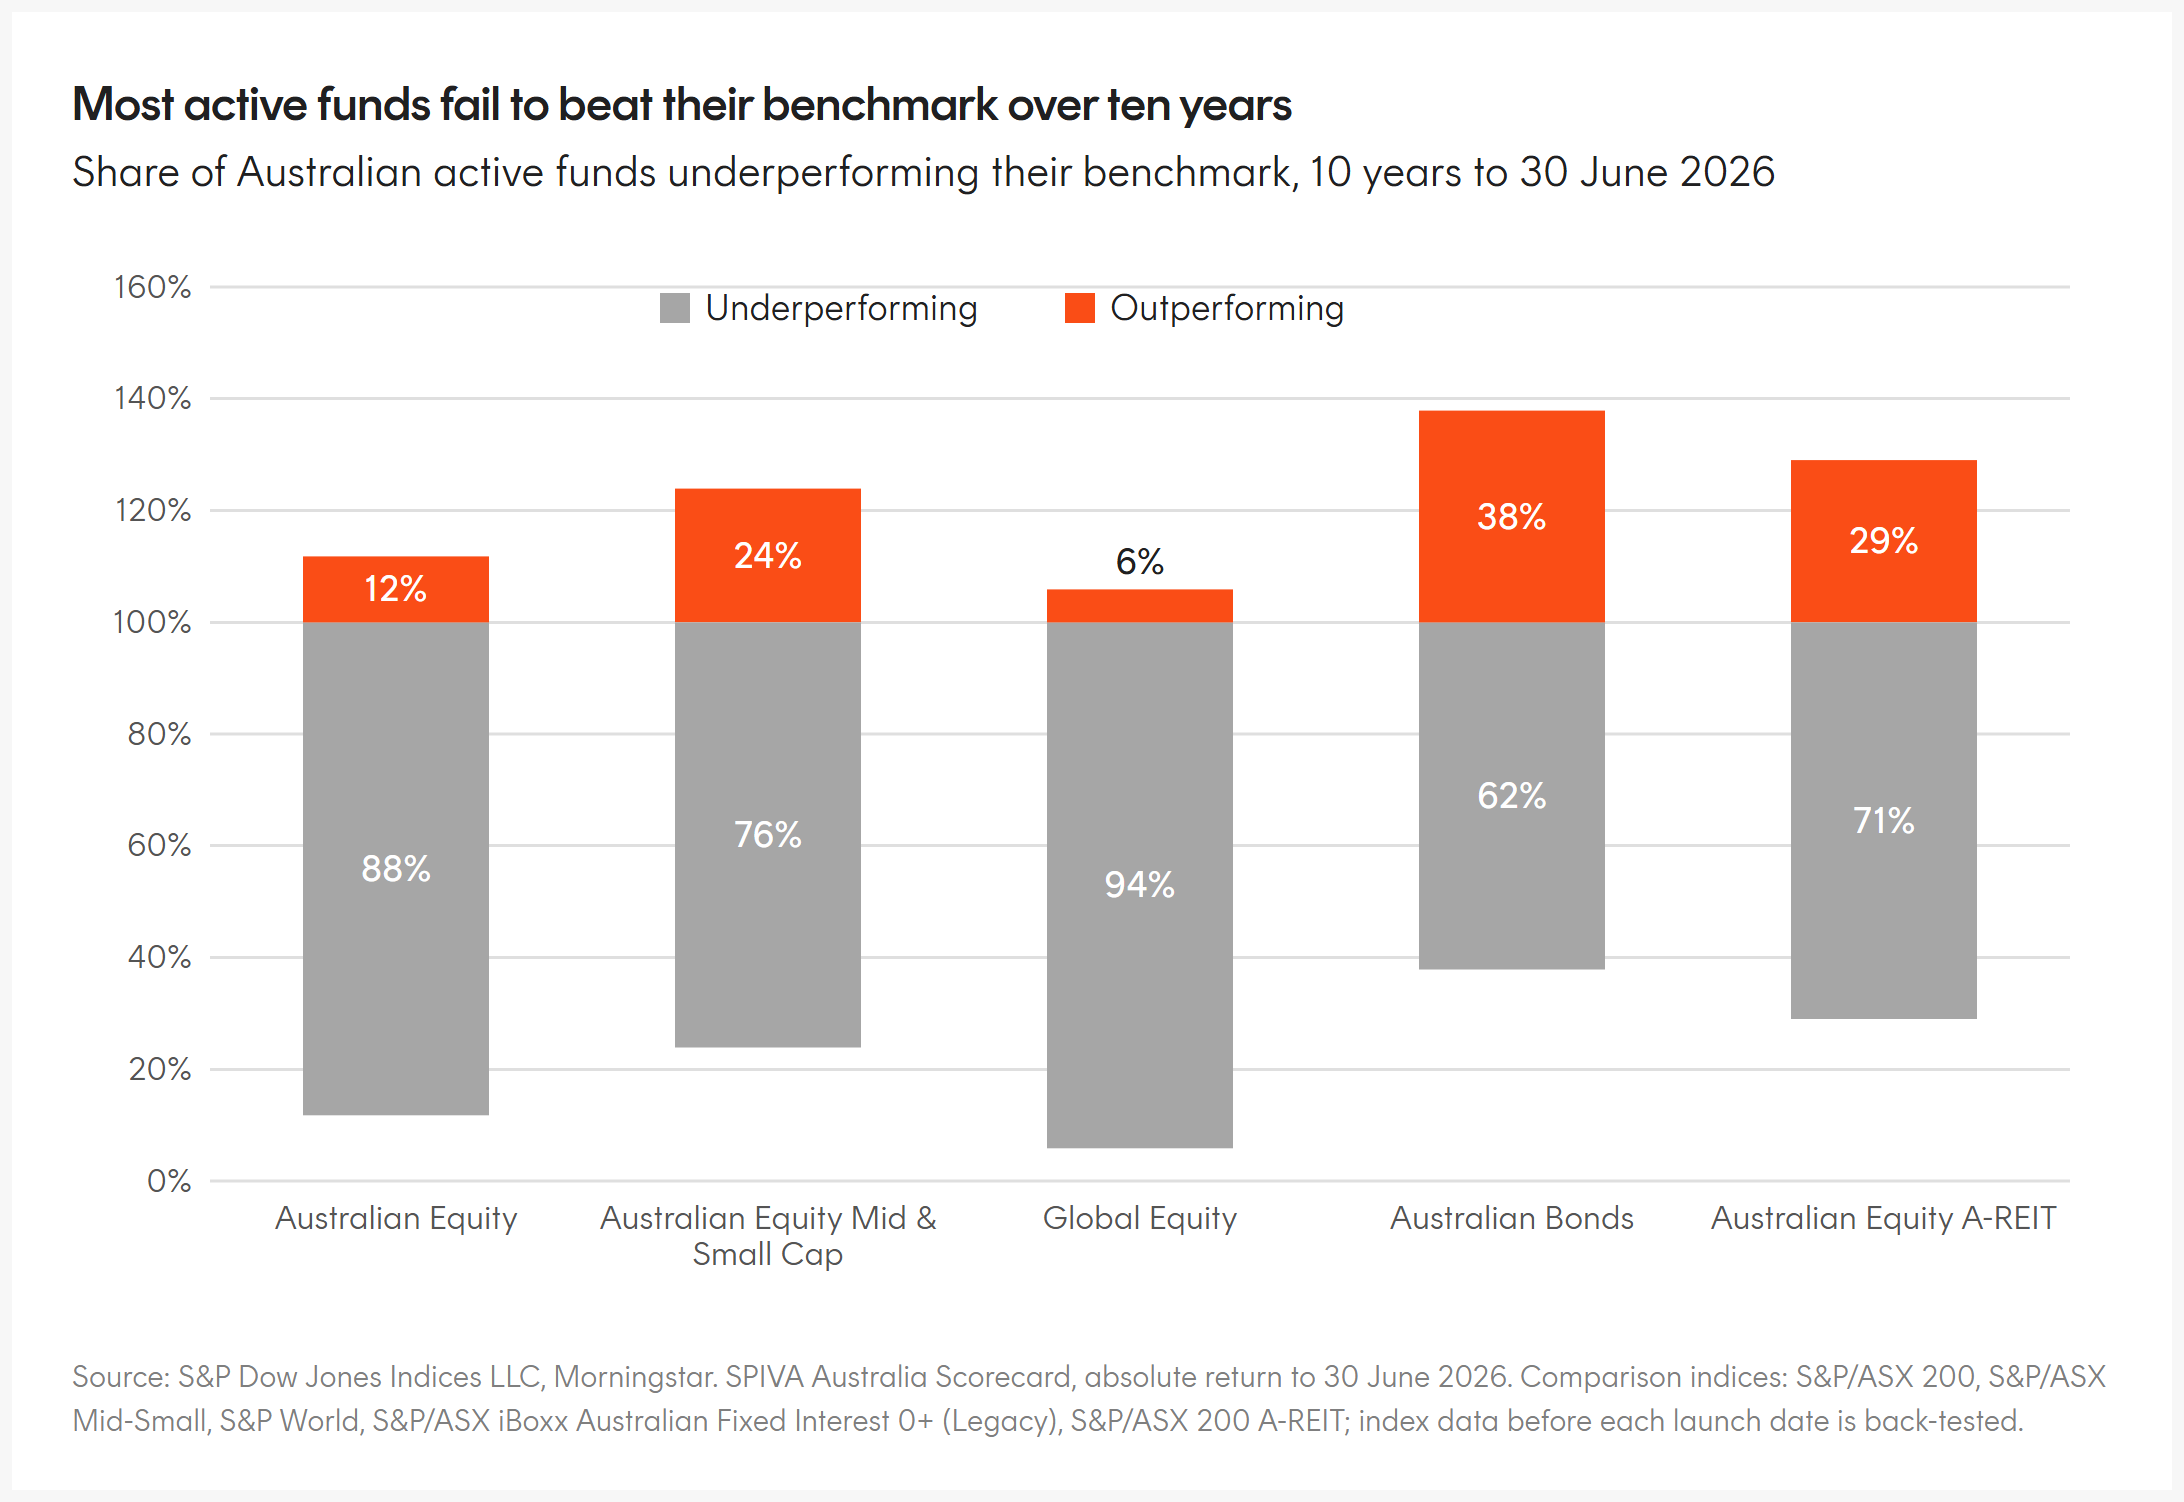
Broad market passive index funds, like those aiming to track the Solactive Australia 200 and similar indices, generally offer investors low cost, tax efficient, well diversified asset class building blocks. Despite their simplicity research shows a majority of actively managed funds underperform passive benchmarks, with the percentage of active funds underperforming increasing the longer the investment horizon5. Education around this underperformance has led many investors to increase their allocation to passive investments within portfolios over the past decade.
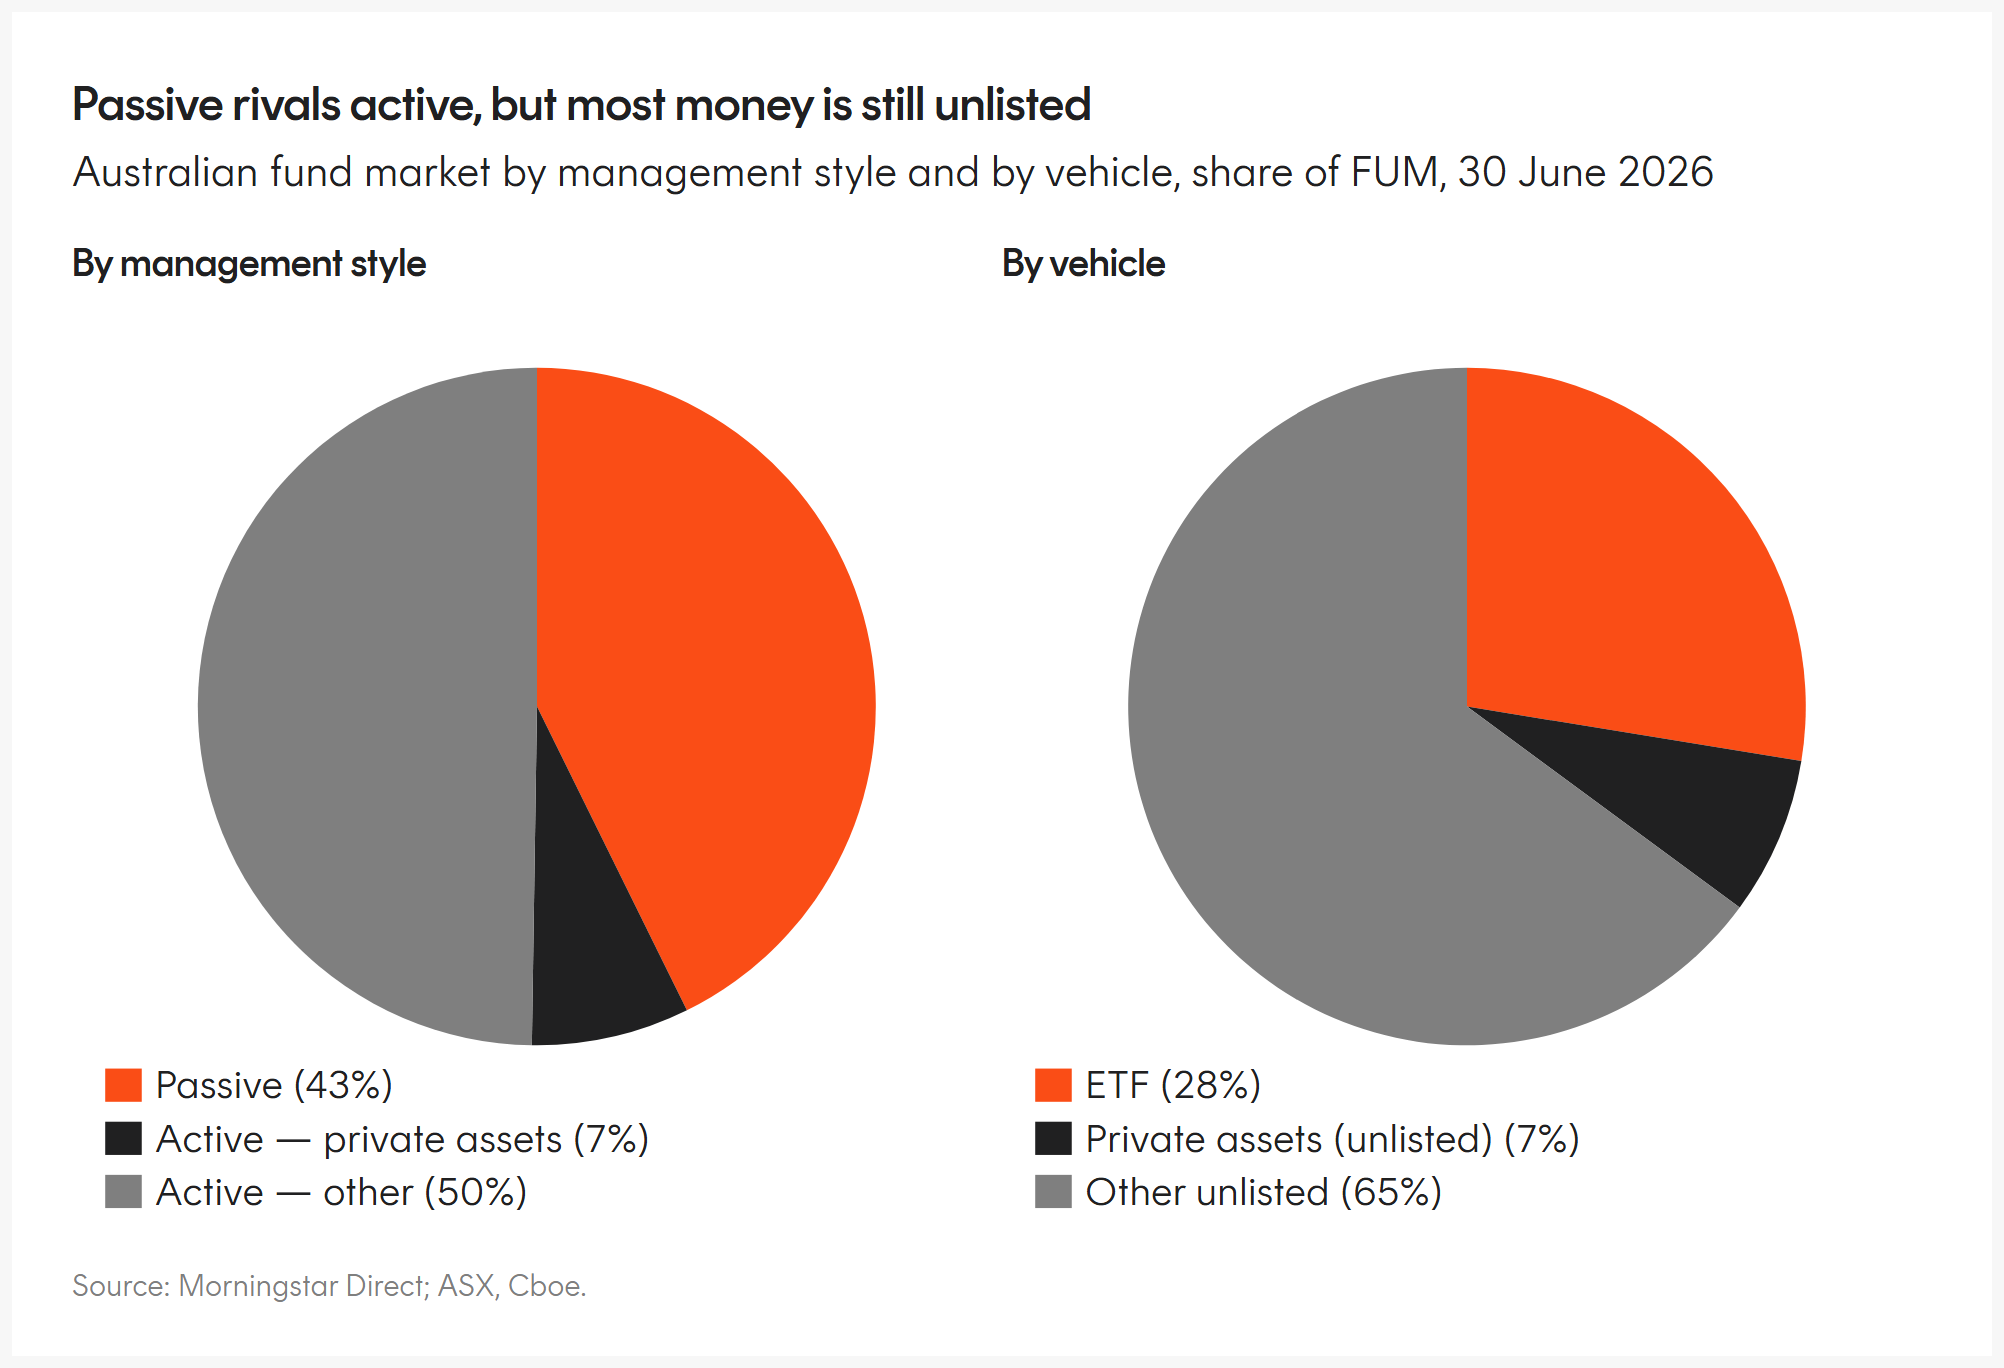
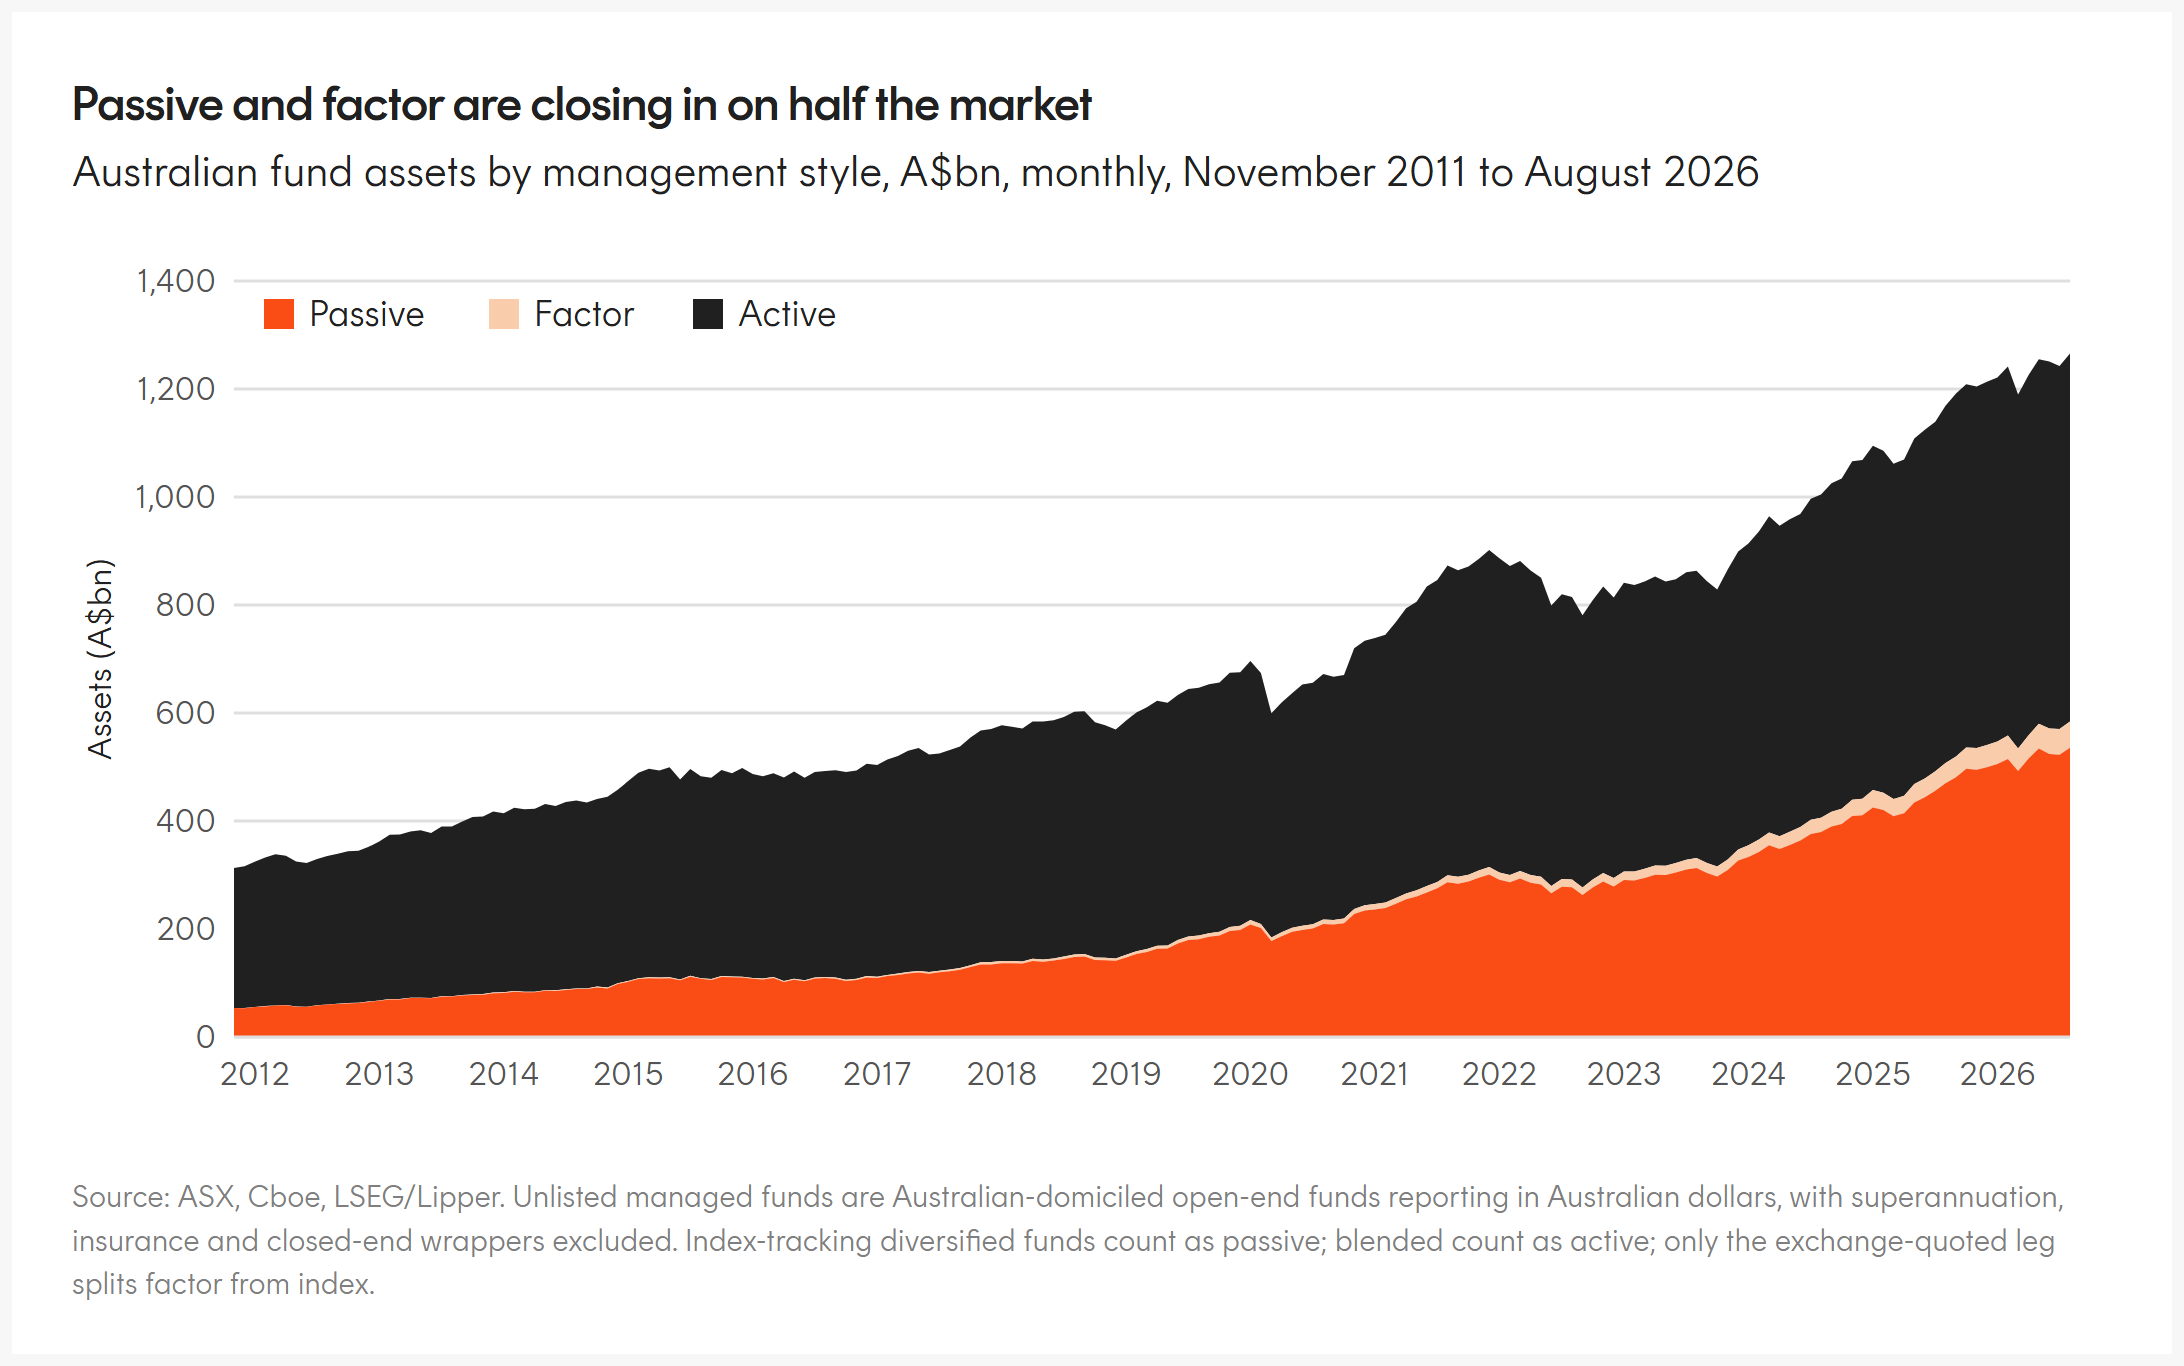
In 2011 passive investments made up 17% of the Australian funds management industry. Today the figure sits at 43%, close to an inflection point6. As this inflection point nears it is worth pointing out that the total FUM of the industry is less than 2% of the market capitalisation of the world’s 50 largest companies7. In other words, passive fund flows in Australia still have little influence on overall market movements.
More recently, growing education around factor ETFs has accelerated the move toward passive. Factor ETFs remain passive, tracking transparent rules-based indices, but instead of weighting companies by size they select and weight on other metrics.
A value index, for example, uses measures such as price to earnings, book value and cash flow, while a quality index looks to earnings strength and debt levels. The same approach applies in fixed income, where indices target factors like duration and credit.
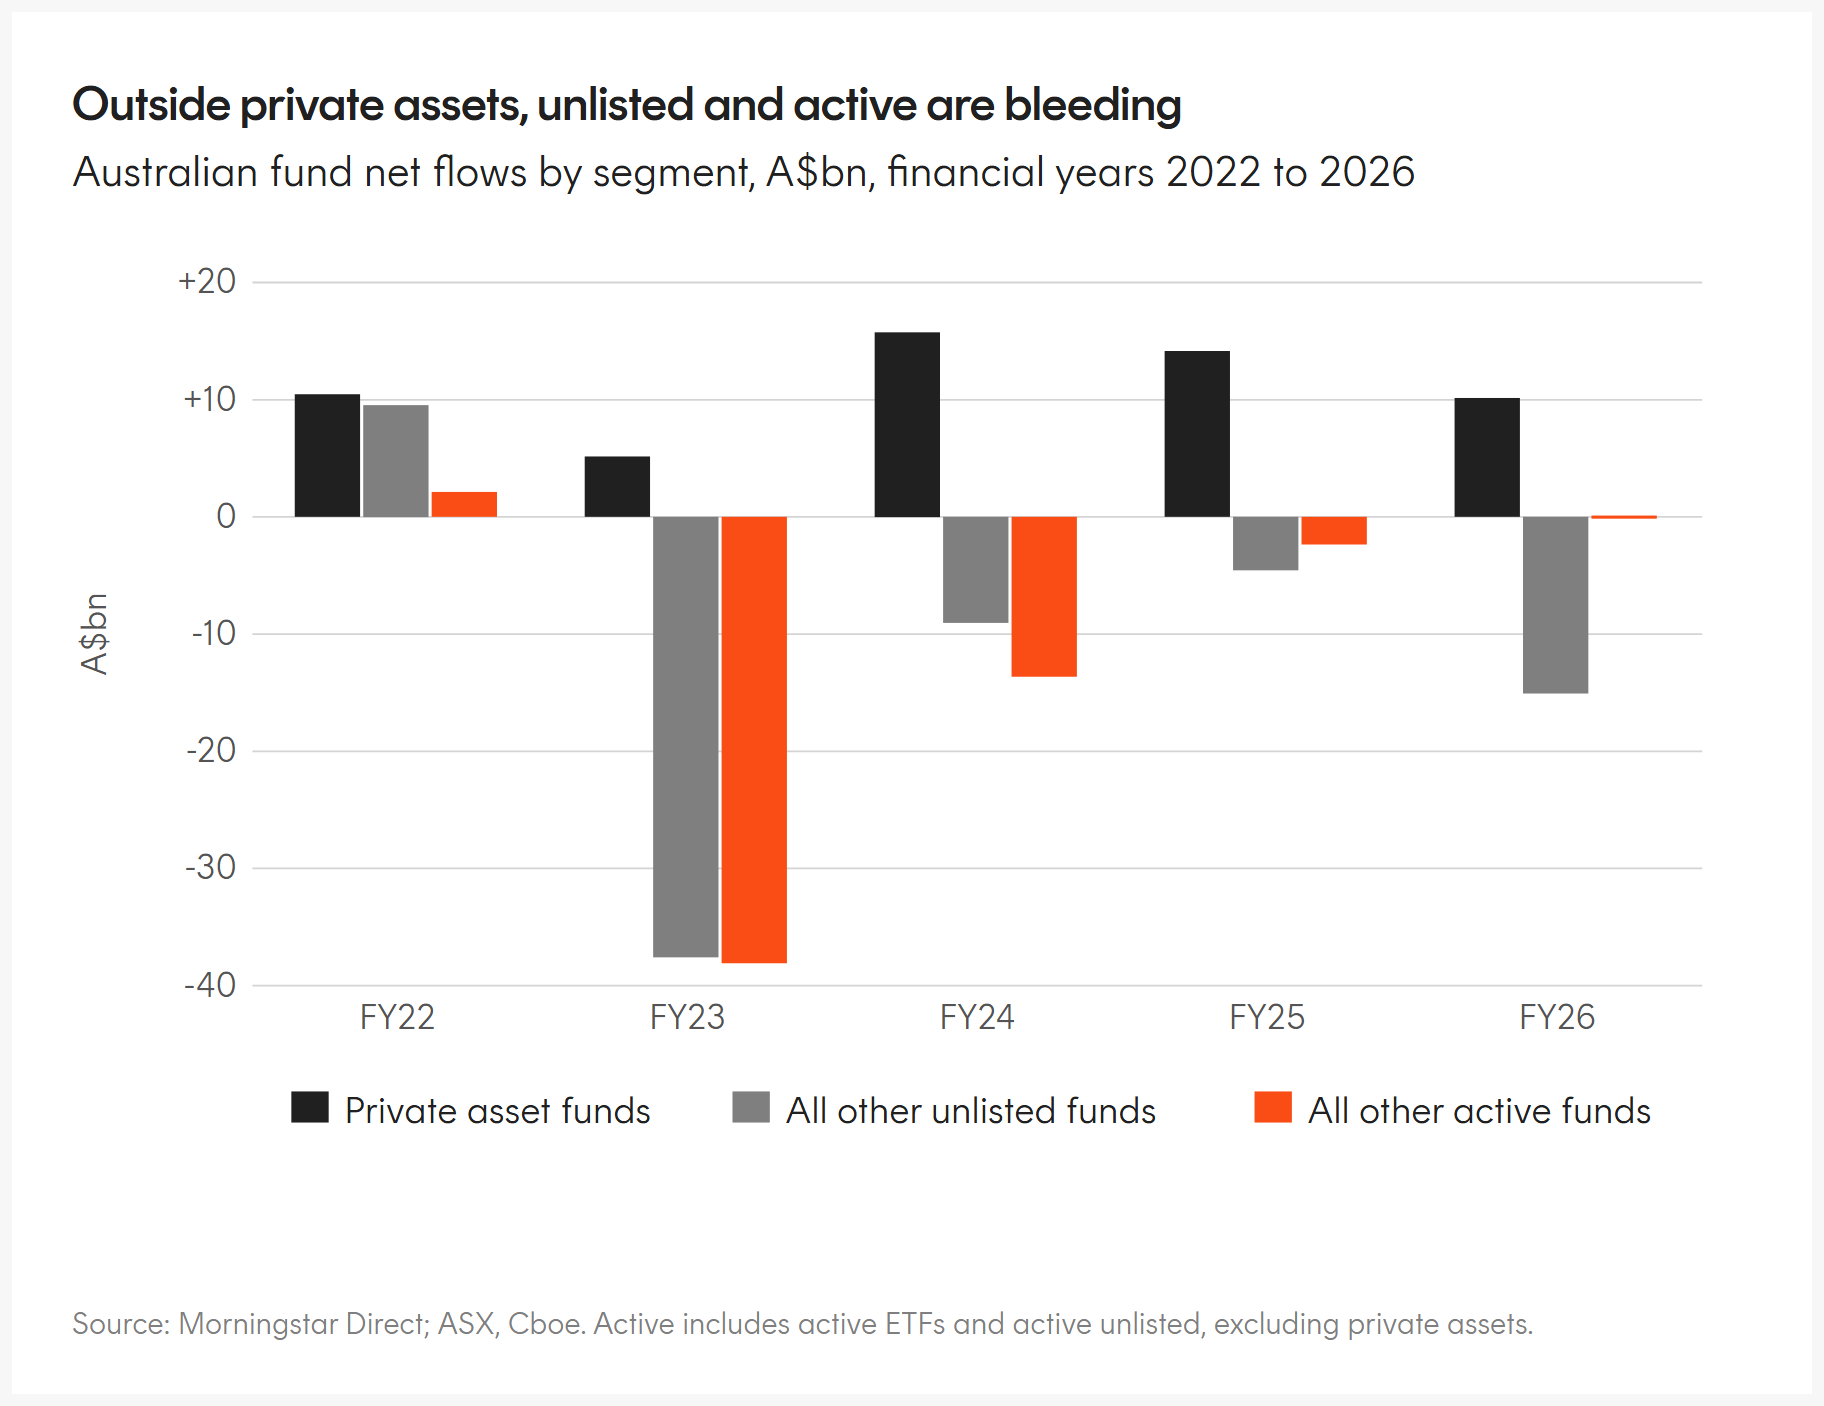
While representing a small overall share today, factor ETFs are currently growing at a faster rate than both active and broad market passive funds. Over the past 5 financial years factor ETF funds under management have grown at a rate of 31% per annum compared to 15% p.a. for broad market index funds and 1% p.a. for active. Over the same period equity factor funds have recorded inflows of $21bn while active equity funds have recorded outflows of $51bn, with only rising markets keeping active assets from shrinking8.
We believe factor ETFs will continue to grow and take up a larger share of the Australian funds management industry as advisers and investors turn to these strategies alongside market capitalisation indices and in place of traditional active managers.
Where unlisted active funds will still play a role
Private asset funds have experienced significant growth over the past decade. Private asset securities, such as direct corporate loans, mortgage-backed securities and unlisted company equity, are not liquid enough to be suitable for the ETF structure. Similarly passive index tracking funds are not suited to underlying securities that cannot be readily bought and sold.
As such, unlisted active funds will still have a significant role to play in the future of the Australian funds management industry by providing access to this increasingly large and relevant asset class.
Within the Australian funds management industry private asset funds now report a collective $102 billion in funds under management, having more than tripled over the past five years.
Private asset funds are the only unlisted and active segments with consistent inflows over the past 5 years recording $56bn in net flows9. Over the same period all other unlisted and active funds recorded outflows of $57bn and $52bn respectively10. In other words, the net inflows into unlisted private asset funds have masked just how bad outflows from traditional unlisted and active strategies have been in Australia.
Setting private assets aside, within the public asset fund universe passive is 46%, close to parity with active. On a vehicle basis, ETF assets now stand at more than 40% of the unlisted managed fund market11. We expect the passive, ETF and private asset segments to keep growing while the traditional active and unlisted segments shrink.