
Betashares Australian ETF Review: May 2026

Ilan Israelstam
3 minutes reading time
Related articles


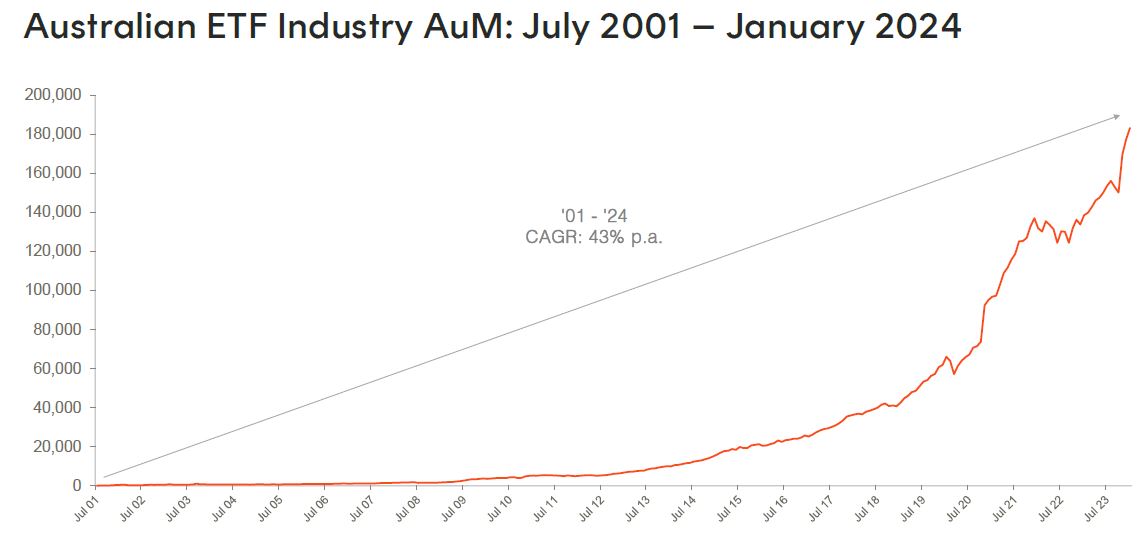
Industry exceeds $180B as investors move back into equities
- The Australian ETF industry hit a new all-time high in assets under management in January with the industry growth driven by a combination of asset value appreciation and investor net inflows.
- In the first month of 2024, assets grew 3.2% month-on-month, for a total monthly market cap increase of $5.6B, with the industry reaching a new all-time high of $183.1B.
- Net inflows represented ~30% of the industry’s growth in January, with net inflows of $1.7B, a robust result in what is typically the quietest month of the year.
Source: ASX, CBOE
Exchanged Traded Funds Market cap
- Australian Exchange Traded Funds Market Cap (ASX + CBOE): $183.1B – New all-time high
- ASX CHESS Market Cap: $156.1.2B1
- Market Cap increase for month: 3.2%, $5.6B
- Market cap growth for last 12 months: 32.2%, $44.6B
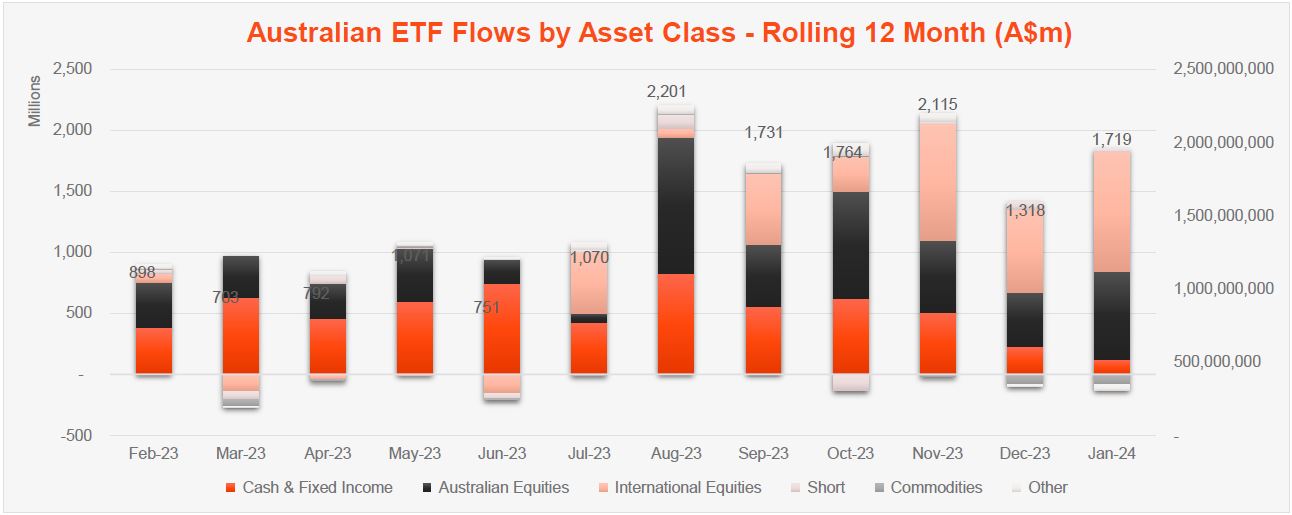
Net Flows
- Net flows for the month: $1.7B
New Products
- 367 Exchange Traded Products trading on the ASX & CBOE
- No new or closed products in January
Trading value
- Trading value rose by -20% in January, with ASX trading value of ~$8B for the month
Performance
- The best performing ETF in January was our Global Uranium ETF (ASX: URNM) which recorded performance of 16.4% for the month. Other than Uranium exposures, we saw strong performance in our Currency Hedged Japanese Equities ETF (ASX: HJPN), which rose ~9% in the month.
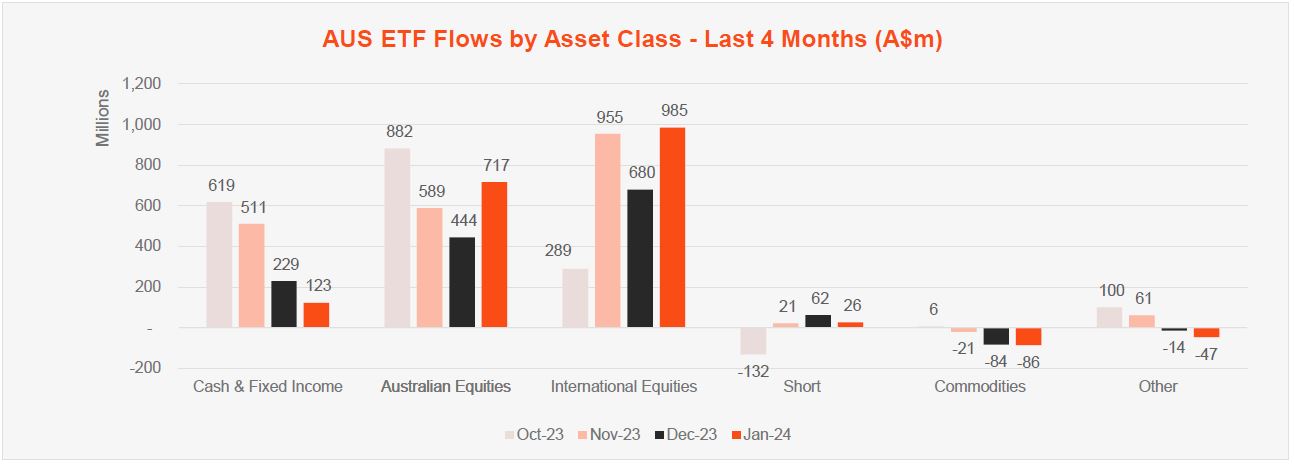
Top 5 category inflows (by $)
| Broad Category | Inflow Value |
| International Equities | $985,376,256 |
| Australian Equities | $717,465,478 |
| Fixed Income | $67,033,367 |
| Cash | $55,963,646 |
| Short | $26,177,886 |
Top category outflows (by $)
| Broad Category | Inflow Value |
| Commodities | ($86,076,776) |
| Listed Property | ($71,495,150) |
Top sub-category inflows (by $)
| Sub-category | Inflow Value |
| Australian Equities – Broad | $790,375,256 |
| International Equities – Developed World | $575,839,972 |
| International Equities – US | $187,530,812 |
| International Equities – Sector | $125,193,066 |
| Australian Bonds | $104,006,727 |
Top sub-category outflows (by $)
| Sub-category | Inflow Value |
| Australian Equities – Sector | ($83,291,028) |
| Gold | ($82,610,832) |
| Australian Listed Property | ($81,428,324) |
| Global Bonds | ($47,010,028) |
| International Equities – E&R – Impact | ($33,647,014) |
Top Performing Products – 2023
| Ticker | Product Name | Performance |
| URNM | Betashares Global Uranium ETF | 16.4% |
| ATOM | Global X Uranium ETF | 13.3% |
| HJPN | Betashares Japan ETF – Currency Hedged | 9.3% |
| MKAV | Montaka Global Extension Fund | 8.9% |
| YANK | Betashares Strong US Dollar Fund (Hedge Fund) | 8.8% |
Footnotes:
1. Since February 2023, the ASX started reporting additional data on a CHESS-only basis. The primary use of such data is that it will exclude, amongst other things, the FuM and Flows in ‘dual class’ Active ETFs and potentially provide a more accurate picture of exchange traded activity.
Explore
ETF industry