
Betashares Australian ETF Review: May 2026

Ilan Israelstam
3 minutes reading time
Related articles


International equities products drive the industry towards $200B
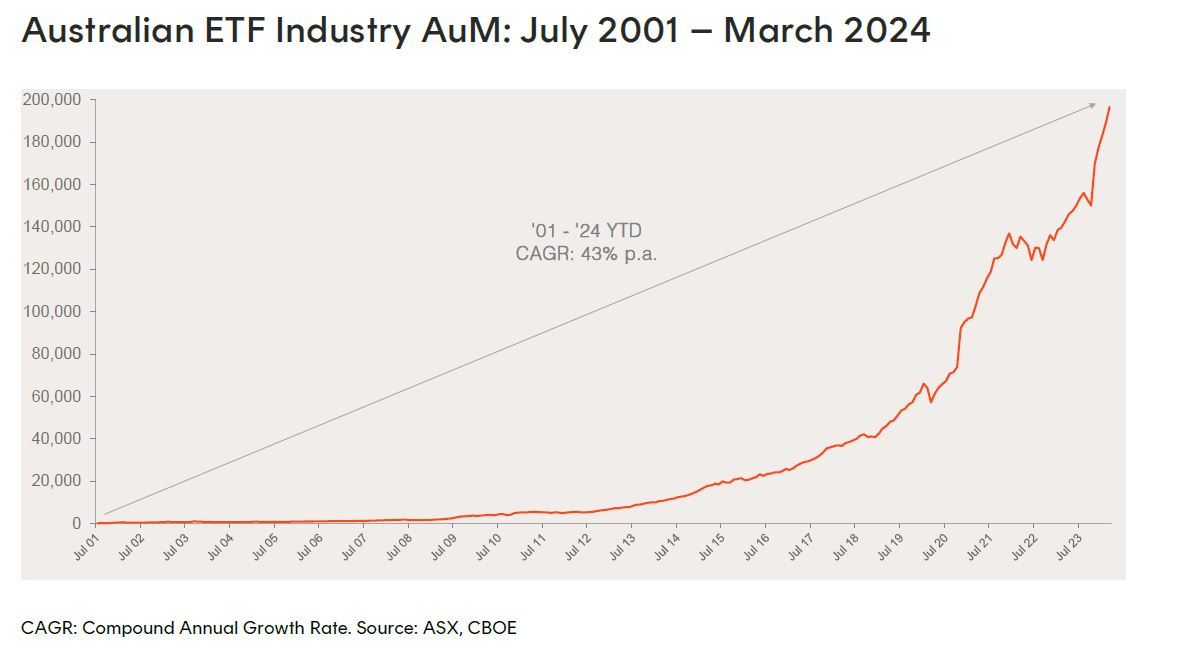
- The Australian ETF industry hit a new all-time high in assets under management in March, ending just shy of the $200B milestone, with industry growth driven by a combination of asset value appreciation and investor net inflows.
- March saw assets grow 3.9% month-on-month, for a total monthly market cap increase of $7.3B, with the industry reaching a new all-time high of $196.7B.
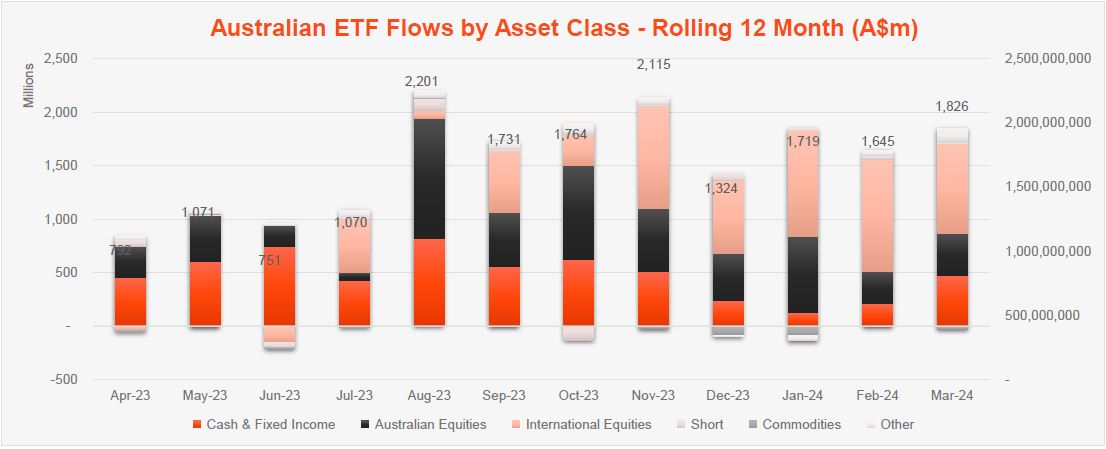
- Net inflows for the month were $1.8B, representing ~25% of the industry’s growth in March.
- Trading value declined marginally, dropping 9% month on month in March, with ASX trading value of ~$9B for the month.
- Over the last 12 months the industry has grown by 37.9%, or $54.1B.
Exchanged Traded Funds Market cap
- Australian Exchange Traded Funds Market Cap (ASX + CBOE): $196.7B – New all-time high
- ASX CHESS Market Cap: $168.1B1
- Market Cap increase for month: 3.9%, $7.3B
- Market cap growth for last 12 months: 37.9%, $54.1B
Net Flows
- Net flows for the month: $1.8B
New Products
- 359 Exchange Traded Products trading on the ASX & CBOE
- No new launches or fund closures this month
Trading value
- Trading value declined by 9% in March, with ASX trading value of ~$9B for the month
Performance
- The best performing ETFs this month were gold miners ETFs, including our MNRS Global Gold Miners ETF which returned ~19% for the month. Bitcoin and Crypto exposures also performed relatively well, albeit not at the rate experienced in February.
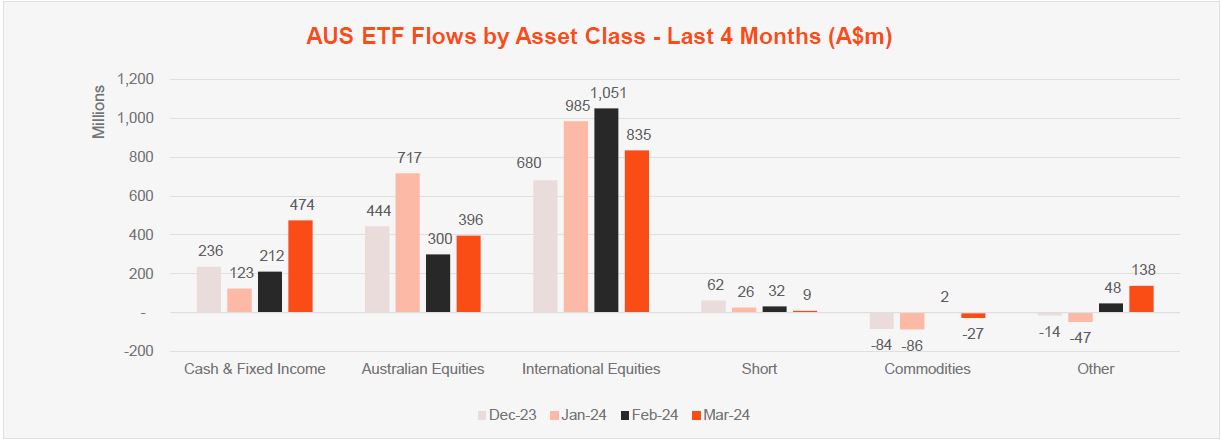
Top 5 category inflows (by $)
| Broad Category | Inflow Value |
| International Equities | $834,862,479 |
| Fixed Income | $453,435,632 |
| Australian Equities | $396,415,252 |
| Listed Property | $80,773,032 |
| Multi-Asset | $35,884,782 |
Top category outflows (by $)
| Broad Category | Inflow Value |
| Commodities | ($27,444,446) |
Top sub-category inflows (by $)
| Sub-category | Inflow Value |
| Australian Bonds | $338,182,681 |
| Australian Equities – Broad | $336,060,091 |
| International Equities – Developed World | $285,524,903 |
| International Equities – US | $274,997,820 |
| International Equities – Sector | $143,269,094 |
Top sub-category outflows (by $)
| Sub-category | Inflow Value |
| US Equities – Short | ($16,910,250) |
| Australian Equities – Geared | ($15,072,848) |
| Gold | ($10,163,396) |
| Oil | ($9,616,000) |
| Australian Equities – Sector | ($6,167,000) |
Top Performing Products – March 2024
| Ticker | Product Name | Performance |
| GDX | VanEck Gold Miners ETF | 19.4% |
| MNRS | Betashares Global Gold Miners ETF – Currency Hedged | 19.3% |
| WIRE | Global X Copper Miners ETF | 16.6% |
| EBTC | Global X 21Shares Bitcoin ETF | 13.2% |
| CRYP | Betashares Crypto Innovators ETF | 12.2% |
Footnotes:
1. Since February 2023, the ASX started reporting additional data on a CHESS-only basis. The primary use of such data is that it will exclude, amongst other things, the FuM and Flows in ‘dual class’ Active ETFs and potentially provide a more accurate picture of exchange traded activity.
Explore
ETF industry
1 comment on this
Last 4 months, Australian Bonds, achieved the highest inflow. Could you please provide the top 5 Australian Bonds with the highest inflow?
Thank You
Nick