Cliffwater
15 minutes reading time
This article was written by Phil Huber, Head of Portfolio Solutions at Cliffwater LLC (Cliffwater), and has been republished with Cliffwater’s permission. Cliffwater are the inaugural partners of Betashares Private Capital and manage the underlying fund into which the BPC Cliffwater Private Credit Fund (Fund) invests. Betashares has not verified and does not warrant the accuracy or completeness of the information, and the article does not necessarily represent the views or opinions of Betashares.
The Fund is only available to wholesale investors, and other investors with a financial adviser using an investment platform. It is suited to investors comfortable with the risks associated with private credit, including exposure to an asset class that is inherently illiquid and limited ability for investors to withdraw their investment. Generally, the Betashares will process redemption requests from the Fund on a quarterly basis, in line with the quarterly repurchase offer of the Underlying Fund. Note that an investor’s ability to redeem will be subject to various factors including available liquidity and the Fund’s ability to withdraw from the Underlying Fund. In certain circumstances, it is possible that redemptions will not be able to be paid upon request (either in full or partially).
Past performance is not indicative of the future performance of any index or fund. This article may include opinions.
Direct lending is often portrayed as complex and opaque, particularly during periods of press scrutiny. In reality, the drivers of return are straightforward and observable. Income, credit gains or losses, fees, and leverage determine long-term outcomes. Using long-term data from the Cliffwater Direct Lending Index (CDLI), this paper breaks those components apart and evaluates how returns behave under a range of conditions. Even under draconian assumptions, the range of outcomes is more predictable than commonly assumed.
Introduction
The U.S. stock market has delivered roughly 10% annualized returns over the past century. In practice, investors rarely experience that average in a given year. Returns tend to vary widely, often landing well above or below the long-term figure, with little consistency from one year to the next. From 1926 through 2025, just 6 out of 100 years produced returns within 2% of the long-term average.
Direct lending behaves differently.
While its long-term return profile is similar in magnitude, its year-to-year experience has been far more consistent. Since 2005, the CDLI has generated a 9.65% average annual total return. Over that same period, 10 of the past 21 years (48%) have fallen within plus or minus 2 percentage points of that average.
Exhibit 1: Direct Lending Calendar Year Total and Income Return (As of December 31, 2025)
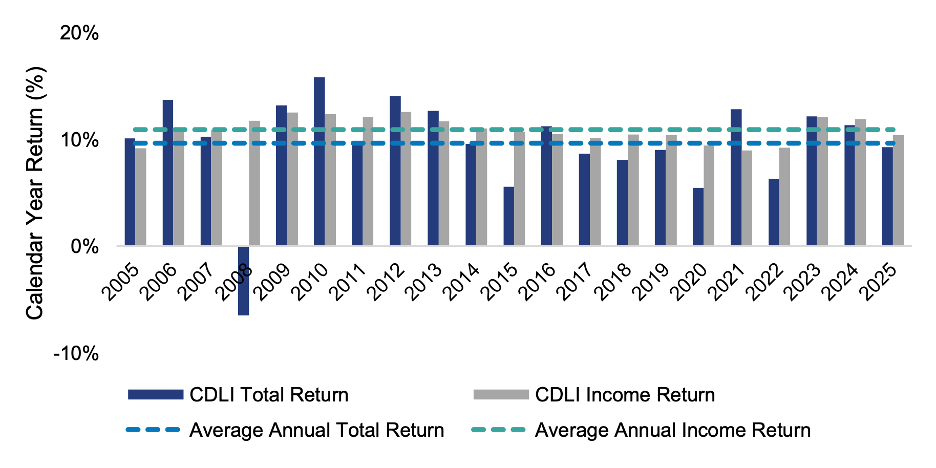
This distinction is important. In public equities, long-term averages rarely resemble the path investors experience. In direct lending, investor outcomes have historically clustered much closer to that average.
The explanation lies in the structure of the asset class. Direct lending returns are driven primarily by contractual income, with defaults emerging sporadically and partially offset by recoveries. Fees are known, and leverage, when used, follows a defined framework. The result is a return profile determined less by market sentiment and more by cash flows, lender quality, and borrower health.
It’s Simple Math
Direct lending returns can be broken into three observable components:
Unlevered Return ≈ Income – Credit Gains or Losses – Fees & Expenses
Each component is measurable and grounded in historical data:
- Income is driven by contractual loan yields
- Credit gains or losses reflect defaults and recoveries
- Fees and expenses are relatively stable over time
This simple relationship explains much of the consistency observed in direct lending returns.
Income: The Anchor of Returns
Income is the dominant driver of direct lending returns.
Across market environments, income has remained stable and often increases during periods of stress. Since inception, the CDLI has generated consistent annual income averaging 10.93% (Exhibit 2) and average excess income of 9.22% over T-bills, reflecting the persistent spread earned by lenders for bearing credit and illiquidity risk.
Income has also demonstrated an ability to adjust to changing market conditions. In the period following the Global Financial Crisis (GFC), yields rose above 12% as credit spreads widened. More recently, yields again exceeded 12% in the period following 2022, driven primarily by higher base rates.
Exhibit 2: Trailing 4Q CDLI Income Return vs. T-Bill Yields
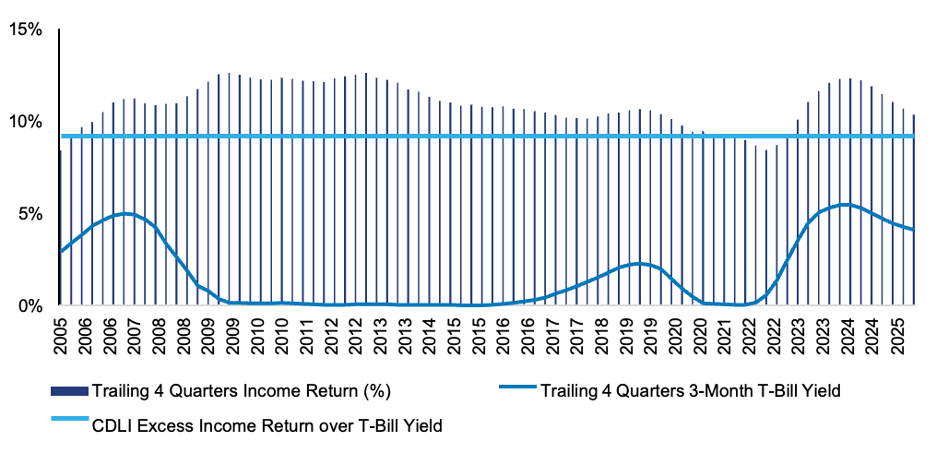
Income accrues continuously and has historically represented the vast majority of total returns in direct lending and been the dominant driver of long-term outcomes.
Credit Gains and Losses: Short- and Long-Term Impact
In understanding the impact of credit gains and losses on direct lending returns, it is important to distinguish between unrealized, which contribute to short-term variability in direct lending, and realized, which represent long-term and permanent credit events.
Unrealized gains/losses reflect changes in the fair value of loans based on evolving expectations for credit performance and broader market conditions, influencing, but not determining, the path of long-term results. Over time, the impact of unrealized gains and losses tends to diminish. As loans repay or default, interim marks give way to realized outcomes.
Realized gains and losses represent the permanent component of credit events. Realized losses primarily arise from borrower defaults and subsequent restructurings. Historically, these losses have been modest, averaging 1% annually since inception of the CDLI, and gradual, as losses are absorbed over time even during periods of significant stress.
Importantly, unrealized losses have historically preceded realized losses. As credit conditions deteriorate, loans are written down in advance of default. In many ways, these marks function as a forward-looking loss reserve, incorporating expected impairments before they are formally realized.
The most notable example occurred in 2008, when mark-to-market losses drove a negative return for the CDLI despite continued income generation. Unrealized losses exceeded 16% as lenders reduced portfolio values in response to rapidly deteriorating conditions. Those early markdowns ultimately proved more conservative than necessary. Realized losses that followed were meaningfully lower than initially implied, and the reversal of those unrealized losses contributed to stronger returns in subsequent years.
Exhibit 3: CDLI Historical Return Attribution (2005-2025)
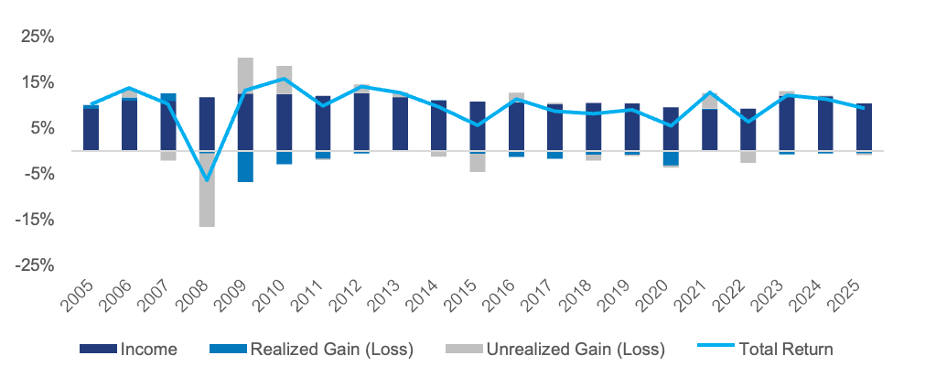
In many cases, the realization of losses also marks a turning point. Once impaired assets are resolved, portfolios are effectively reset, allowing subsequent income to accrue on a cleaner base of investments.
Putting It All Together: Return Composition Over Time
The individual components together help capture direct lending returns.
Using more than 20 years of CDLI data, returns can be decomposed across different time horizons to better understand how income, unrealized marks, and realized losses interact. While any single year may reflect volatility from valuation changes or episodic credit events, the composition of returns becomes more stable as the time horizon extends.
Exhibit 4: CDLI Return Composition Across Rolling Time Horizons (2005-2025)
|
Period |
Total Return |
Income Return |
Unrealized G/L |
Realized G/L |
|
1-Year (Median) |
10.1% |
10.9% |
0.1% |
-0.7% |
|
1-Year (Worst) |
-6.5% |
8.4% |
-16.2% |
-9.3% |
|
1-Year (Best) |
16.4% |
12.6% |
12.0% |
2.0% |
|
3-Year (Ann. Median) |
9.1% |
10.9% |
-0.1% |
-1.1% |
|
3-Year (Ann. Worst) |
5.0% |
9.1% |
-6.2% |
-3.9% |
|
3-Year (Ann. Best) |
13.5% |
12.3% |
5.0% |
1.1% |
Several observations stand out:
- First, even in weaker years, contractual income has provided a meaningful cushion against losses and valuation volatility.
- Second, periods of negative unrealized marks have historically been followed by stabilization or reversal as credit outcomes develop.
- Third, losses are typically spread over multiple years and more than offset by ongoing income.
Taken together, these components help explain why direct lending returns have historically clustered within a relatively narrow range, particularly over multi-year periods. Even at the extremes, the underlying arithmetic remains intact.
A Closer Look: Defaults and Recoveries
Credit losses, often the focal point of downside narratives, are derived from default rates and recovery rates. Default rates determine how often loans fail. Recovery rates determine how much capital is preserved when they do.
A growing concern today is that recovery rates may weaken, particularly in areas like software where business models are perceived as less asset-heavy and potentially more vulnerable in a downturn.
A useful exercise is to frame the magnitude of that risk. Software and information technology represent approximately 24% of the private debt market. Even under a drastic scenario where all software borrowers default over five years with no recovery, implied credit losses at the asset class level would approximate 5% annually. Starting from current yields near 9.5%, total returns would still be in the range of 4% to 5%, broadly in line with investment-grade credit1.
While that stress test is intentionally draconian, actual recovery outcomes in the recent past have remained consistent with long-term experience. In 2025, first lien recoveries were approximately 48.8%, in line with a 10-year average of 48.6%, while second lien recoveries were approximately 37.5% compared to a 10-year average of 32.3%.
Strong historical recoveries for direct lending as a whole are supported by several structural features of the asset class, including low loan-to-value ratios, strong sponsor involvement, coordinated lender groups, and greater control in restructuring situations. Together, these characteristics have contributed to loss rates that have remained manageable over time.
From Gross to Net: The Impact of Fees and Leverage
Fees and leverage do not drive returns, but they determine how much investors keep.
Cliffwater research shows total fees and expenses across private debt strategies average approximately 3.81% of net assets, though the range varies meaningfully by structure2. Vehicles designed for perpetual capital, including non-traded BDCs and credit interval funds, have generally exhibited lower fee profiles than traditional drawdown structures and legacy BDCs.
Recent data highlights this dispersion. As of December 2025, perpetual BDCs averaged total fees of approximately 3.05% of net assets, compared to 4.68% for non-perpetual BDCs3. Credit interval funds have generally fallen below both, averaging approximately 2.34%.
These differences are often paired with different leverage profiles. Non-perpetual BDCs have typically operated with higher leverage, often around 1.0x debt-to-equity, while credit interval funds tend to employ more moderate leverage, commonly in the 0.25-0.35x range4.
Leverage builds on the unlevered return framework. It amplifies (for better or worse) the result. When employed prudently, leverage can enhance returns by capturing the spread between asset yields and financing costs, while also helping to offset the impact of fees:
Levered Return ≈ Unlevered Return + (Leverage × (Asset Yield – Cost of Debt))
When asset yields exceed financing costs, leverage increases the income generated on equity capital and can help offset fee drag. Higher-fee structures often rely more heavily on leverage to bridge that gap, while lower-fee, more-diversified structures can achieve similar outcomes with less reliance on leverage.
In the end, fees and leverage influence how returns are distributed, but they do not alter the underlying return drivers. Income remains the foundation, and credit losses determine what is retained.
In Closing
Direct lending is often described as complex, but its return drivers are anything but. Income, losses, fees, and leverage have governed private debt results for more than 20 years and across multiple cycles. Viewed through that lens, the range of outcomes is not only understandable, but remarkably consistent.
When headlines and fundamentals diverge, the math tends to win over time.
Written by Phil Huber, CFA, CFP® Head of Portfolio Solutions at Cliffwater
Sources:
1. Cliffwater Research “Ten Misconceptions About Private Debt” (April 2026)2. Cliffwater Research: “No Fee Compression in Private Debt” (March 2025)3. Cliffwater Research: “Perpetual BDC Performance Remains Consistent with Historical Averages” (April 2026)4. Interval funds are regulated under the Investment Company Act of 1940 and are generally limited to a maximum debt-to-equity ratio of 0.5x.
Important Disclosure Information
The views expressed herein are the view of Cliffwater LLC (“Cliffwater”) only through the date of this report and are subject to change based on market or other conditions. All information has been obtained from sources believed to be reliable but its accuracy is not guaranteed. Cliffwater has not conducted an independent verification of the information. The information herein may include inaccuracies or typographical errors. Due to various factors, including the inherent possibility of human or mechanical error, the accuracy, completeness, timeliness and correct sequencing of such information and the results obtained from its use are not guaranteed by Cliffwater. No representation, warranty, or undertaking, express or implied, is given as to the accuracy or completeness of the information or opinions contained in this report. This report is not an advertisement, is being distributed for informational and discussion purposes only, should not be considered investment advice, and should not be construed as an offer or solicitation of an offer for the purchase or sale of any security. The information herein does not take into account any investor’s particular investment objectives, strategies, tax status or investment horizon. Cliffwater shall not be responsible for investment decisions, damages, or other losses resulting from the use of the information. This report is not intended for public use or distribution. The information contained herein is confidential commercial or financial information, the disclosure of which would cause substantial competitive harm to you, Cliffwater, or the person or entity from whom the information was obtained, and may not be disclosed except as required by applicable law.
The information in this report is not intended as a recommendation to invest in any particular asset class or strategy or as a promise of future performance. Note that these asset class and strategy assumptions are passive only, and they do not consider the impact of active management. References to future returns are not promises or even estimates of actual returns a client portfolio may achieve.
Statements that are nonfactual in nature, including opinions, projections and estimates, assume certain economic conditions and industry developments and constitute only current opinions that are subject to change without notice. Further, all information, including opinions and facts expressed herein are current as of the date appearing in this report and is subject to change without notice. Unless otherwise indicated, dates indicated by the name of a month and a year are end of month.
There can be no assurance that any expected rates of return or risk will be achieved. Expected rates of return and risk are subjective determinations by Cliffwater based on a variety of factors, including, among other things, investment strategy, prior performance of similar strategies, and market conditions. Expected rates of return may be based upon assumptions regarding future events and conditions that prove to be inaccurate. Expected rates of return and risk should not be relied upon as an indication of future performance and should not form the primary basis for an investment decision. No representation or assurance is made that the expected rates of return or risk will be achieved.
This report may include sample or pro forma performance. Such information is presented for illustrative purposes only and is based on various assumptions, not all of which are described herein. Such assumptions, data, or projections may have a material impact on the returns shown. Nothing contained in this report is, or shall be relied upon as, a representation as to past or future performance, and no assurance, promise, or representation can be made as to actual returns. Past performance is not indicative of future returns, which may vary. Future returns are not guaranteed, and a loss of principal may occur.
S&P 500 is a stock market index tracking the stock performance of 500 leading companies listed on stock exchanges in the United States
The Cliffwater Direct Lending Index (the “CDLI”) seeks to measure the unlevered, gross of fees performance of U.S. middle mar ket corporate loans, as represented by the underlying assets of Business Development Companies (“BDCs”), including both exchange – traded and unlisted BDCs, subject to certain eligibility requirements. The CDLI is an asset-weighted index that is calculated on a quarterly basis using financial statements and other information contained in the U.S. Securities and Exchange Commission (“SEC”) filings of all eligible BDCs. Cliffwater believes that the CDLI is representative of the direct lending asset class. The CDLI is owned exclusively by Cliffwater, and is protected by law including, but not limited to, United States copyright, trade secret, and trademark law, as well as other state, national, and international laws and regulations. Cliffwater provides this information on an “as is” and “as available” basis, without
Past performance of the CDLI is not an indication of future results. It is not possible to invest directly in the CDLI. The CDLI returns shown are not based on actual advisory client returns and do not reflect the actual trading of investible assets. The performance of the CDLI have not been reviewed by an independent accounting firm and has been prepared for informational purposes only.
Index returns do not reflect payment of any sales charges or fees a person may pay to purchase the securities underlying the CDLI or a product that is intended to track the performance of the CDLI. The imposition of these fees and charges would cause the actual and back-tested performance of these securities or products to be lower than the CDLI performance shown.
Any information presented prior to the Launch Date of the CDLI (September 30, 2015) is back-tested. Back-tested performance is not actual performance but is hypothetical. The back-tested calculations are based on the same methodology that was in effect when the CDLI were officially launched. Please refer to the methodology paper for the CDLI (available at www.CliffwaterDirectLendingIndex.com) for more details about the CDLI, including the Base Date/Value (September 30, 2004 at 1,000) and the Launch Date of the CDLI and the manner in which the CDLI is reconstituted and the eligibility criteria for the CDLI.
Prospective application of the methodology used to construct the CDLI may not result in performance commensurate with any back-tested returns shown. The back-test period does not necessarily correspond to the entire available history of the CDLI . Another limitation of back-tested hypothetical information is that generally the back-tested calculation is prepared with the benefit of hindsight. Back-tested data reflect the application of the CDLI methodology and selection of the CDLI constituents in hindsight. No hypothetical record can completely account for the impact of financial risk in actual trading. For example, there are numerous factors related to the financial markets in general which cannot be, and have not been, accounted for in the preparation of the CDLI information set forth, all of which can affect actual performance.
The CDLI data contained herein cannot be reused for any purposes without the expressed written consent of Cliffwater.
References to market or composite indices, benchmarks or other measures of relative market performance over a specified period of time (each, an “index”) are provided for information only. Reference to an index does not imply that a portfolio will achieve returns, volatility or other results similar to the index. The composition of an index may not reflect the manner in which a portfolio is constructed in relation to expected or achieved returns, portfolio guidelines, restrictions, sectors, correlations, concentrations, volatility or tracking error targets, all of which are subject to change over time.
Cliffwater is a service mark of Cliffwater LLC.