

Betashares
5 minutes reading time
Australian ETF Industry sets new inflow record at nearly $6B
- A record $5.99 billion of inflows in October, plus positive market movements, helped the Australian ETF industry to a new record high of $321.7B in funds under management– a rise of $12.5B or 4.03%
- Industry inflows for the month were a record $5.99B – surpassing the record set in July this year, and only the third time that monthly inflows have been above $5B
- ASX trading value was ~$18B in October
- Over the last 12 months the Australian ETF industry has grown by 38.4%, or $89.2B
- 11 new funds, including the Betashares FTSE Global Infrastructure Shares Currency Hedged ETF (ASX: TOLL), launched in October
- The Betashares Global Gold Miners Currency Hedged ETF (ASX: MNRS) retains its YTD performance lead, however a Hydrogen exposure was the best performing fund in October
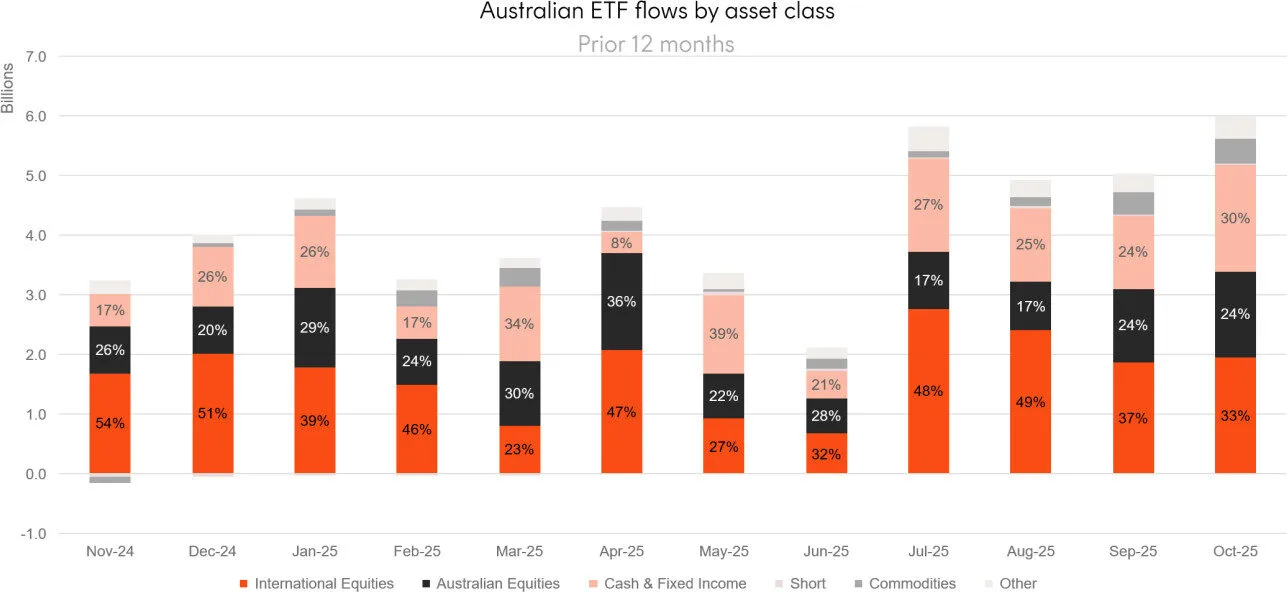
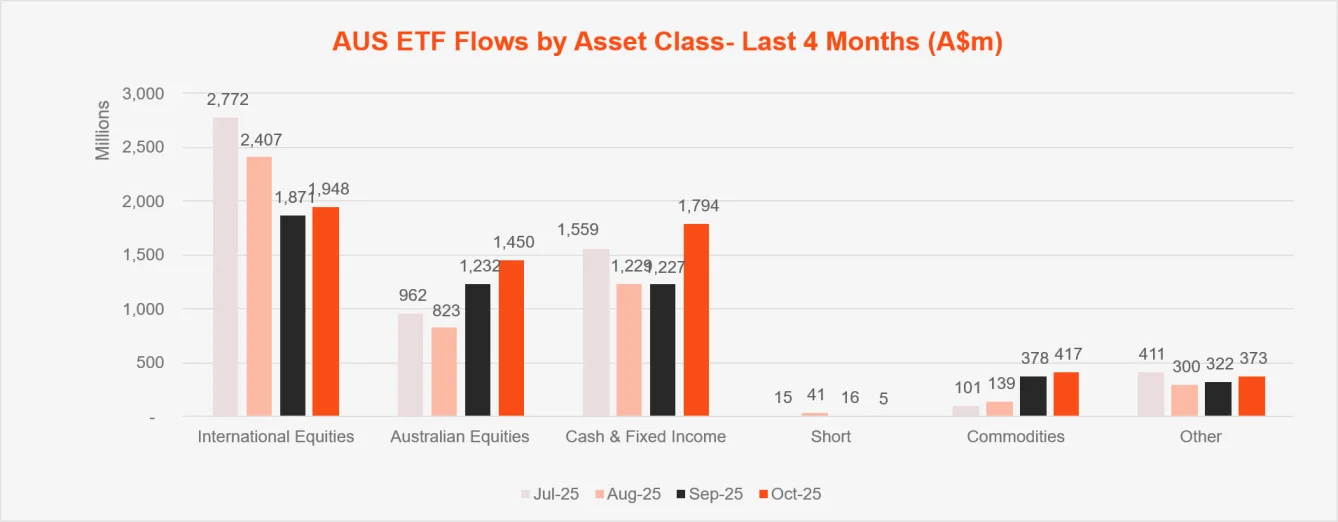
- International Equity ETFs continued their streak of receiving the highest level of flows with $1.9b, Australian Equities followed with $1.45b, while Fixed Income ($1.38b) rounded out the top three.
Australian ETF Industry AuM: July 2001 – October 2025
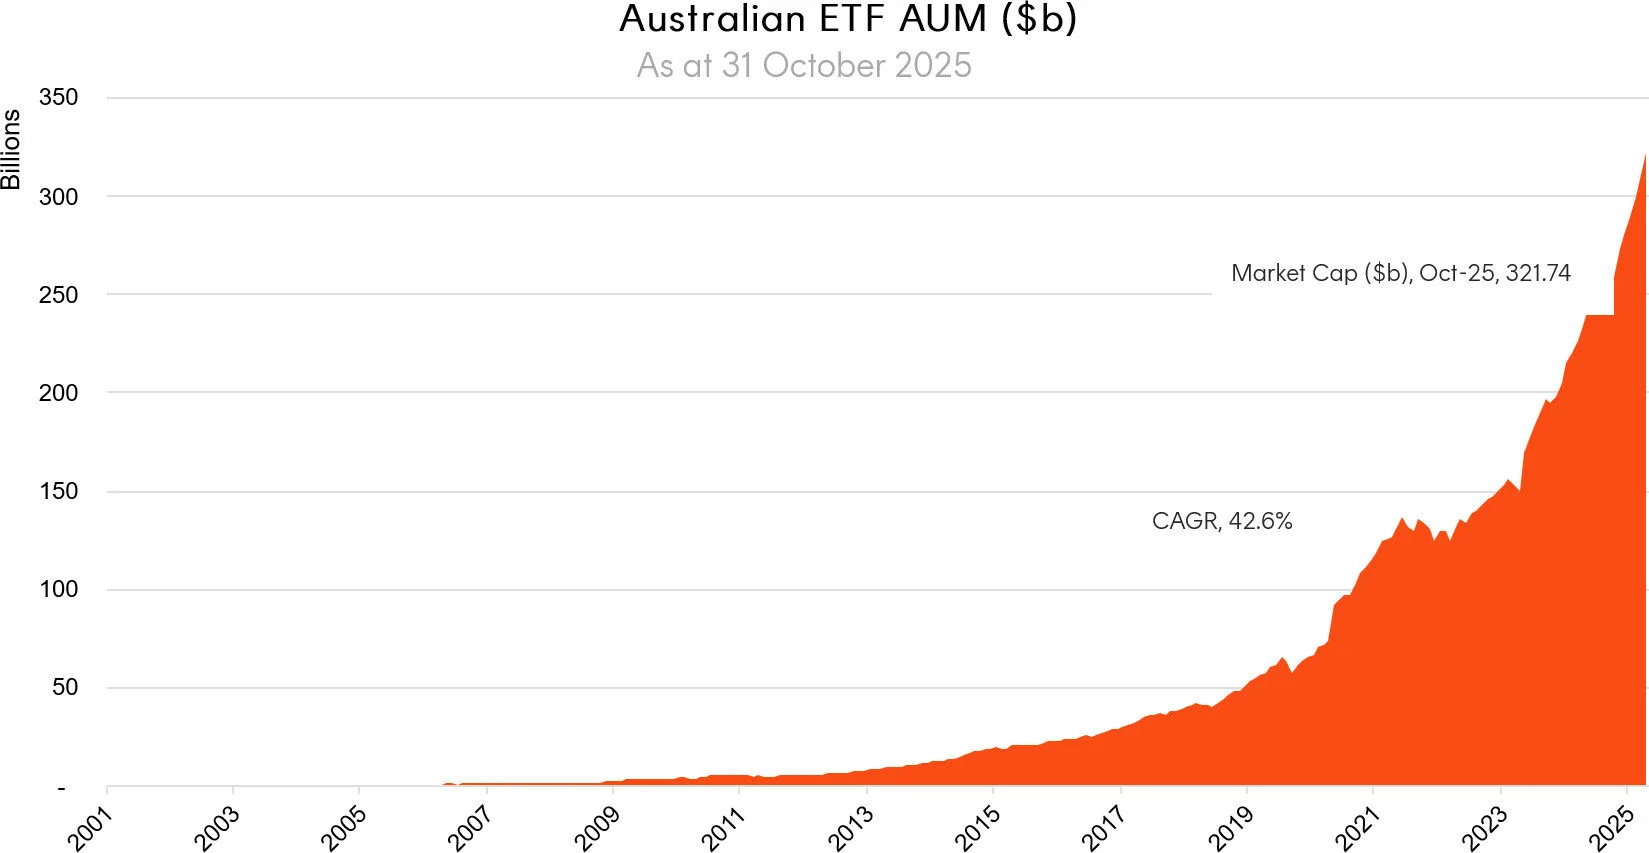
CAGR: Compound Annual Growth Rate. Source: ASX, CBOE
Market Cap
- Australian Exchange Traded Funds Market Cap (ASX + CBOE): $321.7B – all time high
- ASX CHESS Market Cap: $275.09B1
- Market Cap change for September: 4.03%, $12.5B
- Market cap growth for last 12 months: 38.4%, or $89.2B.
New Money
- Net inflows for month: $5.99B – all time high.
Products
- 451 Exchange Traded Products trading on the ASX & Cboe
- 11 new funds, including the Betashares FTSE Global Infrastructure Shares Currency Hedged ETF (ASX: TOLL), launched in October.
Trading Value
- ASX trading value was ~$18B in September.
Performance
- The Betashares Global Gold Miners Currency Hedged ETF (ASX: MNRS) retains its YTD performance lead, however a Hydrogen exposure was the best performing fund in October.
Top 10 products: October 2025
Top 10 Products: By Market Cap |
||||
|
Ticker |
Product |
Issuer |
Market Cap |
Rank Movement |
|
VAS |
Vanguard Australian Shares Index ETF |
Vanguard |
$22,678,424,117 |
|
|
VGS |
Vanguard MSCI Index International Shares ETF |
Vanguard |
$13,861,698,429 |
|
|
IVV |
iShares S&P 500 ETF |
iShares |
$12,899,044,293 |
|
|
A200 |
Betashares Australia 200 ETF |
Betashares |
$8,643,893,052 |
|
|
QUAL |
VanEck MSCI World Ex-Australia Quality ETF |
VanEck |
$7,974,757,759 |
+1 |
|
NDQ |
Betashares NASDAQ 100 ETF |
Betashares |
$7,906,404,354 |
+1 |
|
IOZ |
iShares Core S&P/ASX 200 ETF |
iShares |
$7,832,737,634 |
-2 |
|
MGOC |
Magellan Global Fund (Open Class) (Managed Fund) |
Magellan |
$6,789,992,056 |
|
|
DACE |
Dimensional Australian Core Equity Trust (Managed Fund) |
Dimensional |
$6,449,651,288 |
|
|
VTS |
Vanguard US Total Market Shares Index ETF |
Vanguard |
$6,410,666,785 |
+1 |
|
Other products with > $3B AUM: AAA, BGBL, DFGH, DGCE, ETHI, GOLD, HYGG, IAF, IHVV, IOO, MVW, STW, SUBD, VAF, VAP, VBND, VDHG, VEU, VGAD, VHY Average Daily Trading Value (by $) – Month |
||||
|
Ticker |
Product |
Issuer |
ADTV |
Rank Movement |
|
VAS |
Vanguard Australian Shares Index ETF |
Vanguard |
$39,259,637 |
|
|
GOLD |
Global X Physical Gold |
Global X |
$34,974,213 |
+7 |
|
AAA |
Betashares Australian High Interest Cash ETF |
Betashares |
$33,628,464 |
-1 |
|
IVV |
iShares S&P 500 ETF |
iShares |
$27,395,580 |
-1 |
|
VGS |
Vanguard MSCI Index International Shares ETF |
Vanguard |
$24,345,842 |
|
|
NDQ |
Betashares NASDAQ 100 ETF |
Betashares |
$22,580,244 |
+1 |
|
A200 |
Betashares Australia 200 ETF |
Betashares |
$21,142,698 |
-3 |
|
PMGOLD |
Perth Mint Gold |
Perth Mint |
$19,443,958 |
+14 |
|
IOZ |
iShares Core S&P/ASX 200 ETF |
iShares |
$18,009,069 |
-3 |
|
SUBD |
VanEck Australian Subordinated Debt ETF |
VanEck |
$16,182,159 |
+4 |
Top 10 Inflows (by $) – Month |
||||
|
Ticker |
Product |
Inflow Value |
||
|
VAS |
Vanguard Australian Shares Index ETF |
$329,098,290 |
||
|
AAA |
Betashares Australian High Interest Cash ETF |
$298,488,782 |
||
|
VGS |
Vanguard MSCI Index International Shares ETF |
$261,463,435 |
||
|
A200 |
Betashares Australia 200 ETF |
$228,948,965 |
||
|
VBND |
Vanguard Global Aggregate Bond Index (Hedged) ETF |
$220,359,109 |
||
|
SUBD |
VanEck Australian Subordinated Debt ETF |
$208,999,383 |
||
|
IOZ |
iShares Core S&P/ASX 200 ETF |
$195,004,905 |
||
|
BGBL |
Betashares Global Shares ETF |
$168,994,618 |
||
|
IJP |
iShares MSCI Japan ETF |
$159,612,852 |
||
|
VHY |
Vanguard Australian Shares High Yield ETF |
$145,056,683 |
||
Top 10 Outflows (by $) – Month |
||||
|
Ticker |
Product |
Inflow Value |
||
|
XALG |
Alphinity Global Equity Fund (Managed Fund) |
-$143,683,705 |
||
|
MGOC |
Magellan Global Fund (Open Class) (Managed Fund) |
-$135,520,212 |
||
|
IHOO |
iShares Global 100 AUD Hedged ETF |
-$52,486,384 |
||
|
FANG |
Global X FANG+ ETF |
-$41,618,870 |
||
|
U100 |
Global X US 100 ETF |
-$39,353,426 |
||
|
VLUE |
VanEck MSCI International Value ETF |
-$39,249,169 |
||
|
QUAL |
VanEck MSCI World Ex-Australia Quality ETF |
-$34,110,062 |
||
|
QUS |
Betashares S&P 500 Equal Weight ETF |
-$32,104,939 |
||
|
QAU |
Betashares Gold bullion ETF – Currency Hedged |
-$29,268,686 |
||
|
HIGH |
Schroder Australian High Yielding Credit Fund – Active ETF |
-$22,096,591 |
||
Industry Net Flows
Top Category Inflows (by $) – Month
|
Broad Category |
Inflow Value |
|
International Equities |
$1,948,268,922 |
|
Australian Equities |
$1,449,976,925 |
|
Fixed Income |
$1,384,360,273 |
|
Commodities |
$417,091,325 |
|
Cash |
$409,363,545 |
Top Sub-Category Inflows (by $) – Month
|
Sub-Category |
Inflow Value |
|
Australian Equities – Broad |
$1,049,558,019 |
|
Australian Bonds |
$994,906,542 |
|
International Equities – Developed World |
$881,156,080 |
|
Cash |
$409,363,545 |
|
Global Bonds |
$377,661,527 |
Top Category Outflows (by $) – Month
No outflows recorded by broad category
Top Sub-Category Outflows (by $) – Month
|
Sub-Category |
Inflow Value |
|
Australian Equities – E&R – Impact |
-$5,247,925 |
Performance
Top Performing Products – Month
|
Ticker |
Product Name |
Performance (%) |
|
HGEN |
Global X Hydrogen ETF |
27.69% |
|
IKO |
iShares MSCI South Korea Capped Index ETF |
23.36% |
|
ETPMPD |
Global X Physical Palladium |
20.04% |
|
SEMI |
Global X Semiconductor ETF |
17.61% |
|
ATOM |
Global X Uranium ETF |
16.52% |