


The second Trump presidency has entrenched an era of government intervention in trade and industry that began when the pendulum swung back towards deglobalisation during Covid.
Market-based efficiency has been subordinated to the drive for self-sufficiency and control over key technologies, supply chains and critical raw materials. For commodities, that shift is changing who buys, why, and how much they are willing to pay.
For investors, the intersection of geopolitics and commodities is both a risk and an opportunity. Politically driven commodity cycles tend to be less predictable and more volatile than market-driven ones, as this year’s swings in the oil price have shown.
The offsetting opportunity is that policy-mandated demand is durable, and where access to a commodity is a matter of national security, buyers tend to be far less price-sensitive.
Ukraine and Middle East convergence
Despite campaigning on no more “forever wars” Trump finds himself in a bind, with Iran so far unwilling to offer him an offramp. After a period of relative stability with Brent crude range bound, it broke above US$100 a barrel in early September on retaliatory US strikes on Iranian tankers. The Houthis then attacked Saudi Arabia’s key East-West pipeline, through which the Kingdom has been able to keep exporting some oil despite the closure of the Strait of Hormuz.
Yet, the escalation has been contained, with Iran and the US limiting their attacks to shipping, rather than damaging oil infrastructure. And critically, there has been a sustained increase in the transit of crude carriers through the Strait of Hormuz, with the assistance of US escorts.
During September it’s estimated that roughly 10-11 million barrels per day passed through the strait, about half the pre-war levels, but well up on 5 million barrels per day of Q2 2026.1 Exports from the region that bypass the Strait of Hormuz have also helped to offset the shortfall.
Middle East and North Africa Seabourne Crude Oil Exports: Jan 2026 – Sept 2026
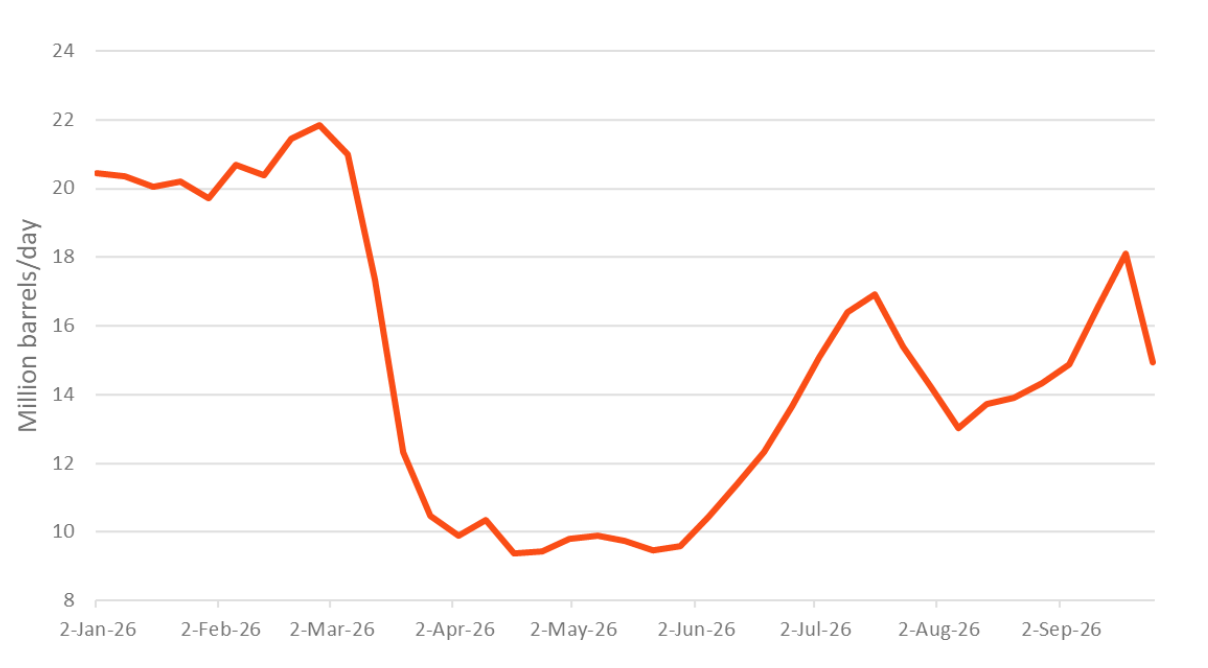
Source: Bloomberg, Betashares. Three month moving average shown.
For the time being enough crude oil is getting through, but global inventories and strategic petroleum reserves have been drawn down at an average 2.8 MMb/d since the crisis began and are on track for multi-year lows in the fourth quarter.2 This narrowing buffer leaves the supply of crude more exposed, raising oil volatility as hostilities intensify and de-escalate.
Price volatility and intermittency of supply is creating new pressures downstream in the price of refined petroleum products such as petrol, diesel and jet fuel. This has been further exacerbated by Ukraine’s military strategy of attacking Russia’s major refineries.
Russia has historically been a major global exporter of diesel in particular, but faces fuel shortages at home and has been forced to actually import diesel.
European diesel refining margins (ICE gasoil crack spreads) vs brent crude oil prices: Sept 2024 – Sept 2026
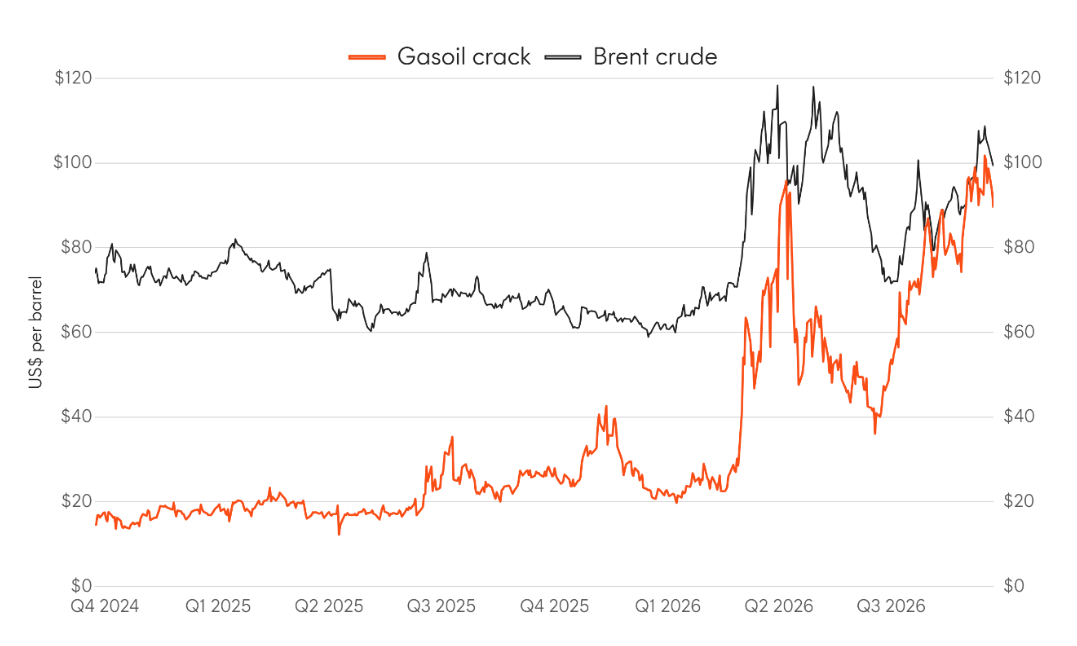
Source: Bloomberg, Betashares. Gasoil crack, left axis; Brent crude, right axis. Both US$ per barrel. As at 22 September 2026. Gasoil converted from tonnes to barrels at 7.45 bbl per tonne, then less Brent crude. The crack is a proxy for diesel refining margins: a wider crack means diesel is richer relative to crude.
As a result refining margins (the so-called “crack spread” that a refiner can make for converting a crude to refined product) have hit record levels.
Energy security and AI tailwinds for commodity prices
These twin geopolitical crises are forcing governments to prioritise energy security and address supply chain vulnerability particularly in energy and critical minerals.
The US policy of “energy dominance” focusses on producing enough oil and gas to keep domestic prices low and allow exports, thus increasing US leverage over countries buying that oil and gas. The US has cemented its status as the world’s number one producer pumping 13.5 million oil barrels per day3.
The rest of the world may depend on the Middle East for oil and gas, but China has significant leverage in renewables and critical minerals. China currently has a global market share of ~75% in lithium-ion batteries, 90% in rare earth magnets; and Chinese firms lead in solar panels, wind turbines, grid equipment, as well as the EVs and drones built using these components4.
This is the result of decades of industrial policy, building manufacturing scale and lowering its cost curve. China also controls over half the world’s processing of critical minerals like lithium, cobalt, manganese and graphite.
To address this risk the US administration has now established a multilateral agreement, Pax Silica, to strengthen the ex-China supply of critical minerals. Producers of these minerals from signatory and aligned countries, like Australia, Canada, Peru and Chile, are likely to benefit from strategic government support, including cheap financing, tax incentives, US market access and greater price certainty.
The 2010s commodity boom was fuelled by China’s massive infrastructure and property construction. Those tailwinds have faded, but a confluence of structural themes is set to underwrite Capex-driven commodity demand for the foreseeable future:
- AI has become an important sphere of great power competition between China and the US. The global AI data centre build-out is driving demand across a wide commodity complex, for example structural steel and aluminium for physical buildings, silver in semiconductor manufacturing, and copper in power distribution, cabling, transformers and cooling systems.
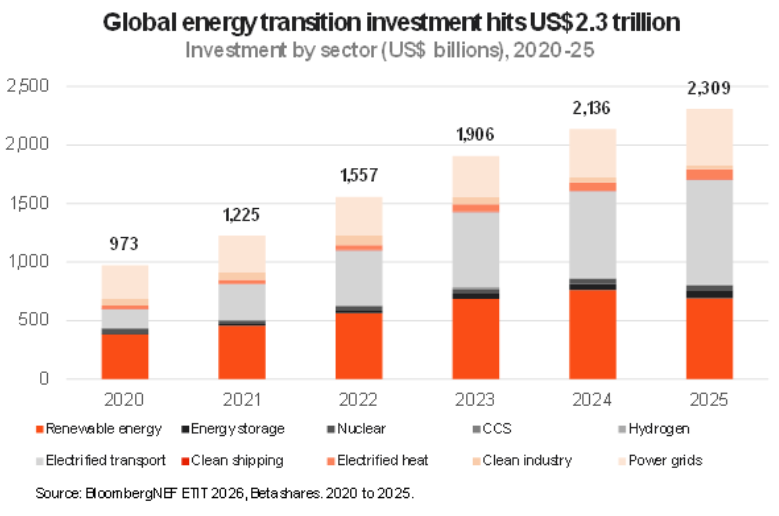
- BloombergNEF data shows global energy transition investment has more than doubled over the past five years, reaching a record $2.3 trillion in 2025.5 The Middle East energy crisis and power demand from AI are likely only to increase spending on energy systems. For example, since April, EVs and hybrids have surged to nearly one of every two new cars sold in Australia.6
- Increases in defence spending and post-conflict reconstruction activity can fuel demand for specific commodities. NATO’s rearmament, conflicts in Ukraine and the Middle East as well as AUKUS are all reliant on materials like rare earths, titanium, nickel, uranium and copper. Global aerospace and defence industry has now surpassed US$1 trillion in annual revenue for the first time,7 and the ongoing conflicts continue to deplete munitions stockpiles and reinforce the case for sustained investment in defence.
Beyond the core: leaning into commodities
In a time of heightened geopolitical tensions and energy security risk, exposure to key commodity producers may offer diversification benefits for investor portfolios, including away from the technology sector.
Record refining margins favour the integrated global oil giants
The volatility in energy markets is boosting the production, refining and trading revenues of supermajors like ExxonMobil, Chevron, BP and TotalEnergies. FUEL Global Energy Companies Currency Hedged ETF provides exposure to global energy companies that are larger and more vertically integrated than Australian-listed energy companies.
Government support for ex-China critical minerals producers
XMET Critical Minerals ETF provides exposure to around 40 of the leading global producers of critical minerals, including copper, lithium, nickel, cobalt, graphite, manganese, silver and rare earth elements. As noted above, producers in Pax Silica-aligned countries stand to benefit from this strategic government support.
Uranium: Increasing long-term contract prices and structural demand
Uranium miners have sold off this year, on concerns about sulphur supply from the Gulf countries, higher interest rates and bearish sentiment. Sulphuric acid is used in in-situ leach uranium mining, so disruption to Strait of Hormuz flows has driven acid costs higher and forced output cuts at major producers. While these supply constraints have contributed to a more supportive backdrop for uranium markets, rising long-term contract prices suggest the recent sell-off in uranium equities may be overdone. Investors can get exposure to the long-term growth in demand for uranium by investing in URNM Global Uranium ETF.
