



The Nasdaq 100 Index
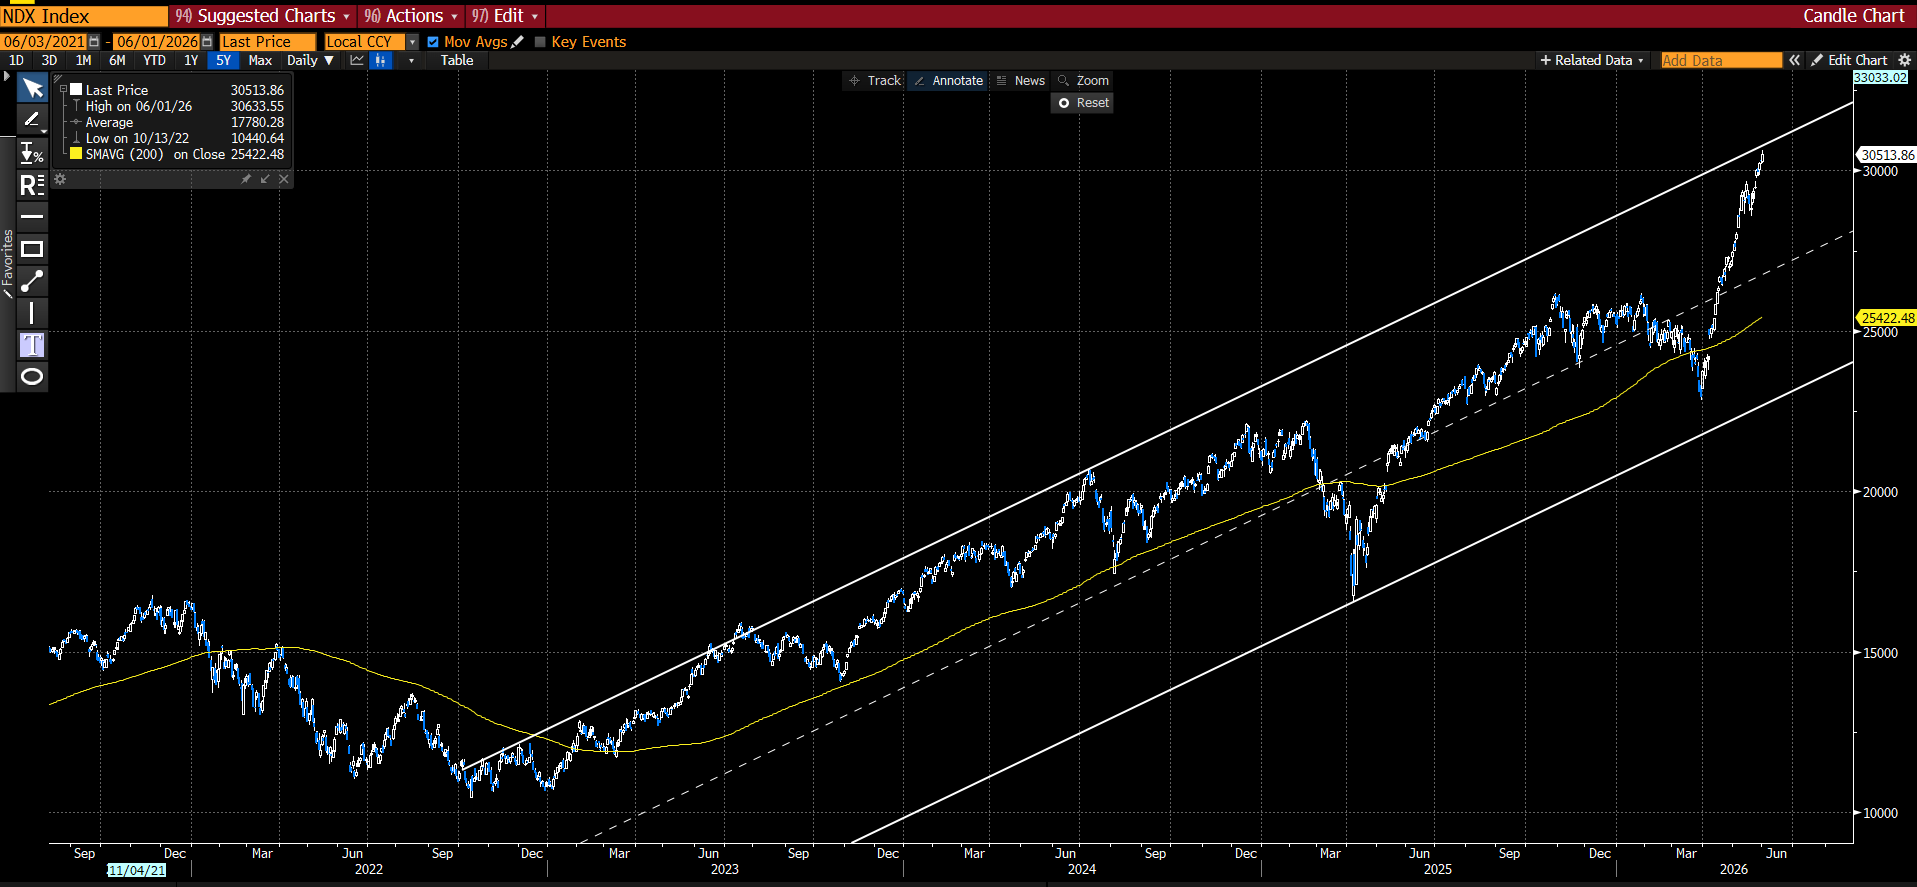
– After a brief correction, the Nasdaq 100 has rallied strongly off the lower range of its upward sloping channel (white line), with prices now moving towards the upper end of the channel.
– The trend remains strongly positive. Prices may temporarily push above the upper trend line, but over-extended in the short-term.
– Should prices pull back, the path of least resistance remains to look for long opportunities with the trend near key support levels.
Daily chart
Source: Bloomberg. View enlarged chart
Fund implementation ideas
Bitcoin
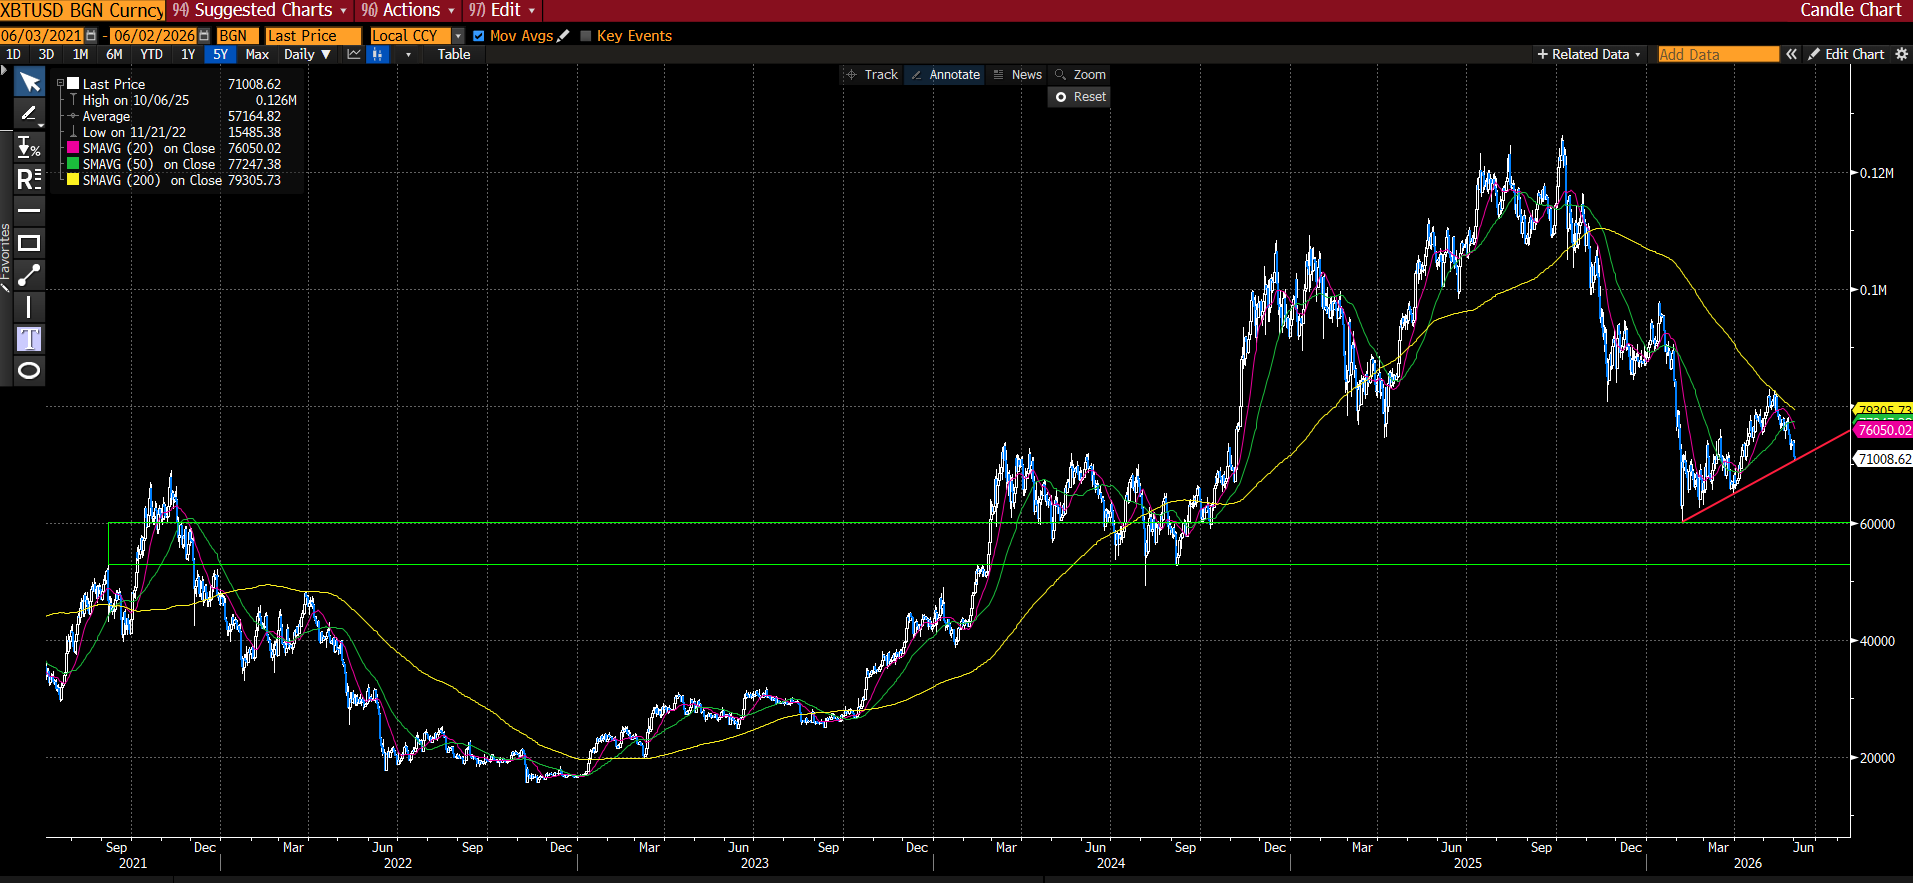
– After briefly touching US$60,000 earlier in the year, Bitcoin recovered to above US$80,000. However, the 200-day moving average (yellow) has acted as major resistance and continues to slope lower.
– Prices are now trading at key support (Red line). A break below this would increase the risk of a move back towards the prior lows around US$60,000, where key support remains (green area)
– Until prices can reclaim the 200-day moving average, the price action remains vulnerable in the short-term
Daily chart
Source: Bloomberg. View enlarged chart
Fund implementation ideas
| Bullish |
|---|
| QBTC – Bitcoin ETF |
The S&P/ASX All Technology Index
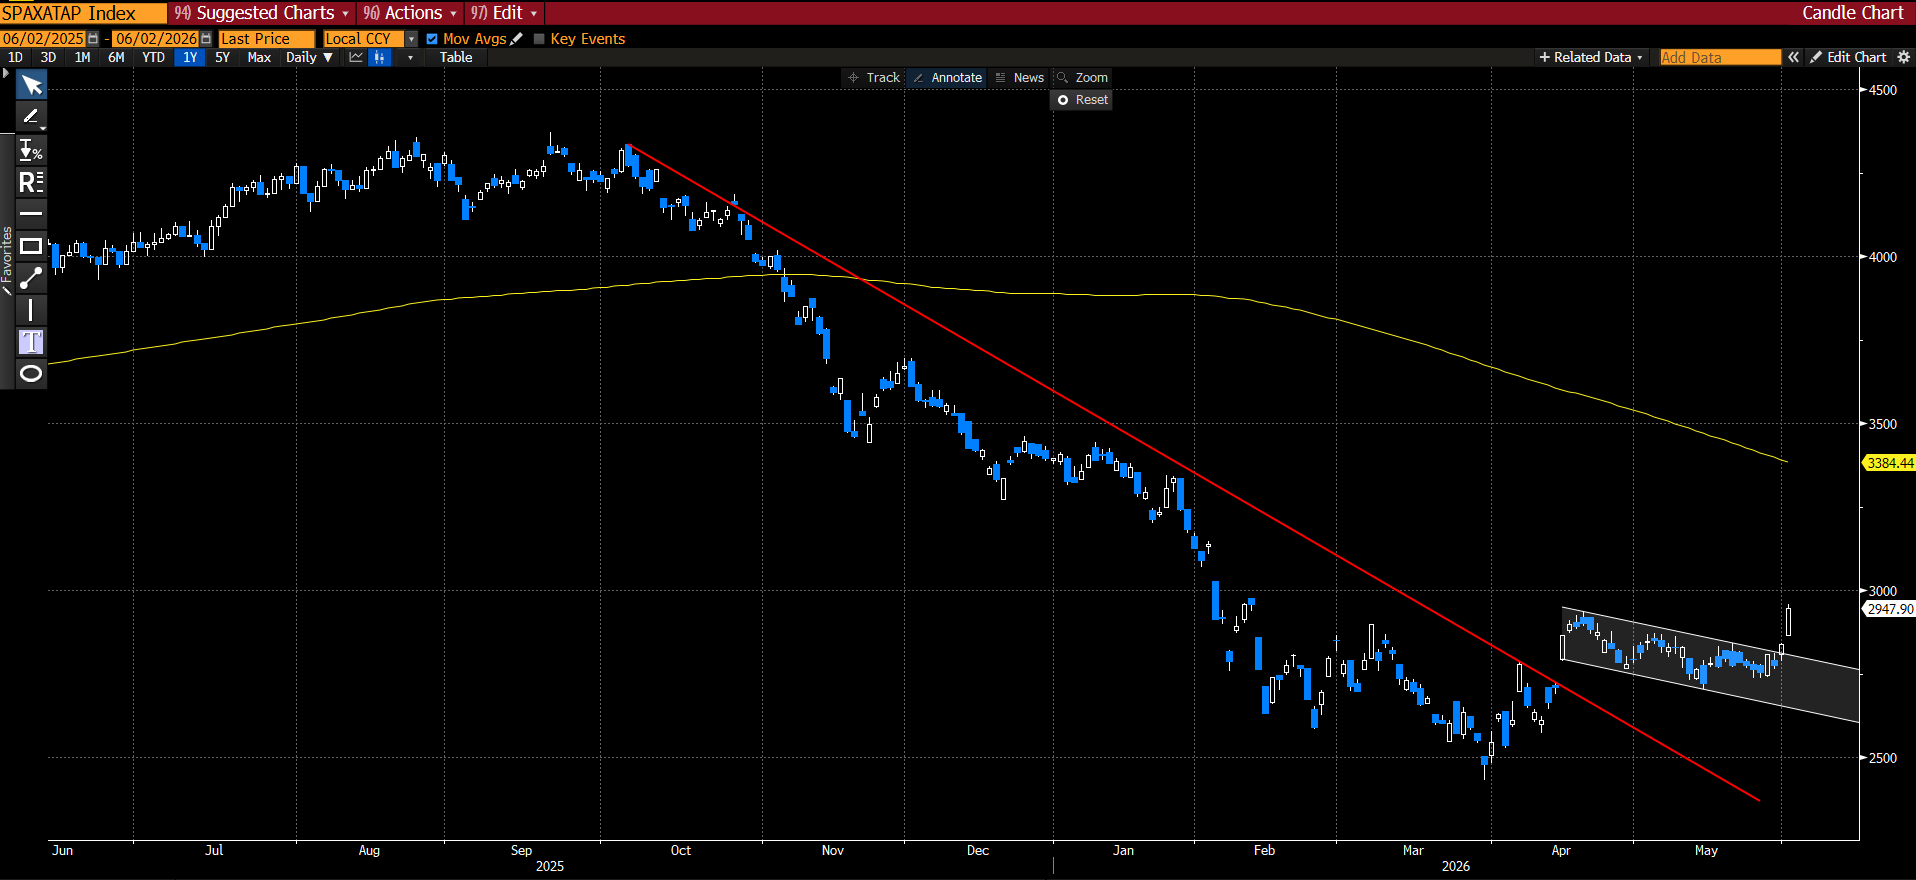
– The S&P/ASX All Technology Index is showing signs of strength. Prices have gapped above the downward sloping trend line (red), then consolidated in a bullish pattern within the white channel, forming a bull flag.
– Prices have now broken out of the channel, which is a bullish sign in the short-term and may indicate the longer-term downtrend has completed its course.Watch for resistance at the 200day moving average (yellow).
Daily chart
Source: Bloomberg. Past performance is not an indicator of future performance. You cannot invest directly in an index. View enlarged chart
Fund implementation ideas
ABOUT BETASHARES TECHNICAL WATCH SERIES
In this regular monthly Technical Watch series, I provide a snapshot of what I am currently seeing within the charts.
I am aiming to make this series as helpful as possible, so I strongly encourage readers to request a particular analysis from me. To this end, I will try to include at least one ‘reader’s choice’ chart or a chart of particular interest.
When it comes to technical analysis and charting, one should always try to put emotion and personal opinions about the markets aside in order to focus on what the charts are showing. Of course, these notes provide general information only and readers should form their own views about the outlook for markets.
