

Betashares Australian ETF Review: Half Year 2026

Matthew Reeves
4 minutes reading time
Related articles

Australian ETF Industry blasts past $280 billion in assets, $300 billion in sight
- The Australian ETF industry ended the financial year on another record high, reaching $280 billion in total assets under management after recording robust growth for the half year – as a result, $300 billion is firmly in sight for the industry.
- FUM: The Australian ETF industry increased in size by 9% for the half, recording total growth of $34.2B to end the financial year at $280.5B, a new all-time industry record.
- Net Flows: ETF industry flows were very strong over the half, with net new money sitting at $21.6B, nearly double the $11B of net flows received in the first half of 2024.
- Trading: ETF trading values were robust for the half – 58% higher than the first half of 2024, showing increased usage of the investment vehicle.
- Issuer Flows: Vanguard received the highest net flows in the first half, with $7.1 Flow concentration by issuer remains elevated, with the top 3 issuers (Betashares, Vanguard and iShares) receiving 73.75% of the industry flows for the half.
- Product launches: Product development activity was elevated this half, with 36 new products This included 3 new issuers entering the market.
- Flows by Product Type: Index funds took the lion share of ETF flows for the half receiving $17B, flows to Smart Beta ETFs were also relatively strong with $2.8B while Active funds received $1.9B.
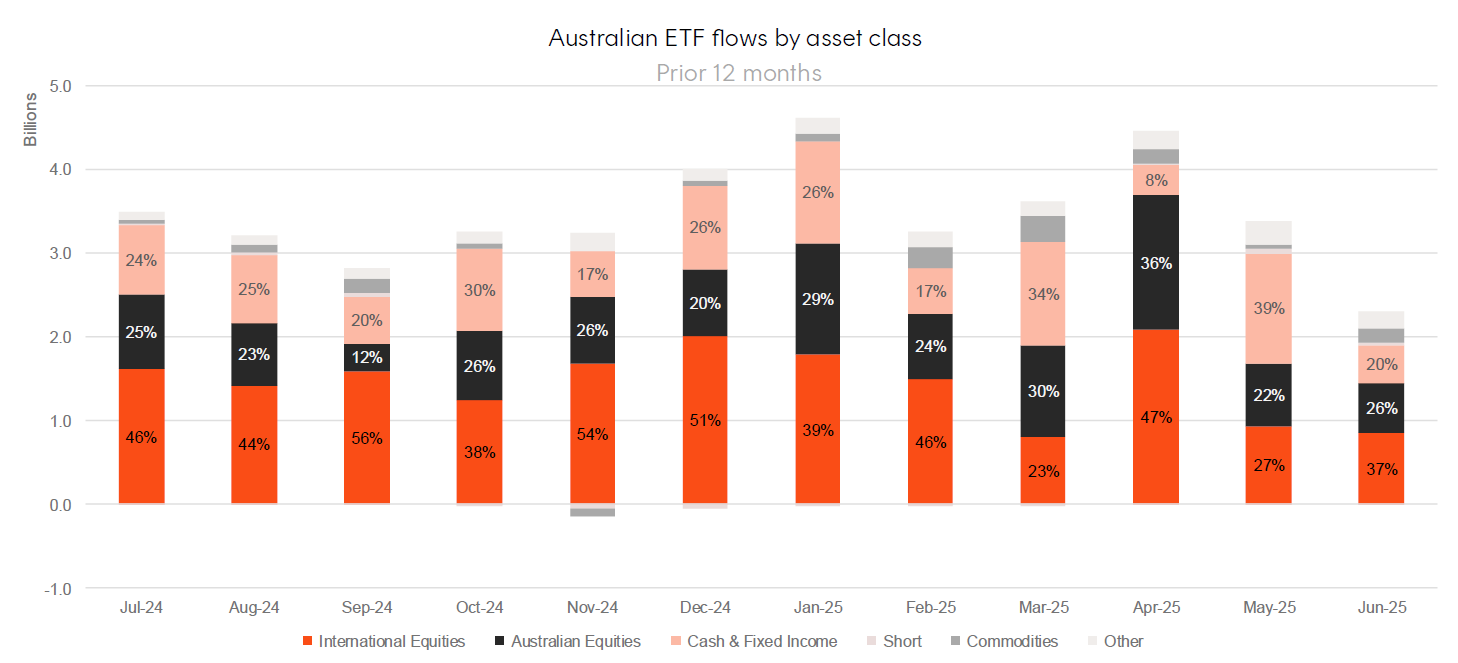
- Flows by Category: International and Australian Equities dominated flows, after receiving $8B and $6.2B in net flows respectively, with Fixed Income receiving a very strong $4.4B also.
- International Equities exposures received $8B of inflows
- Australian Equities exposures received $6.2B of inflows
- Fixed Income exposures recorded $4.4B of inflows
- No outflows on a category level were recorded over the
- Performance: In recognition of the unique circumstances facing markets, Defence and Gold Miner ETFs were the top performers over the half.
- Industry Forecast: At the end of 2024, we forecast the ETF industry to end 2025 in excess of $300B – we continue to hold conviction that the industry will pass this milestone before the end of the year.
Market Size and Growth: June 2025
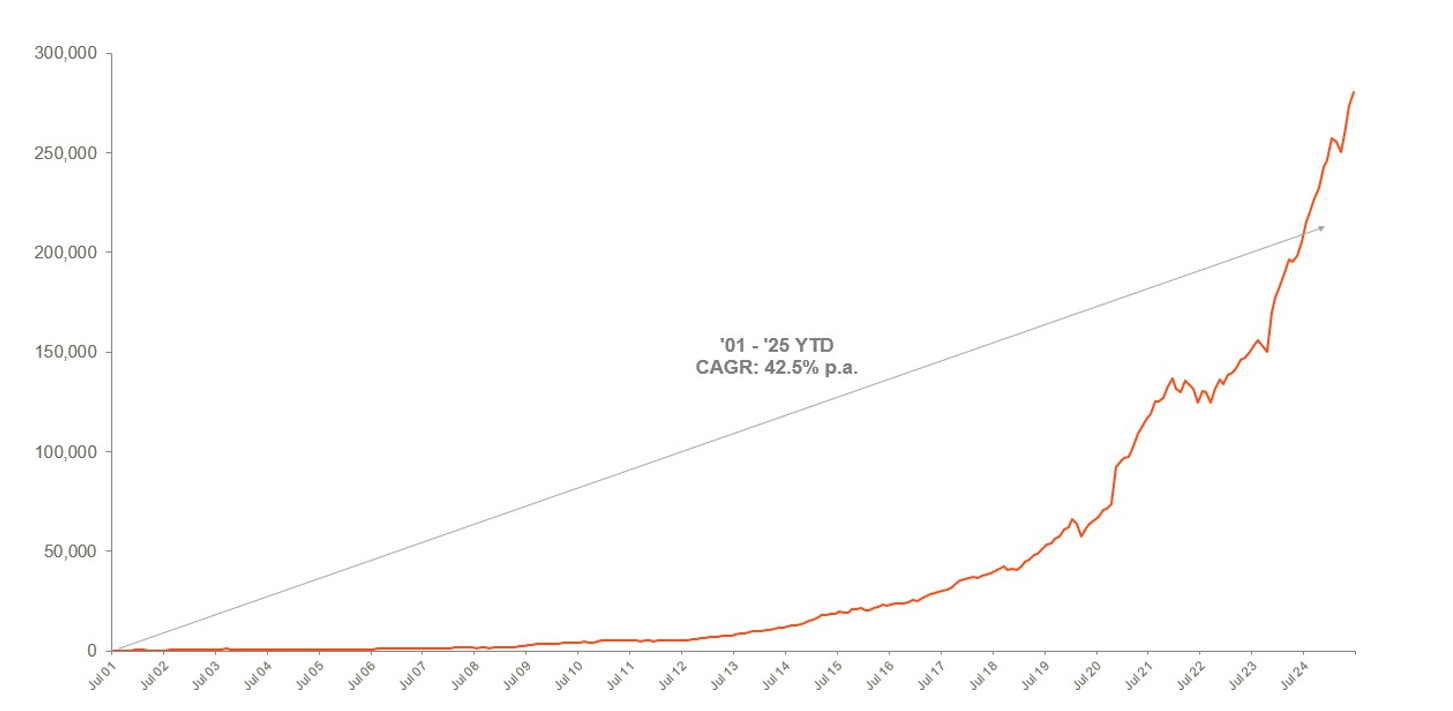
CAGR: Compound Annual Growth Rate. Source: ASX, CBOE
Market Cap
- Australian Exchange Traded Funds Market Cap (ASX + CBOE): $280.5B – new all time high
- ASX CHESS Market Cap: $238.3B1
- Market Cap increase for the half: 9.0%, $34.2B
- Market cap growth for last 12 months: 30.1%, $75.2B
Net Flows
- Net flows for the Half Year: $21.6B
New Products
- 427 Exchange Traded Products trading on the ASX & CBOE
- New/closed products: 36 new products launched in the half year, 10 products closed.
- 3 new issuers joined the market
- There are currently 59 issuers of ETFs in Australia
Trading Value
- Trading value for this half was 58% higher than the first half of 2024
Performance
- In recognition of the unique circumstances facing markets, Defence and Gold Miner ETFs were the top performers over the half.
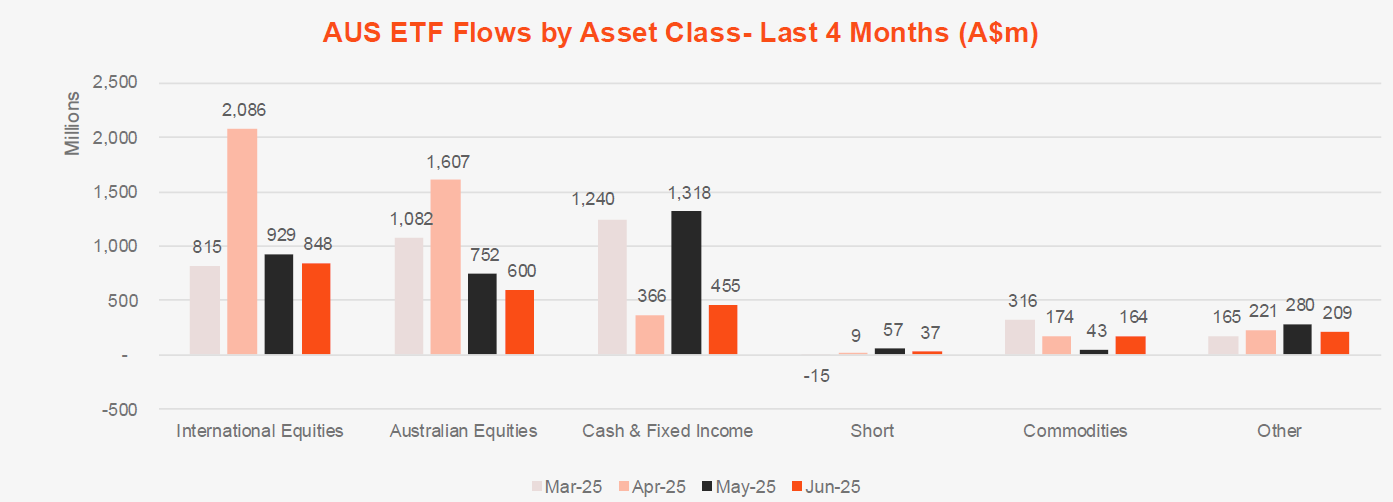
Industry Net Flows
Top Category Inflows (by $) – Month
| Broad Category | Inflow Value |
|---|---|
| International Equities | $847,916,395 |
| Fixed Income | $768,568,002 |
| Australian Equities | $600,075,026 |
| Commodities | $164,432,769 |
| Multi-Asset | $85,643,655 |
Top Sub-Category Inflows (by $) – Month
| Sub-Category | Inflow Value |
|---|---|
| Australian Bonds | $621,595,983 |
| Australian Equities – Broad | $448,732,376 |
| International Equities – Developed World | $400,350,448 |
| International Equities – Sector | $265,569,737 |
| Global Bonds | $223,054,776 |
Top Category Outflows (by $) – Month
| Broad Category | Inflow Value |
|---|---|
| Cash | -$313,138,692 |
Top Sub-Category Outflows (by $) – Month
| Sub-Category | Inflow Value |
|---|---|
| Cash | -$313,138,692 |
| Fixed Income – E&R – ESG Lite | -$60,946,557 |
| International Equities – Europe | -$60,282,468 |
| International Equities – E&R – Ethical | -$34,260,418 |
| Australian Equities – Large Cap | -$16,216,789 |
Performance
Top Performing Products – Month
| Ticker | Product Name | Performance (%) |
|---|---|---|
| ETPMPT | Global X Physical Platinum | 23.73% |
| ATOM | Global X Uranium ETF | 18.78% |
| URNM | Betashares Global Uranium ETF | 16.02% |
| IKO | iShares MSCI South Korea Capped Index ETF | 15.79% |
| ETPMPD | Global X Physical Palladium | 15.47% |