



This information is for the use of licensed financial advisers and other wholesale clients only.
Key points
Last quarter we discussed where AI’s returns are currently accruing and who the ultimate winner in the ecosystem might be, unpacked the Australian market’s woes, and weighed in on the ongoing geopolitical impact from the Iran conflict.
In Q3 robust corporate earnings allowed for a continuation of the global market rally despite the ongoing conflict in Iran and climbing bond yields. In this quarterly we look to analyse how higher bond yields are impacting equity market valuations, unpack the earnings growth discrepancy between Australia and the rest of the world, and size the AI IPO wave against historical raises.
3 Things we learned
Rising bond yields are having mixed effects on equity risk premiums
A combination of inflationary shocks, synchronised central bank hikes and a booming US economy has driven bond yields higher across the globe. The US 10-year Treasury yield currently sits around 5.30% pa, a level not seen since before the GFC, and the Australian 10-year government bond yield has followed it through the 5% mark.
Global equity markets have performed strongly over the past year, but that run has been tempered recently by the blowout in bond yields. That should not come as a surprise. Bond yields set the discount rate investors apply to future company earnings, so when yields rise the present value of those earnings falls and investors will pay less for each dollar of profit. Higher yields also lift the return on offer from ‘risk-free’ government bonds, raising the bar shares need to clear, while higher borrowing costs weigh on company margins and household spending.
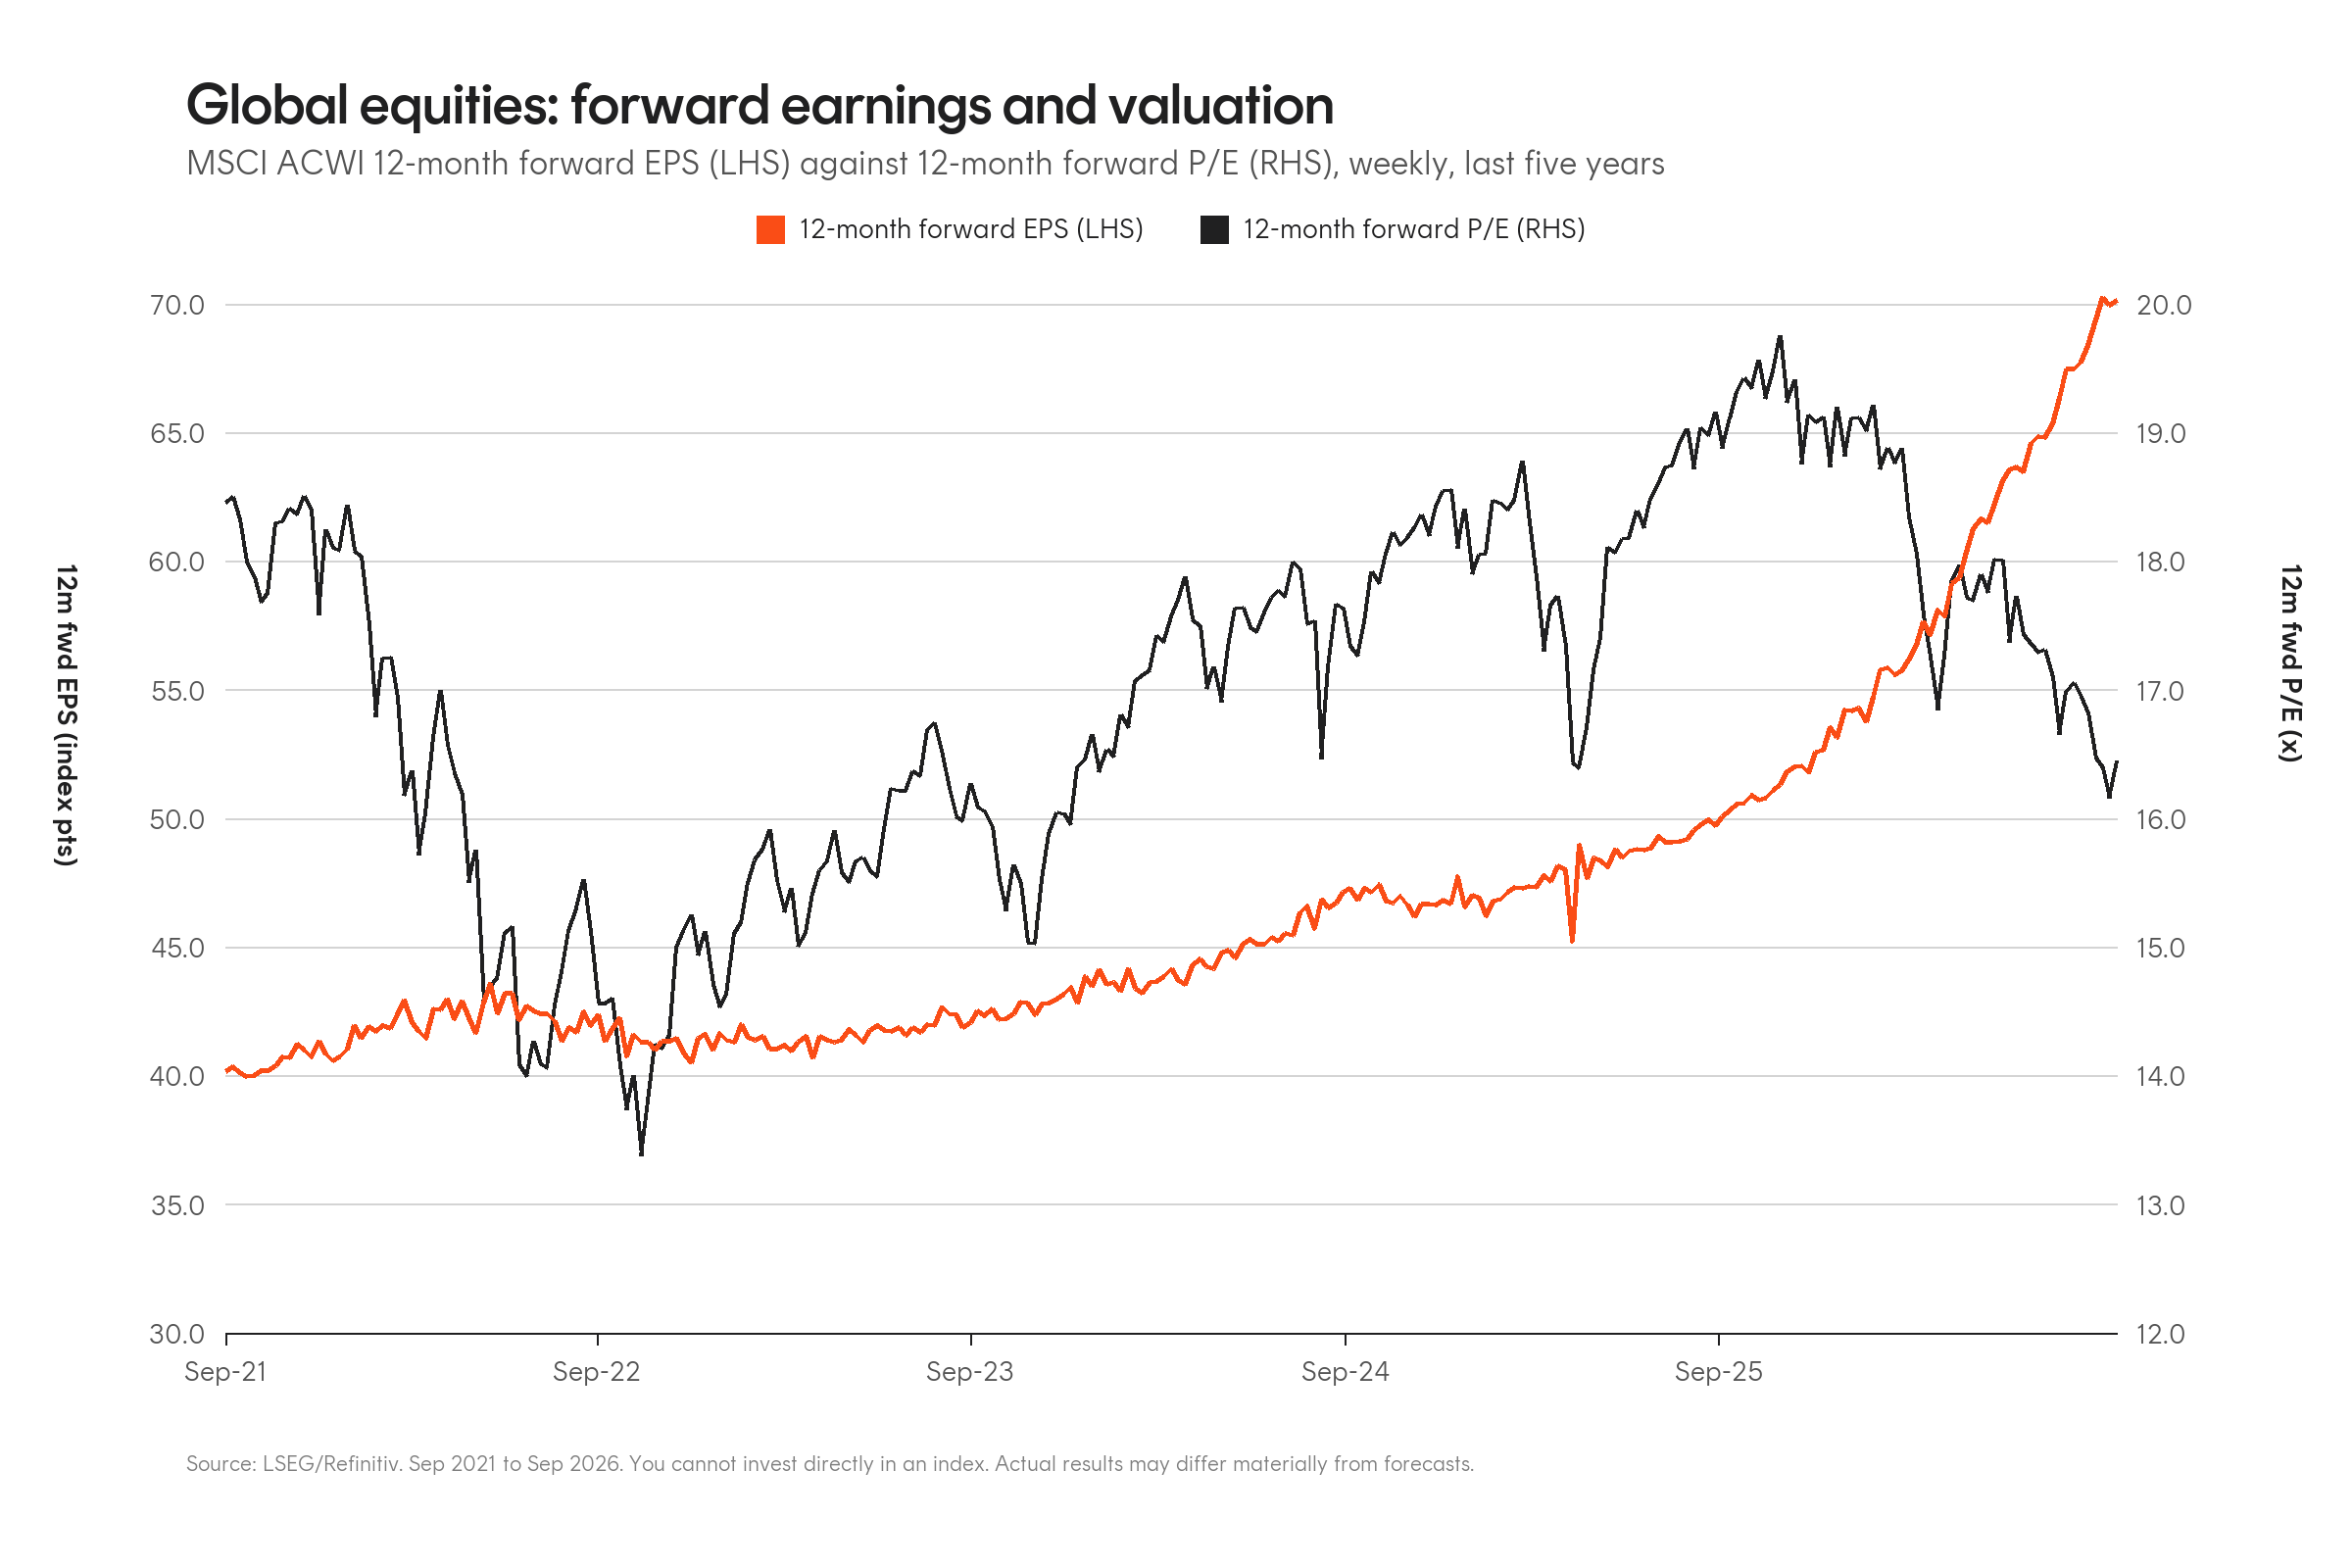
The good news for global equities is that earnings growth at an aggregate level has been strong enough to outrun index returns. Forward earnings for the MSCI ACWI have risen by around a third over the past year, close to double the index’s 17.2% return. As a result, the forward price-to-earnings (P/E) ratio of the MSCI ACWI has compressed. On that measure, global equities are 16% cheaper than they were a year ago and look better value than at nearly any time in the last three years.
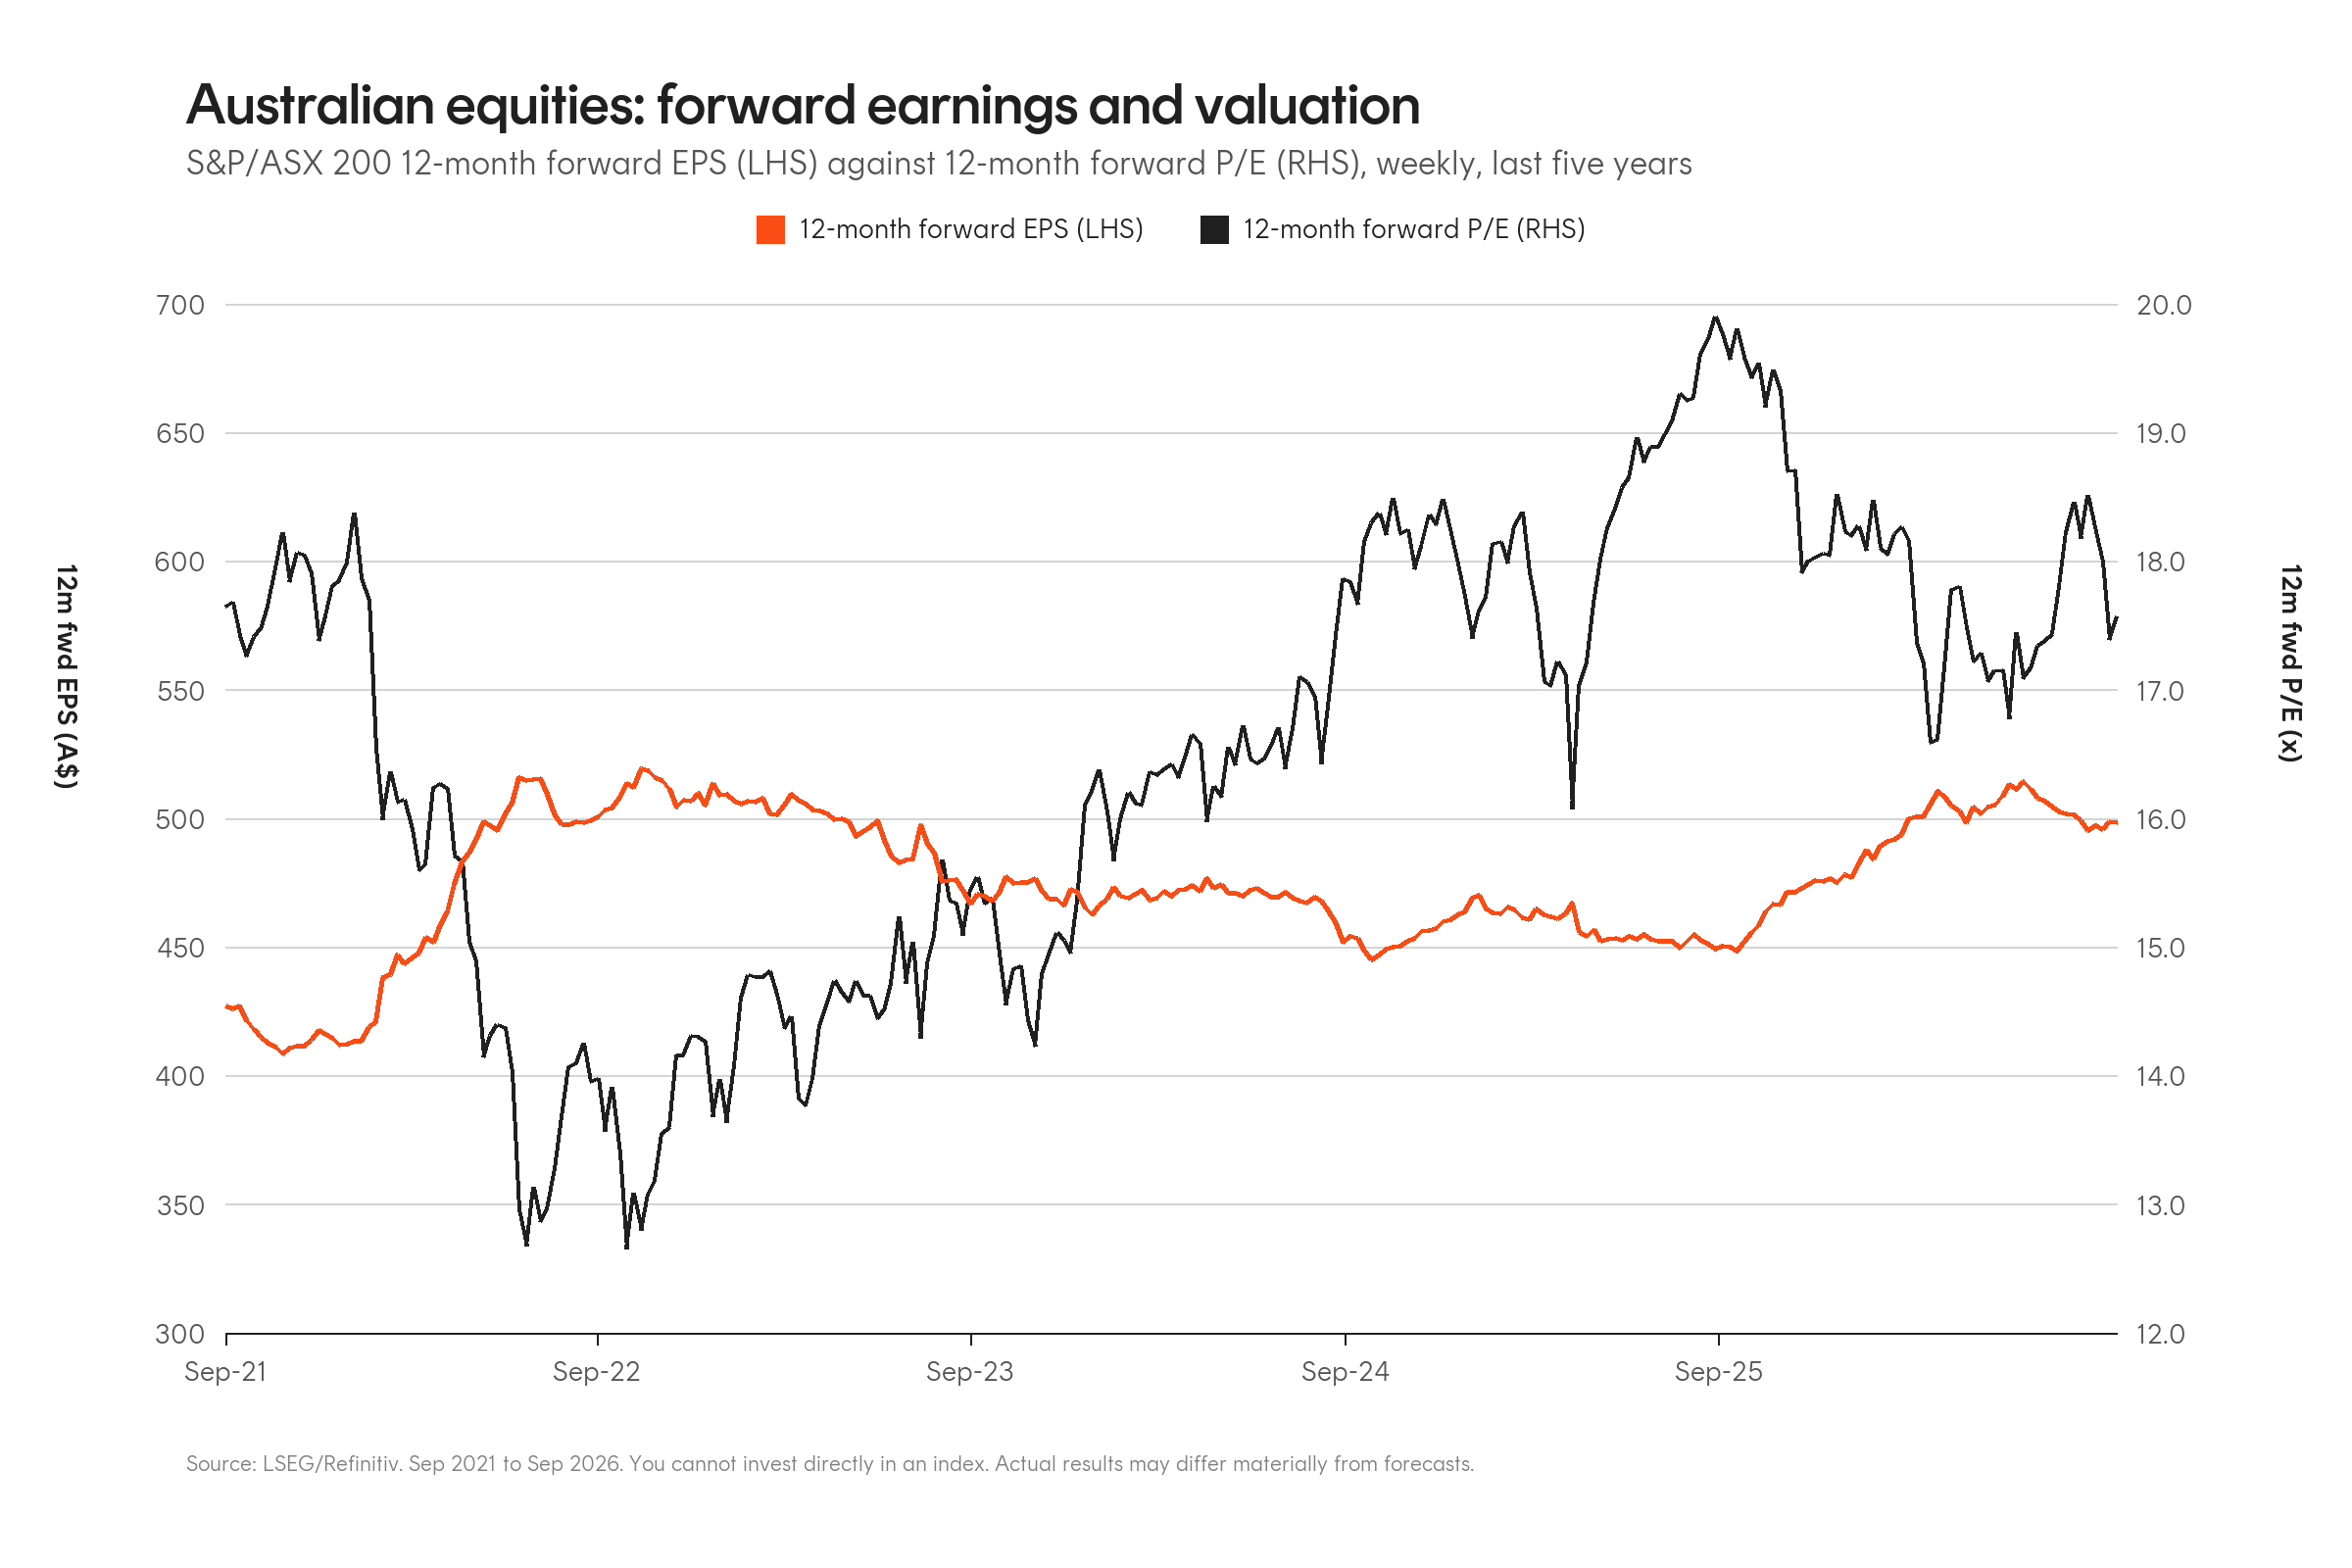
The chart below for Australia tells a very different story. Earnings growth has been far less consistent over the last five years, and since 30 June forward earnings have been downgraded as analysts bake in headwinds from higher rates and the housing market. Yet the S&P/ASX 200 trades on a higher forward P/E than the MSCI ACWI, around 17.4x versus 16.2x, despite weaker expected earnings growth. Australian investors are paying more for less.
As bond yields ratcheted higher through August and September, the S&P/ASX 200 fell, but not by enough to close its valuation premium to global equities. It’s hard to justify this premium while Australian earnings are being cut. Lagging returns have not yet bought the Australian market a margin of safety.
Global earnings broadening
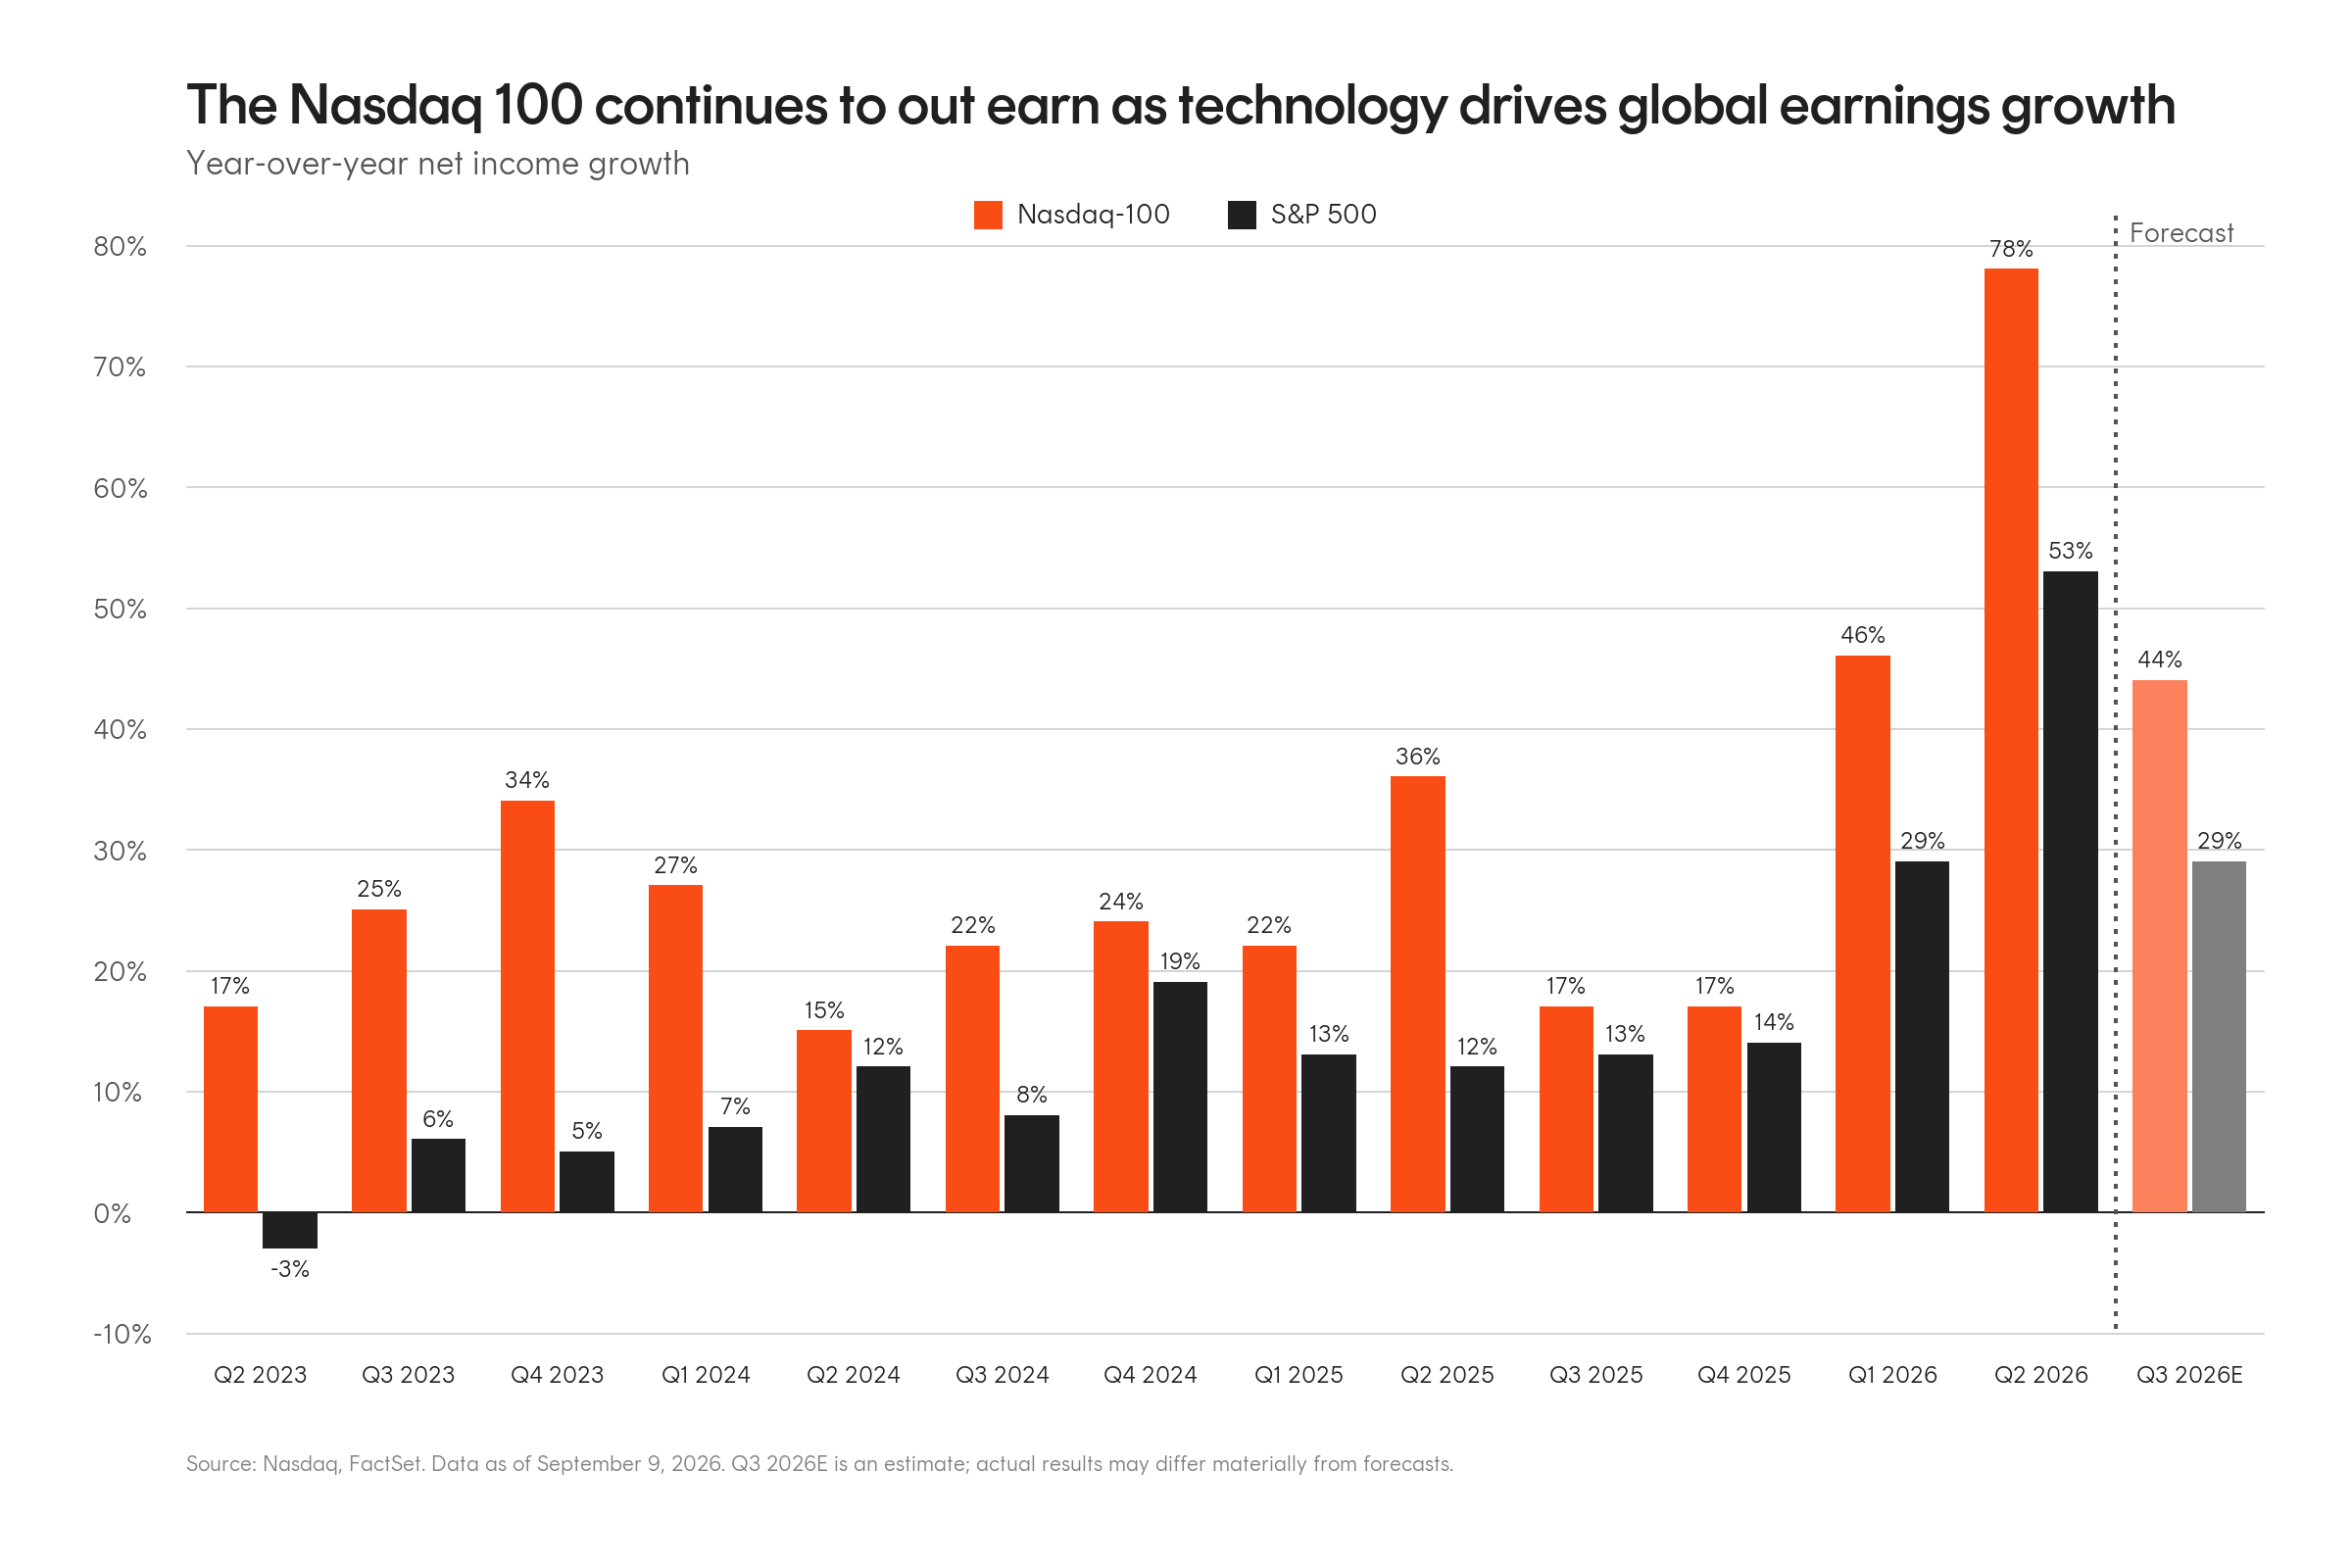
Strong global earnings growth continues to be driven by the artificial intelligence (AI) ecosystem. The Nasdaq 100 posted 78% earnings growth for Q2 2026 led by the IT sector’s remarkable gains.
The three large hyperscalers’ cloud businesses, AWS, Google Cloud and Azure, grew revenues by a massive US$32bn with combined margins widening by five percentage points. That paves a clearer path to a return on their massive capital expenditure.
Alphabet and Amazon, which sit outside the IT sector in communication services and consumer discretionary, also reported strong earnings growth alongside massive surprises from unrealised gains on equity securities. These are largely unrealised gains on stakes in SpaceX (Alphabet) and Anthropic (Amazon).
Alphabet, Amazon and the IT sector together explain around three quarters of the S&P 500’s Q2 earnings growth with significant flow through to global earnings strength.
Further up the AI chain, Anthropic’s IPO is expected as soon as November and would give investors a look under the hood at the profitability of enterprise AI model providers. Its annualised revenue run rate is reportedly on track to top US$100bn this year1, more than 10 times its level at the end of 2025.
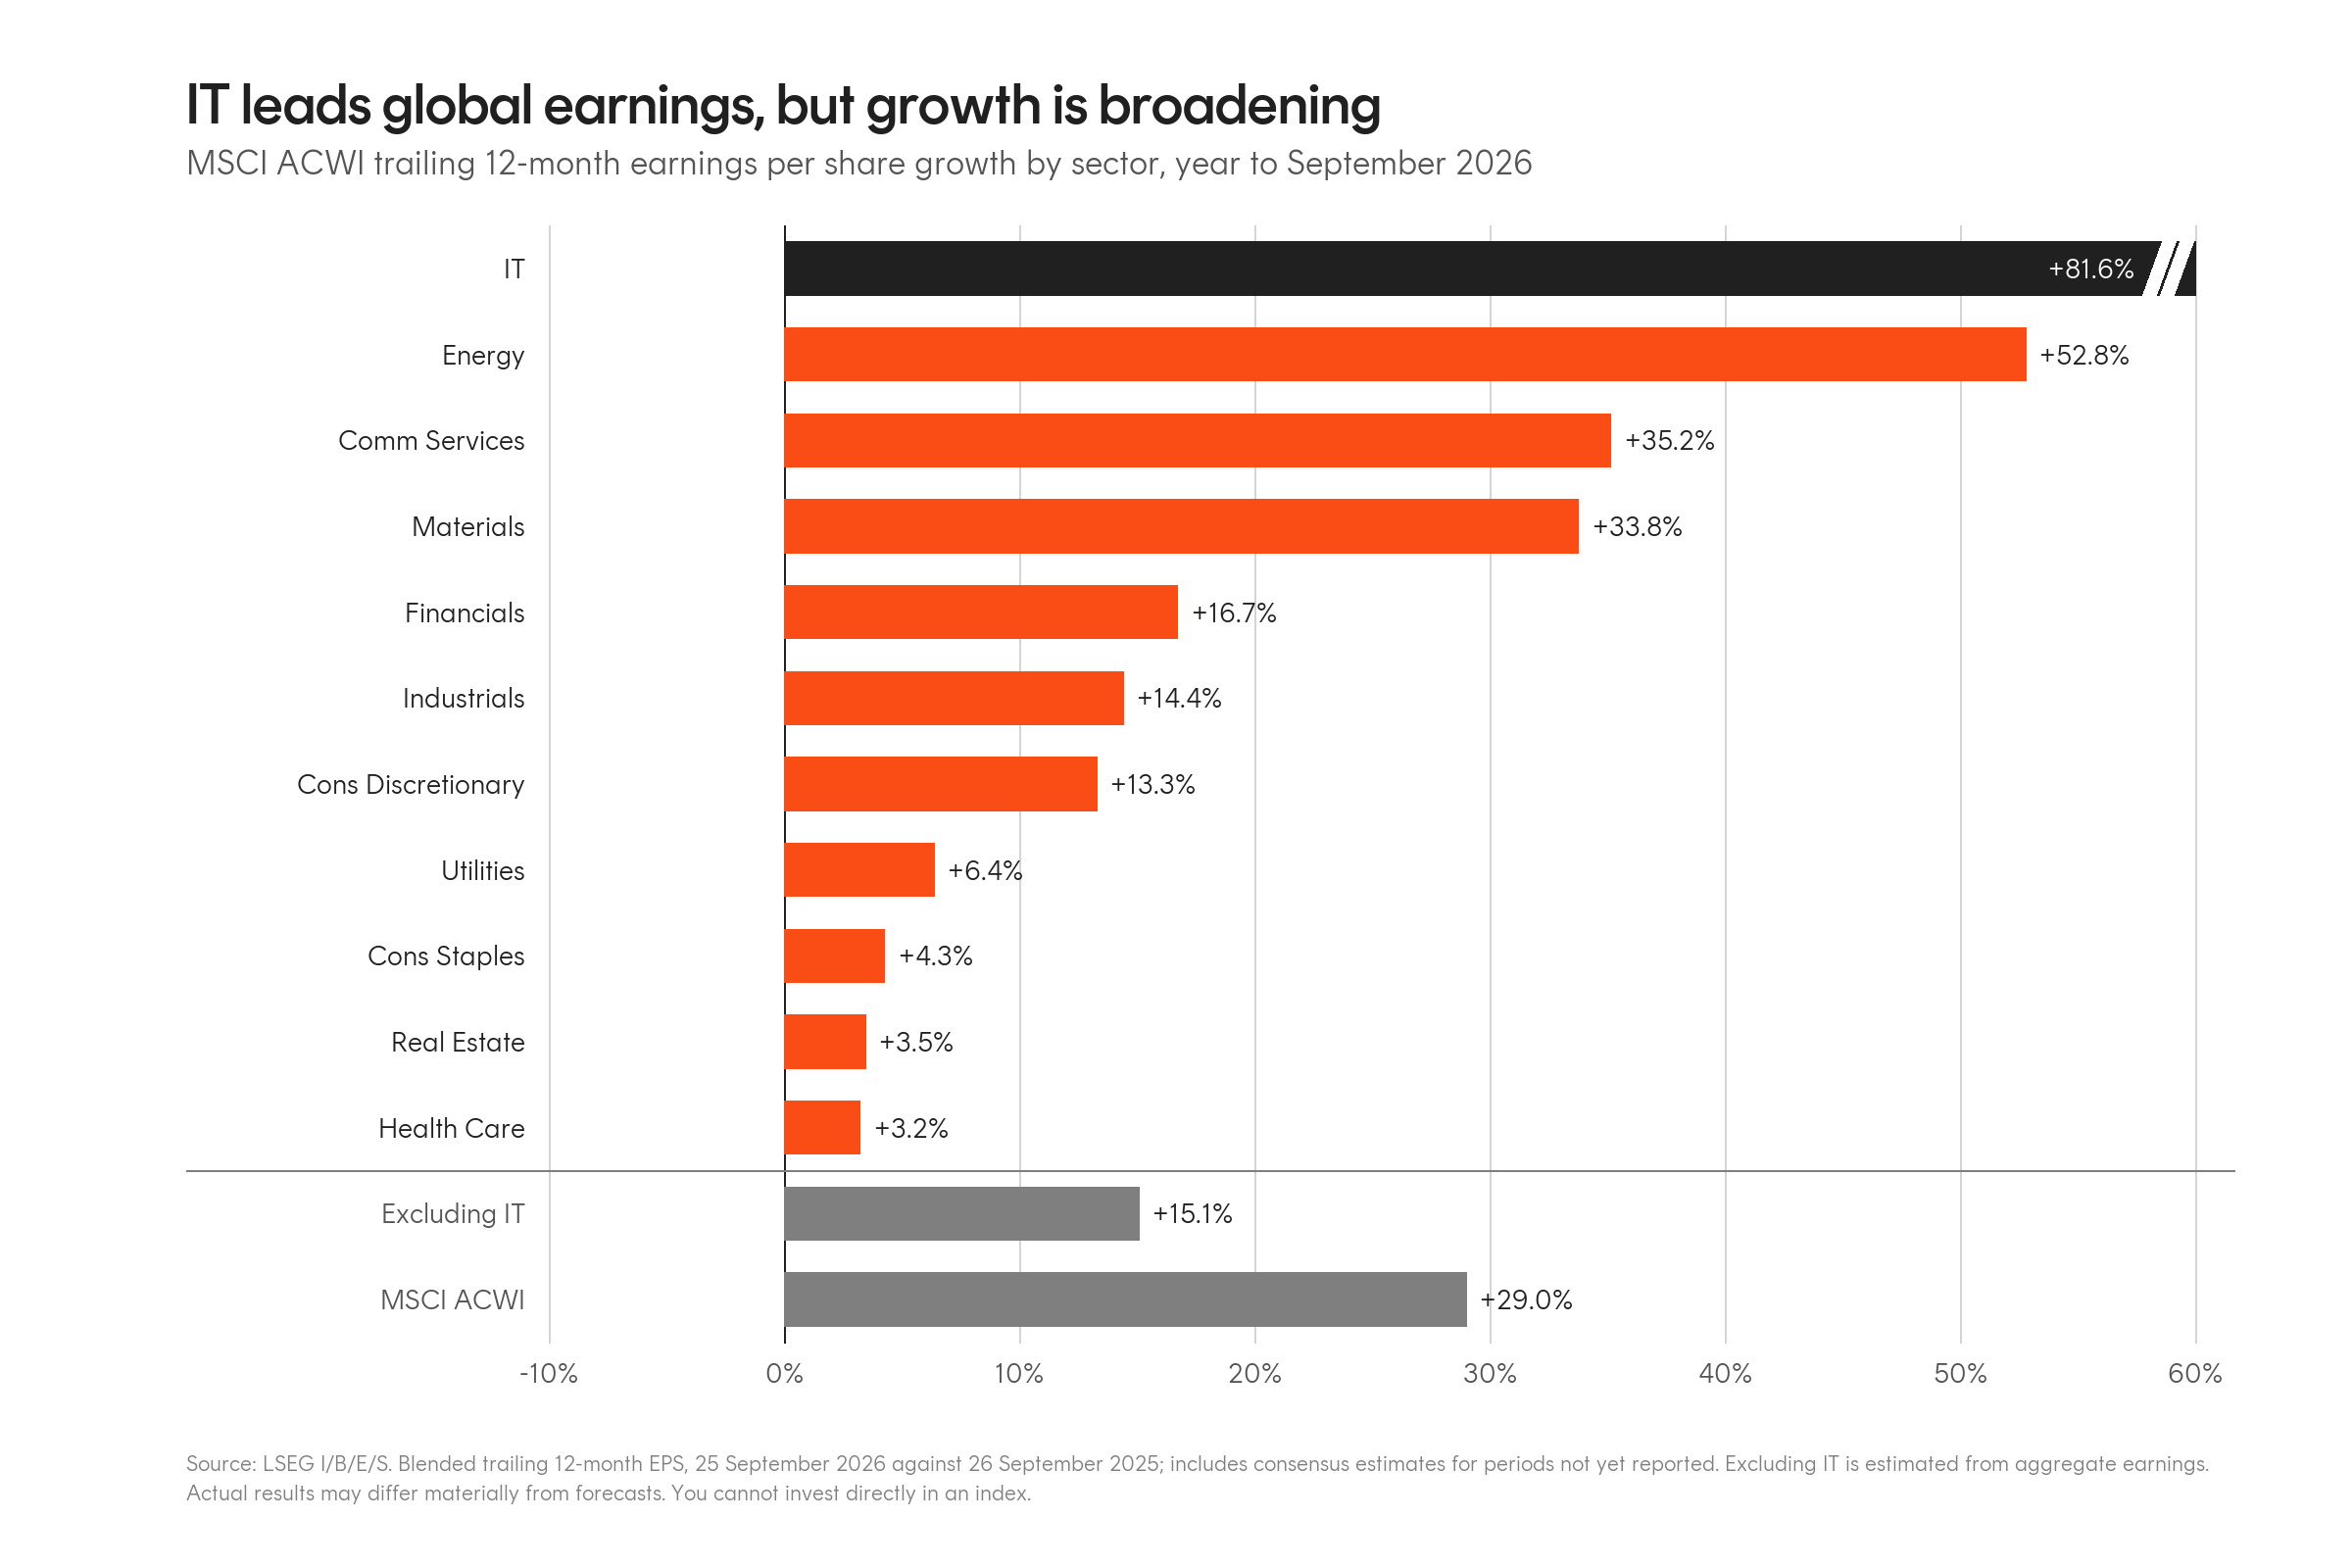
Arguably even more promising than US tech’s super earnings is the breadth of earnings beyond the sector. Within the US, ten of eleven sectors reported positive earnings growth in Q2, eight of them in double digits, with only health care reporting a decline. The highest share of companies beat Q2 earnings estimates since 2021, with the median stock reporting mid-teens earnings growth.
This is not just a US story. European earnings grew about 20% in Q2, one of the strongest rates in years. Energy led, with earnings more than doubling on higher oil prices, and banks contributed a large share of the positive surprises as higher rates lifted lending margins. Both oil and yields could become a risk if they stay too high for too long. More sustainable drivers, renewed industrial, defence, data centre and green energy capex cycles, are underway and could support growth into the future.
Japanese financials echo Europe. The three Japanese megabanks, Mitsubishi, Sumitomo and Mizuho, are expected to grow earnings 13–16% over the next 12 months as lending margins widen on the back of BoJ hikes.
US AI spending is also flowing through to Japanese IT, where earnings are expected to grow around 55%, led by flash memory maker Kioxia and chip equipment companies Tokyo Electron and Advantest. The same AI hardware cycle drives emerging markets, where forward earnings have nearly doubled in a year.
The AI ecosystem remains the centrepiece of the global equity bull case. However, a broadening of earnings within and beyond the US could provide a more sustainable backdrop for equity markets to keep grinding higher for the rest of 2026 and into the new year.
Why Australia’s market is lagging the rest of the world
It is not news that Australia’s market is lagging global earnings and price growth, partly due to low exposure to the AI ecosystem. The 11 companies that make up the information technology (IT) sector in the ASX 200 account for under 2% of the index’s weight.
The now failed IPO of Australian neocloud Firmus is a dissapointing development in what could have been a a step towards larger AI companies on the ASX, potentially reshaping the broader index over time. Firmus is likely to become another example of an Australian technology company seeking capital from, or listing in, overseas markets, like Atlassian, Sharon AI and Iris Energy before it.
However, an underweight to large AI companies is not the only reason Australia’s market is lagging. The chart below shows the earnings growth expectations of select broad global and regional indices, highlighting specific sectors within those markets. The size of the dots represents the weight of that sector in the respective market.
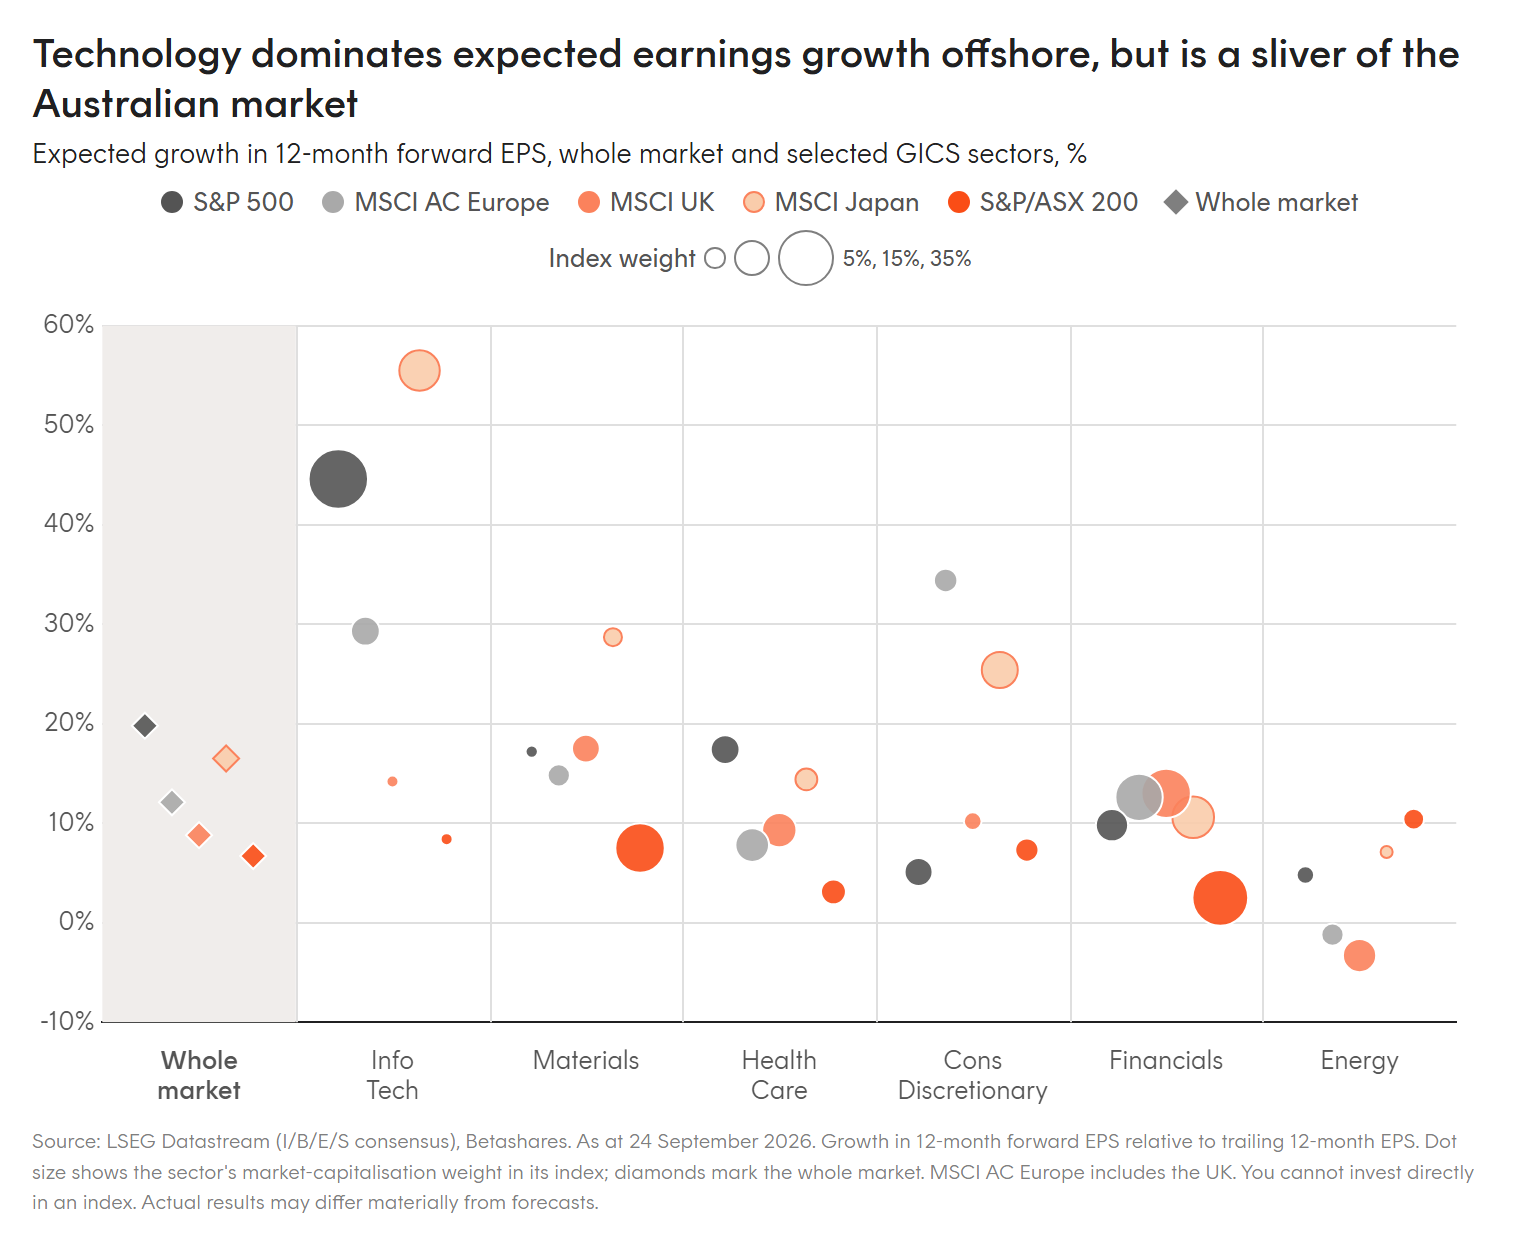
More tellingly, Australia’s two largest sectors, materials and financials, materially lag the earnings expectations of their global peers.
In materials, Australian earnings are expected to grow at half the rate of global peers over the next 12 months. Much of that gap comes down to BHP, the sector’s largest weight. BHP faces lower copper output as ore grades decline at its Escondida mine, while a softer expected iron ore price, which is currently around five-year lows, weighs on what is still a significant earner for the company, and on Fortescue. Strip out BHP and the iron ore miners and Australian materials earnings are expected to grow close to 20%2. Gold, copper, lithium and rare earth producers are keeping pace with, or running ahead of, their global peers.
Financials tell a similar story. Australian banks are expected to grow earnings by less than half compared to global banks. Offshore, banks in Japan and Europe are still benefiting from the move away from ultra-low rates, as loans reprice faster than deposits, while a revival in capital markets activity is boosting fees. By contrast Australia’s Big 4 are mature lenders, competing hard for both mortgages and deposits in a softening housing market without the same diversification in capital markets as international peers. Outside the Big 4, insurers, select wealth managers and platforms have better earnings prospects.
These figures outline why Australia’s equity market is challenged at the headline index level skewed by a small number of mature large caps, while also highlighting opportunities that still exist beneath the surface. Over the quarter Australian small cap, momentum, quality, and value factor indices each outperformed the broader market by over 2%.
2 Charts we’re watching
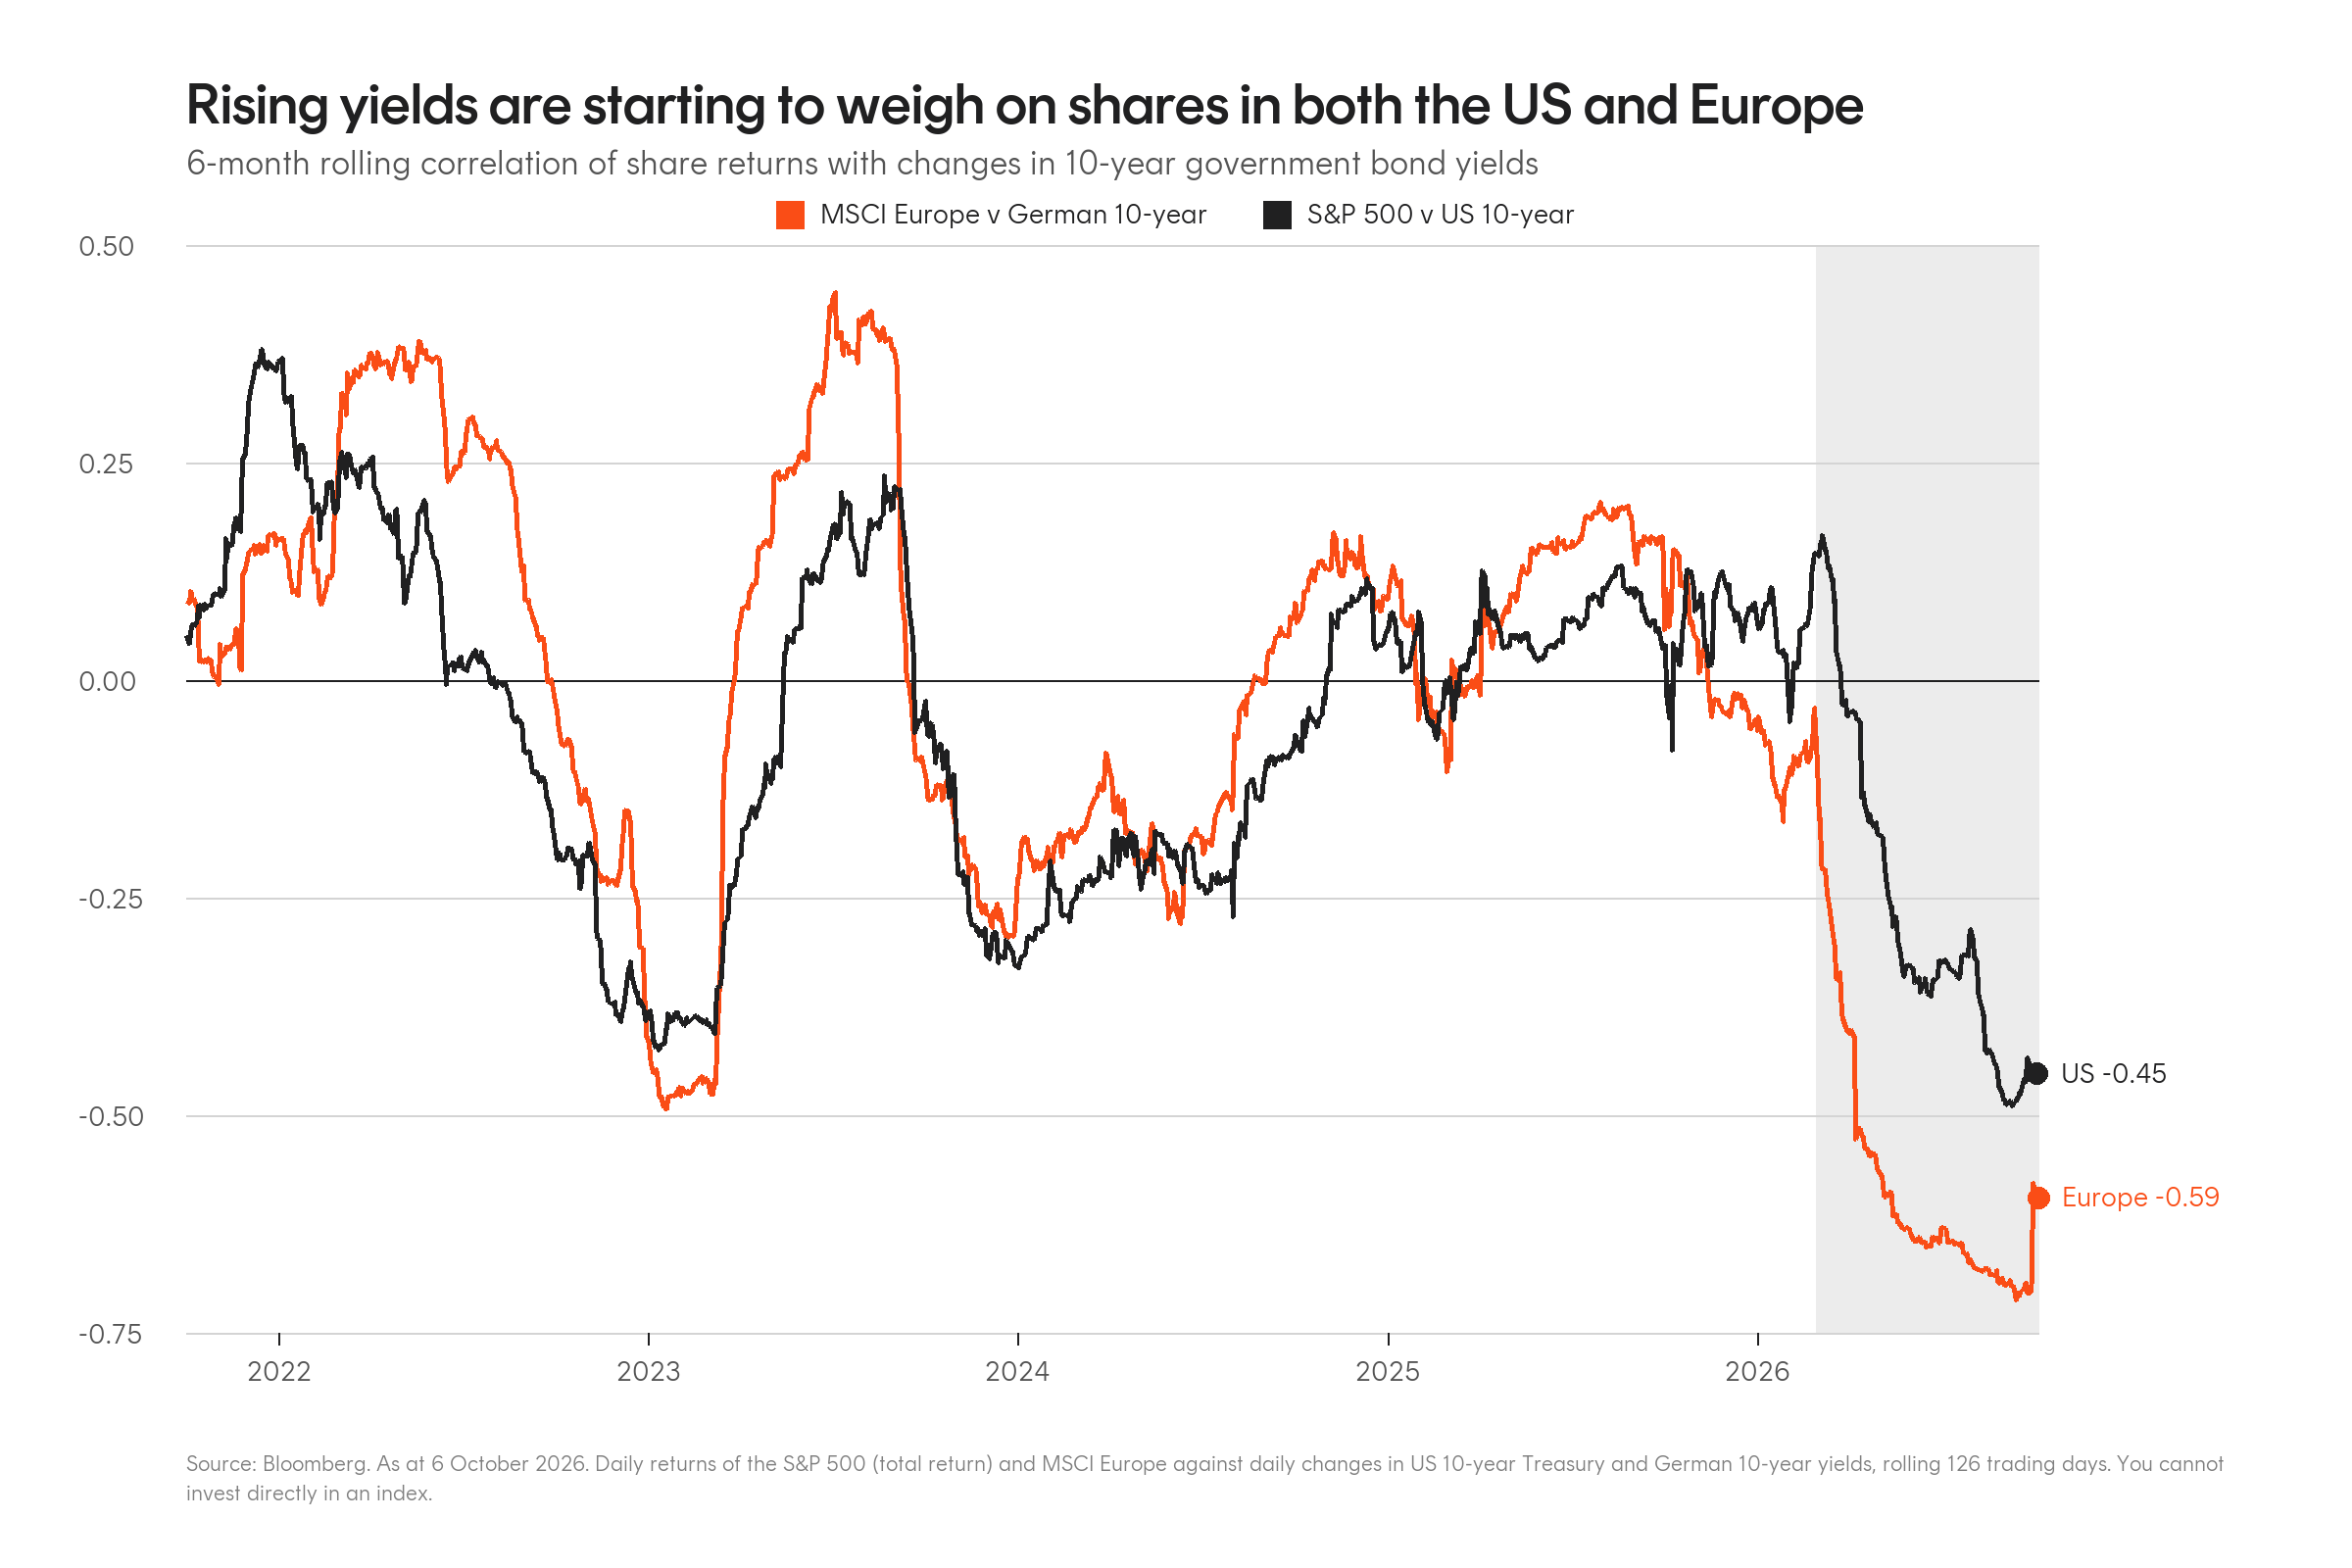
Equity markets have held up despite the surge in bond yields, with global shares rising around 2% over the quarter, supported by robust earnings growth. Despite this the correlation between share returns and bond yields has turned sharply negative in both the US and Europe, from around zero last year to −0.45 and −0.59 respectively, the weakest readings in at least five years. Higher risk-free rates raise the bar for shares, both by lifting the return on offer from bonds and by lowering the value of future earnings. Markets can still climb through higher yields, but only if earnings keep delivering.
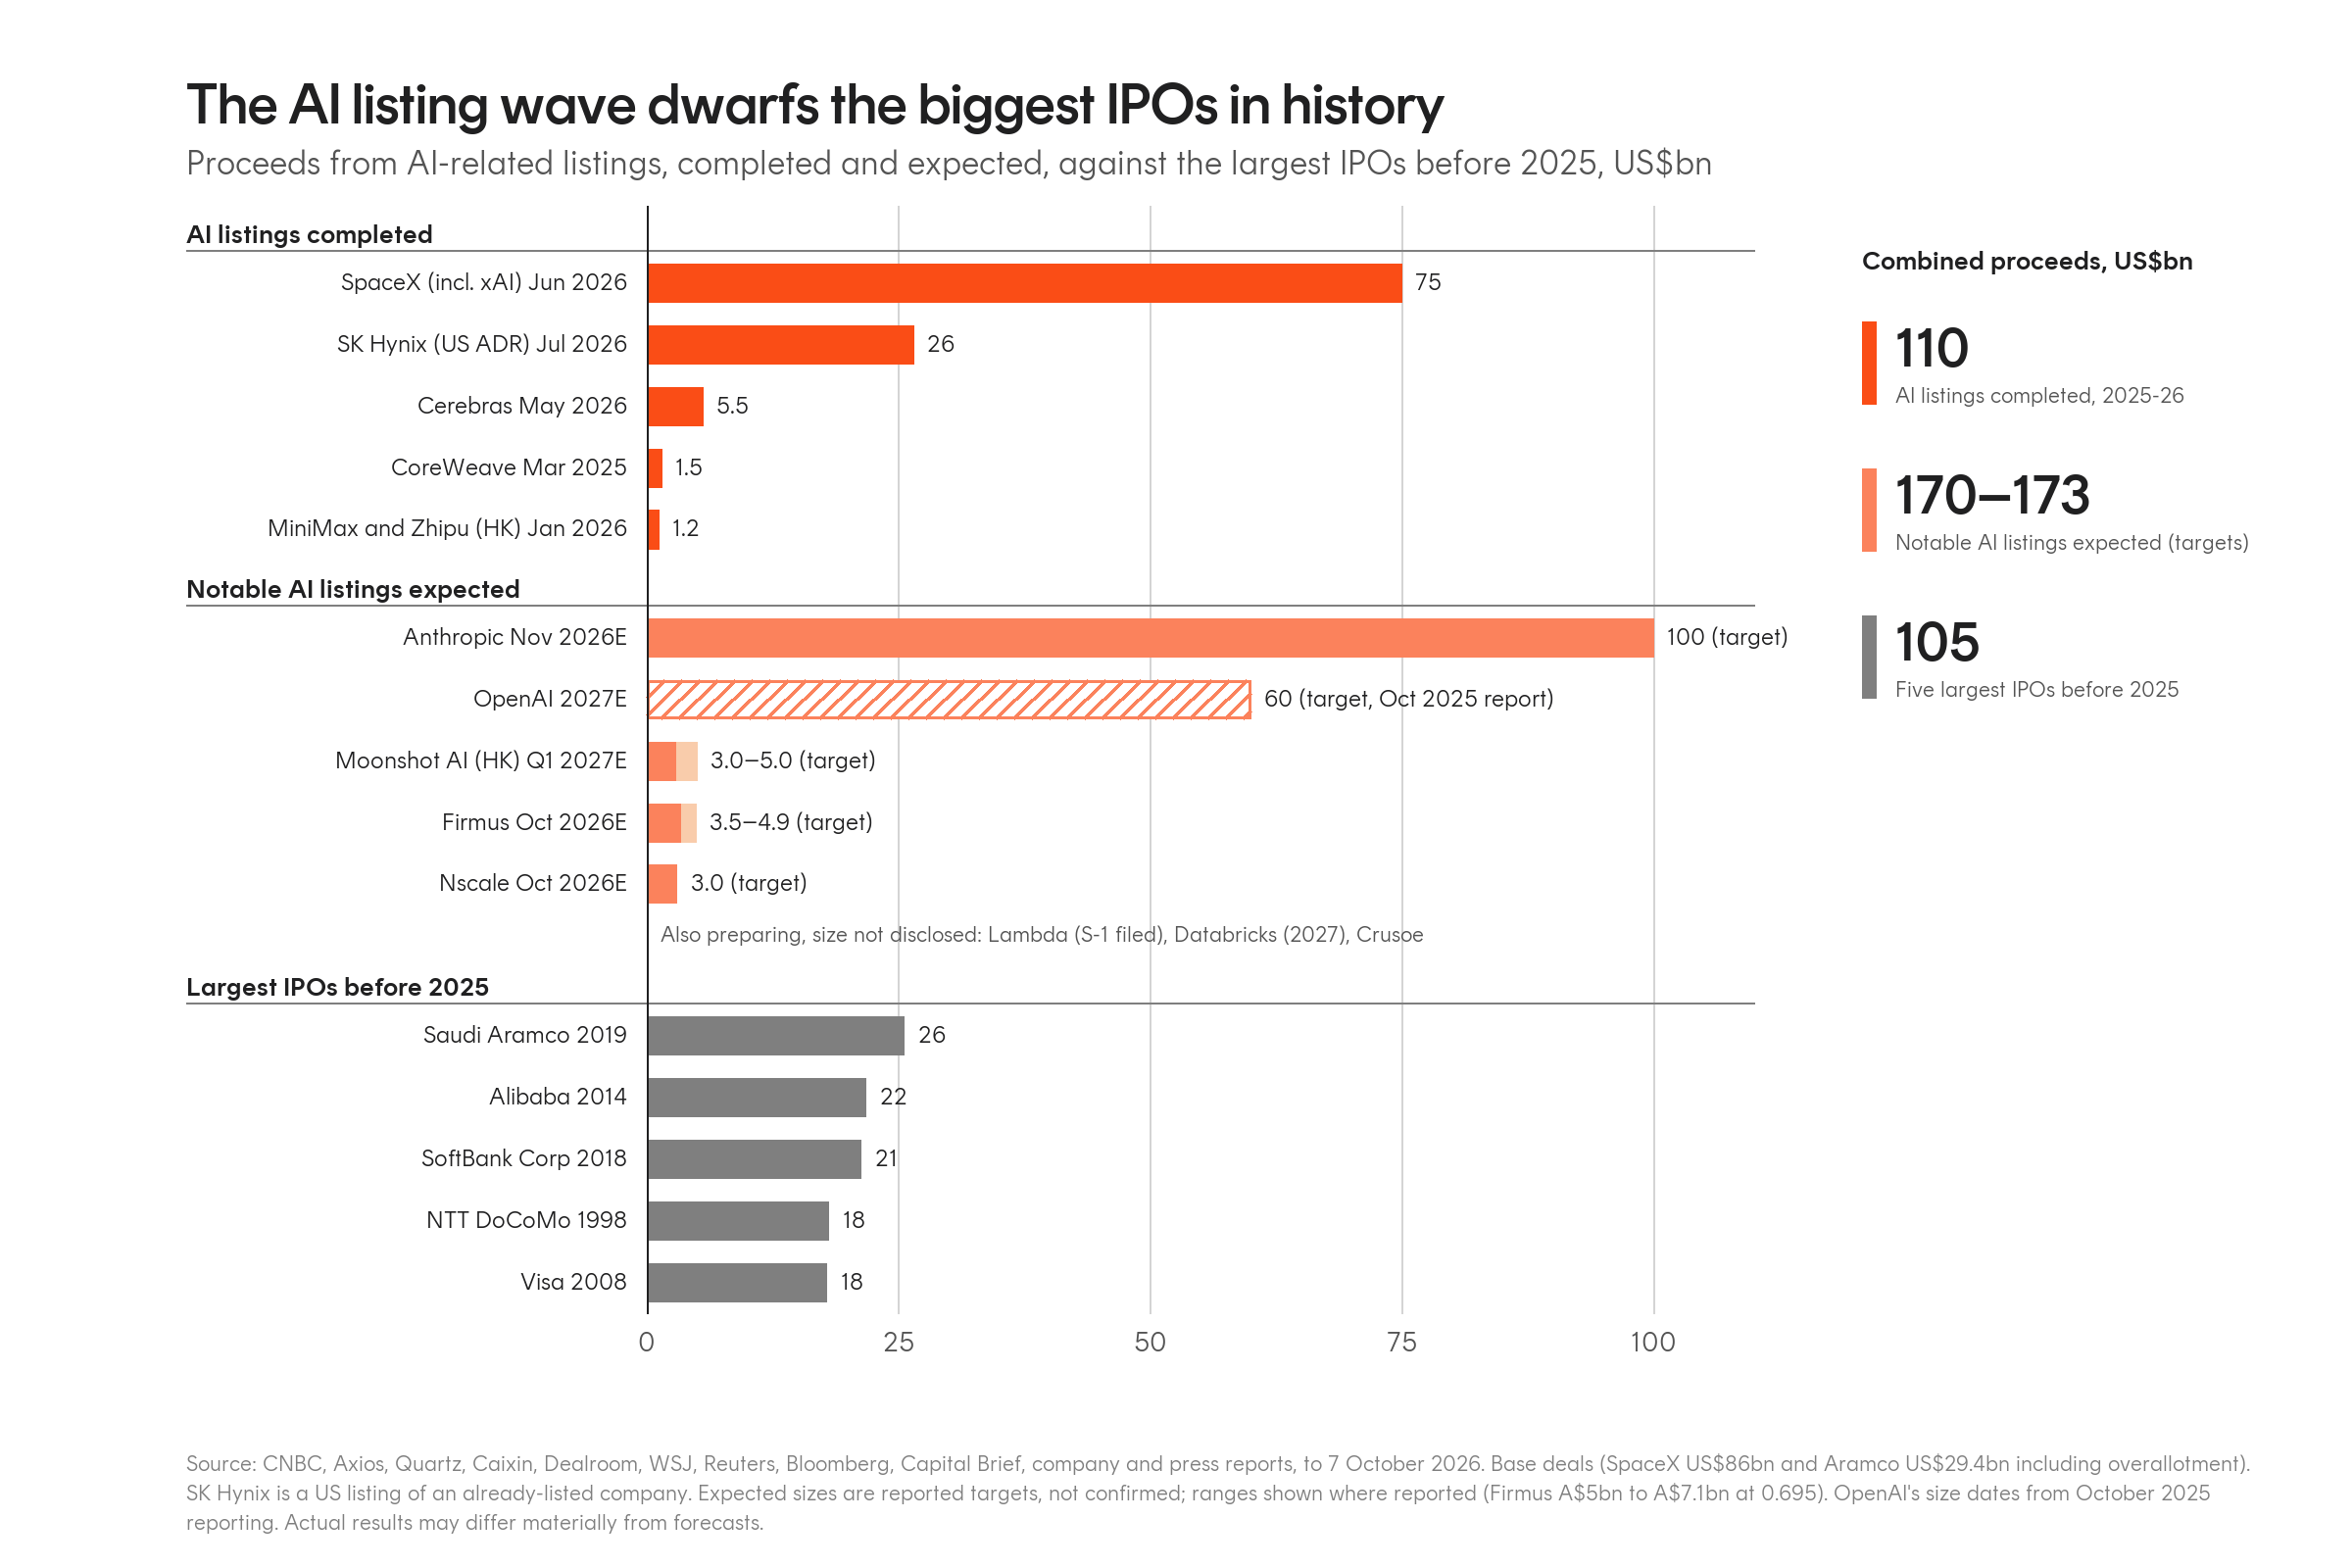
Locally the now failed IPO of Firmus was set to be one of the largest in Australia’s history, behind only Telstra in 1997. SpaceX’s US$75bn debut in June was the biggest IPO ever, and SK Hynix’s US$26.5bn US listing was the largest share sale by a foreign company in the US.
AI-related listings and share sales since 2025 have already raised more than the five largest IPOs before them combined, with around US$170bn more expected, led by Anthropic in November and OpenAI early next year. However, the recent experience of Firmus’ IPO raises a healthy challenges to this potential wave continuing. Upcoming appetite for Anthropic’s potential listing signifies a bigger market test.
While there have been periods of higher IPO activity, such as in 2021, the current wave is unique in how concentrated the raises are in a small number of companies. We are watching investor demand and how markets absorb this supply. These listings draw on investor capital, and their entry into public markets could reshape market indices in the years to come.
1 Question remaining
Can equity markets withstand higher bond yields?
P/E ratios are a useful measure of how fairly priced equity markets are, but everything in investing is relative. In a higher rate environment, we expect lower P/E ratios to persist.
That need not be bad news for shares. The years before the GFC were also a time of higher rates, and the MSCI ACWI forward P/E traded between 13x and 17.2x. Global equities performed well over this period because strong earnings growth more than offset lower multiples. At around 16x, global equities already sit within that range. The caveat is that the pre-GFC earnings boom was fuelled by cheap credit and ended badly. The lesson is not that history will repeat, but that higher yields and solid equity returns can coexist when earnings deliver.
Right now, the earnings outlook for global equities supports a preference for global over Australian shares. Global earnings are growing fast enough to absorb higher yields. Australian earnings are not.
The key risk to that view is a further leg higher in bond yields without earnings growth to match. With the global ERP at around 1%, there is limited room to absorb another rise in yields, so earnings delivery, not valuation, is the thing to watch from here. Much of the growth is concentrated in technology, but even excluding IT, global forward earnings are up around 15% over the past year, and consensus expects MSCI ACWI earnings to grow around 16–17% in 2027. If companies deliver, earnings growth could underwrite share market performance, even with bond yields above 5%.
Equity market dashboard
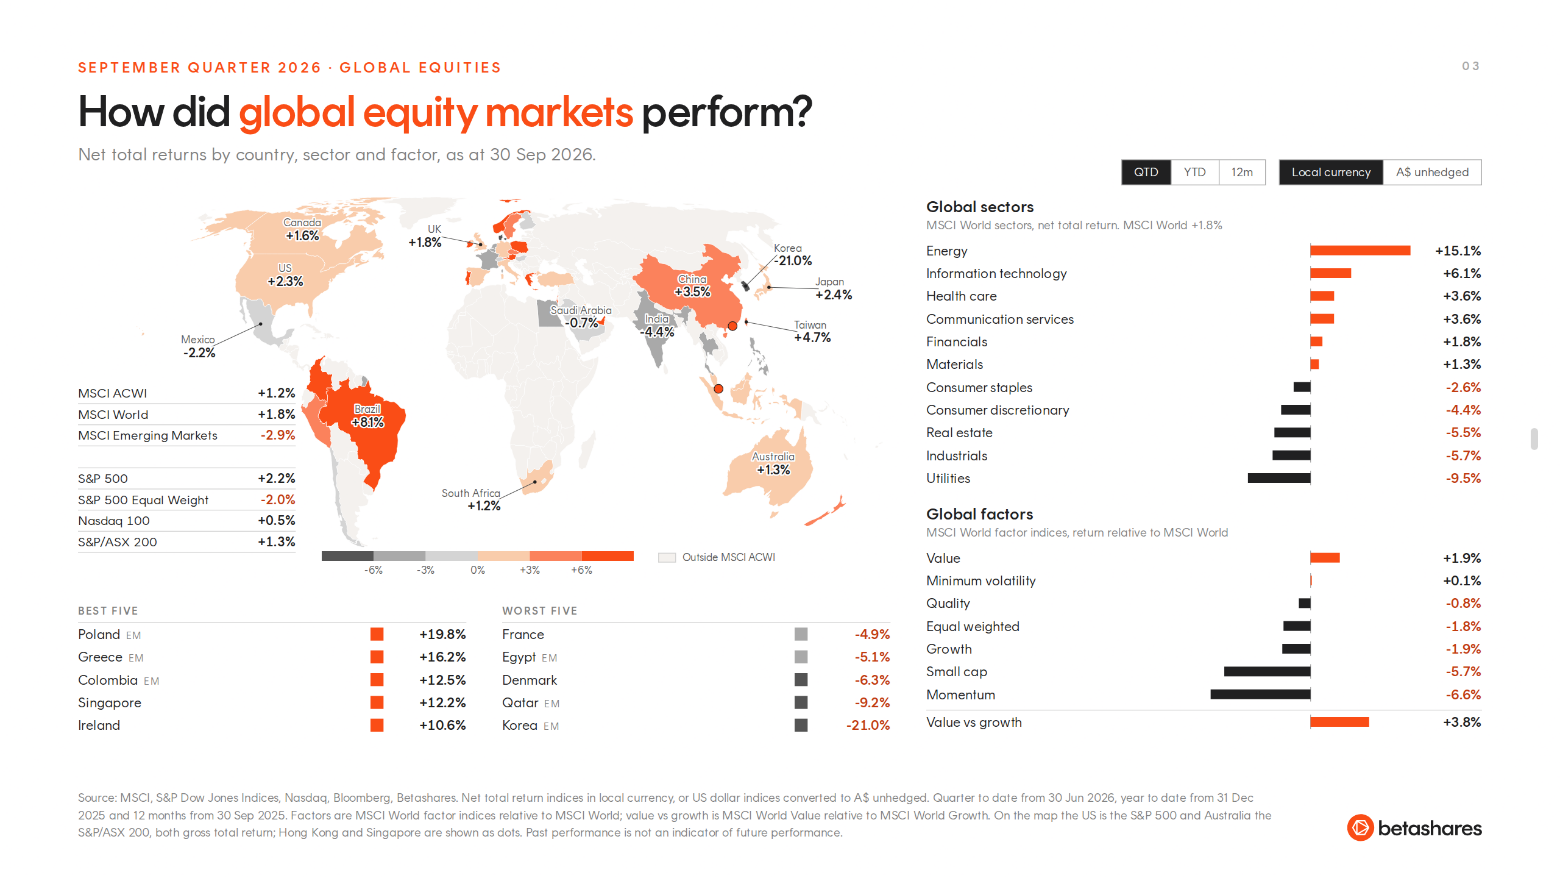
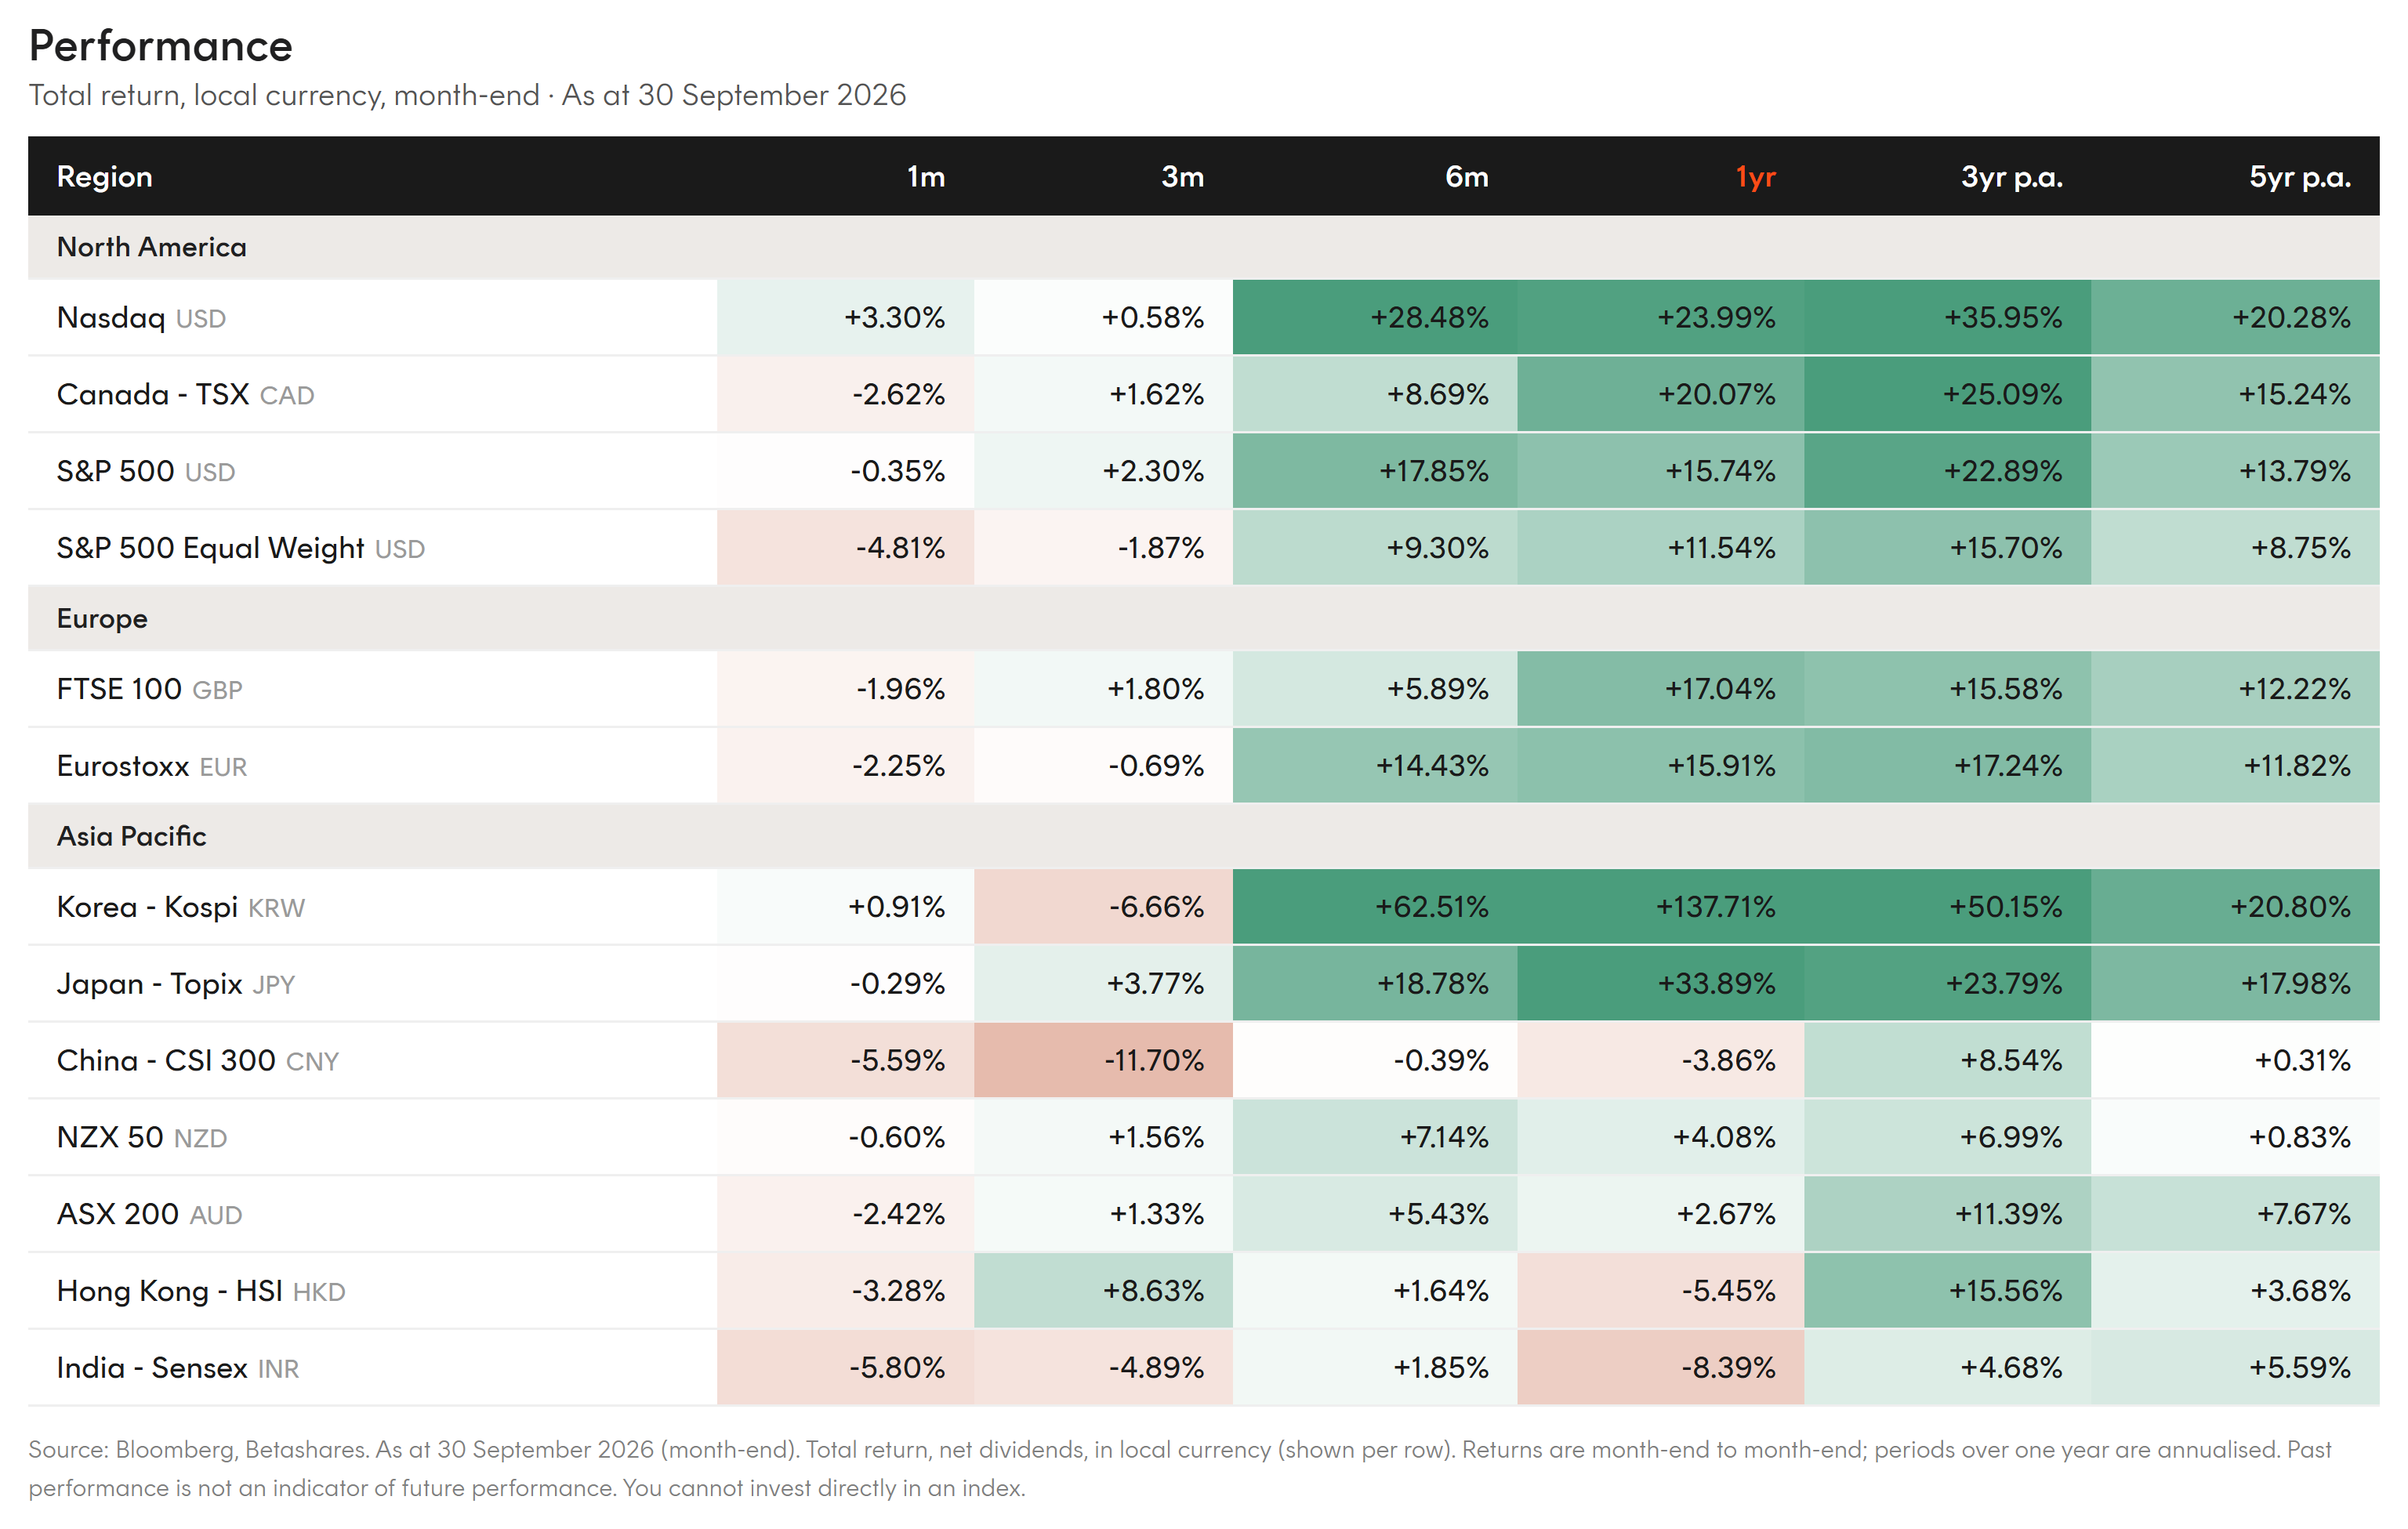
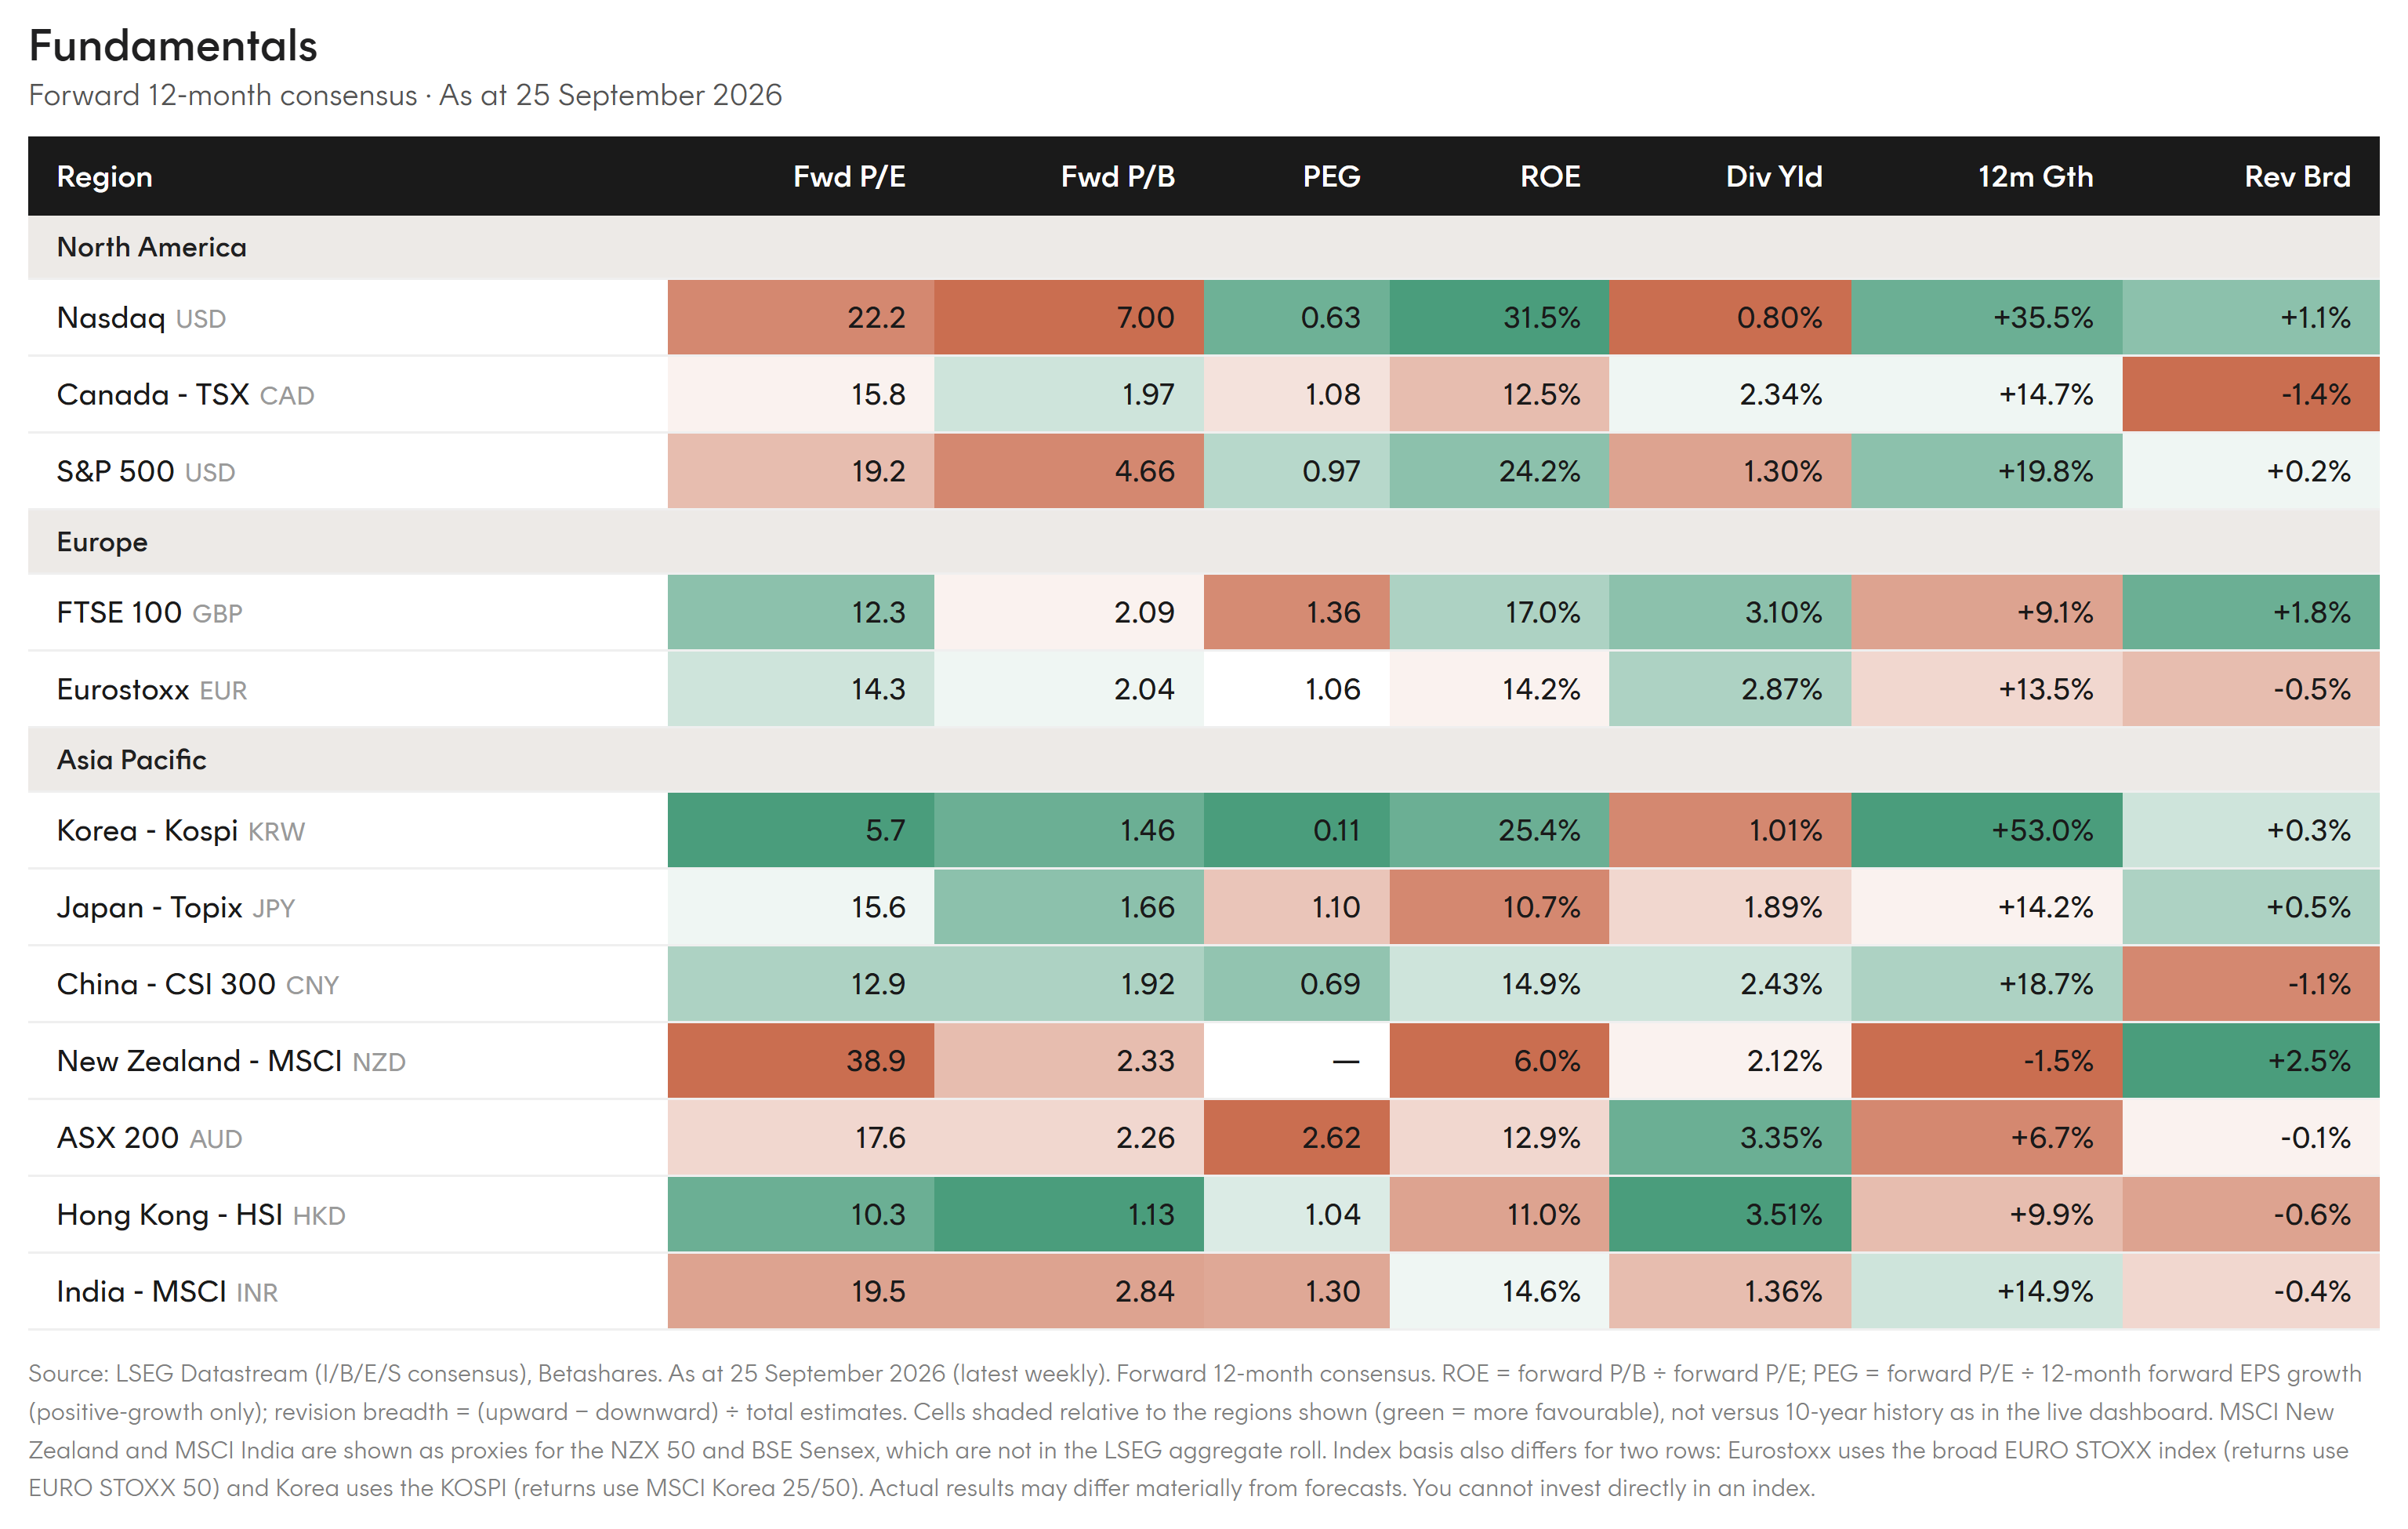
Sources Betashares, LSEG Datastream (I/B/E/S consensus), Bloomberg, FactSet, Nasdaq, company reports (Amazon, Alphabet, Microsoft, BHP) and press reports. Earnings growth and P/E ratios are 12-month forward consensus estimates unless stated. The equity risk premium is the forward earnings yield less the 10-year government bond yield. Consensus data as at 25 September 2026; market data as at 30 September 2026 unless otherwise stated.
