
Cameron Gleeson
11 minutes reading time
This information is for the use of financial advisers and other wholesale clients only. It must not be distributed to retail clients.
Key takeaways:
- Most approaches to outperforming the market miss the mark – here’s a better framework
- Asking which investment factor is going to outperform is the wrong question
- The last 12 months of returns in Australian equities provide an interesting case study
Market sentiment has been whipsawed by hostilities in the Middle East and an erratic ASX earnings season, leaving many investors questioning their edge in portfolio construction. In an environment where conviction is hard to come by, the case for outsourcing that function to a professionally managed, rules-based solution has rarely been stronger.
Betashares Dynamic Managed Accounts are cost-effective, diversified portfolios developed to suit a range of investment goals and risk profiles. Each portfolio is constructed using a range of low cost, transparent ETFs and employs dynamic ‘asset class tilting’ that seeks to provide enhanced risk-adjusted returns over time. This results in institutional-quality portfolios that are cost-effective, transparent and intuitive for even those outside the financial industry.
We have seen significant investor uptake of our Managed Account solution, but an understanding of our portfolio construction approach can also be instructive for those that wish to continue to manage their own portfolios.
How we seek to optimise portfolio outcomes
The Betashares Investment Committee is responsible for the portfolio construction and investment implementation of our Dynamic Managed Accounts. The six member committee brings a deep understanding of the asset classes and asset allocation, expertise in exchange traded products and an understanding of the distinct needs of the Australian investors.
Strategic asset allocation forms the foundation of these portfolios is the core driver of returns, while dynamic adjustments reflect our conviction that markets can temporarily deviate from fundamentals.
Some of our dynamic tilts have been significant contributors to performance, however we view the way we implement portfolios and our approach to ETF selection as equally, if not more, important. We believe financial markets are broadly efficient but offer the opportunity to construct all-weather core portfolios that combine low-cost beta with systematic factor exposures with the potential outperform over the long run. This belief underlies our approach to ETF selection within each major asset class – Australian equities, global equities and fixed income.
A smarter approach to Australian equities
As a case study of this approach, consider how we select and combine Australian Equity ETFs.
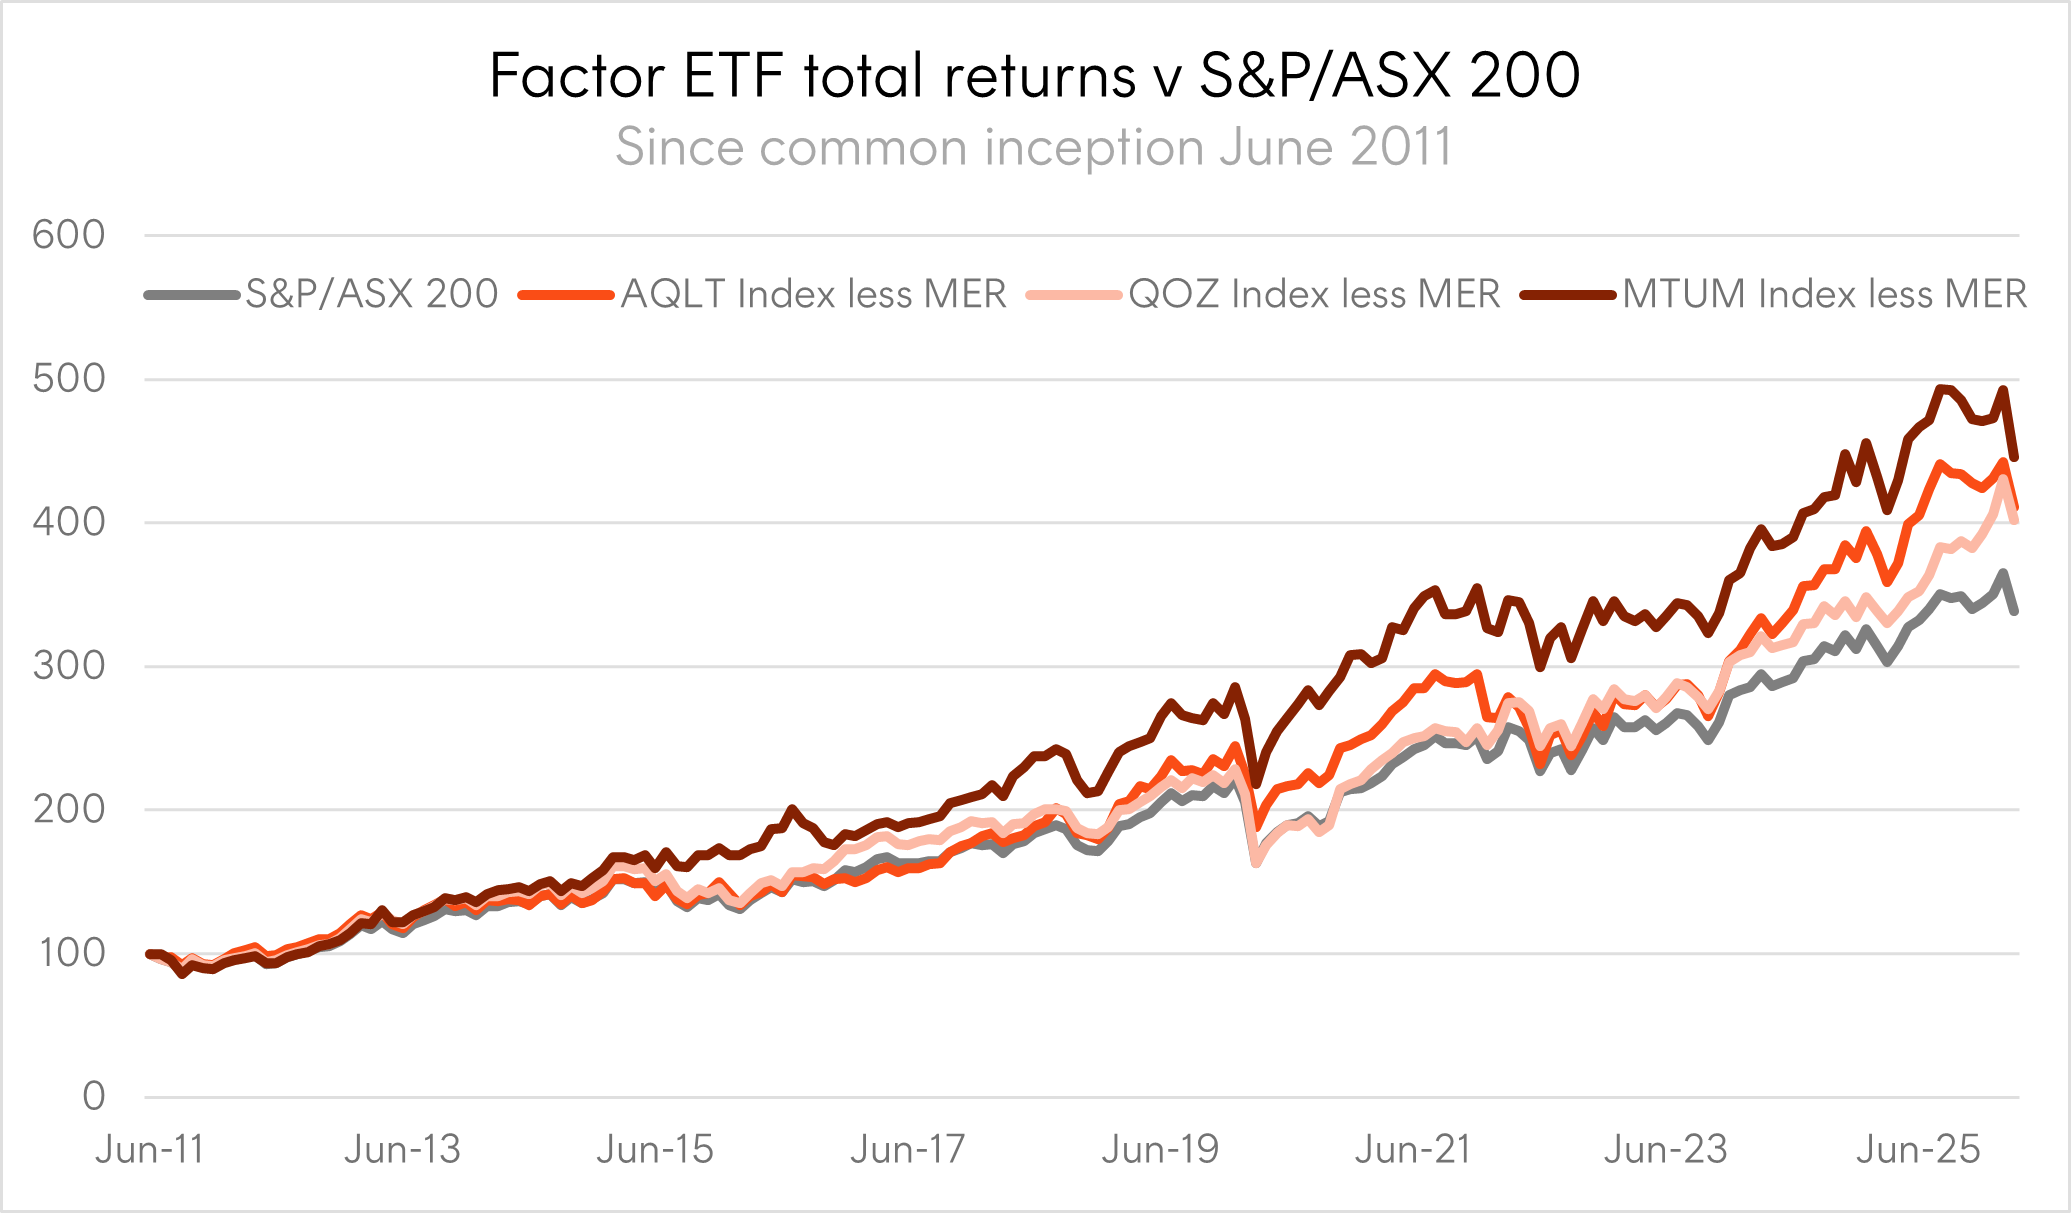
Beating the S&P/ASX 200 benchmark consistently has been a tough ask, particularly if you are an active manager with higher active fees and cash drag. However, there are rules-based or systematic factor exposures that can be implemented at a reasonable fee level, increasing the probability of outperforming after costs. Betashares manages Australian equity ETFs that provide exposure to Quality ( AQLT Australian Quality ETF ), Value ( QOZ FTSE RAFI Australia 200 ETF ) and Momentum ( MTUM Australian Momentum ETF ). As shown below, these systematic factor exposures all outperformed the S&P/ASX 200 benchmark over this long term period, even after incorporating the relevant ETF’s management fee.
|
ASX 200 |
AQLT |
QOZ |
MTUM |
|
|
Total Return (p.a.) |
8.6% |
10.0% |
9.9% |
10.7% |
|
Volatility (p.a.) |
13.24% |
14.10% |
13.54% |
14.18% |
|
Sharpe Ratio |
0.50 |
0.57 |
0.58 |
0.61 |
Investment Period is 30 June 2011 to 31 March 2026. Each of the ETF return series shown are underlying index returns less the ETF management fees and costs (0.35%, 0.40%, 0.35% p.a. respectively) and includes a period prior to each ETF’s inception date. The ETFs were incepted on 4 April 2022, 10 July 2013 and 22 July 2024, respectively. AQLT’s lndex is the Solactive Australia Quality Select Index. QOZ’s index is the FTSE RAFI Australia 200 Index. MTUM’s index is the Solactive Australian Momentum Select Index. A risk free rate of 2% was used for Sharpe ratio calculations. Actual outcomes may differ materially. You cannot invest directly in an index. Past performance is no guarantee of future results of any index or ETF.
Based on long term outperformance and Sharpe ratio alone, investing in MTUM appears to be the best alternative. However, it is important to consider the nature of how and when these factor exposures outperform.
The chart below shows the cumulative excess return of each over time – when the gradient of each line is positive (upward sloping) that represents growing outperformance, when it is negative (downward sloping) that is a period of underperformance. While Momentum may have generated the largest outperformance over the overall timeframe, it has also suffered from extended periods of underperformance and drawdowns, underperforming over the most recent 5 years, for example.
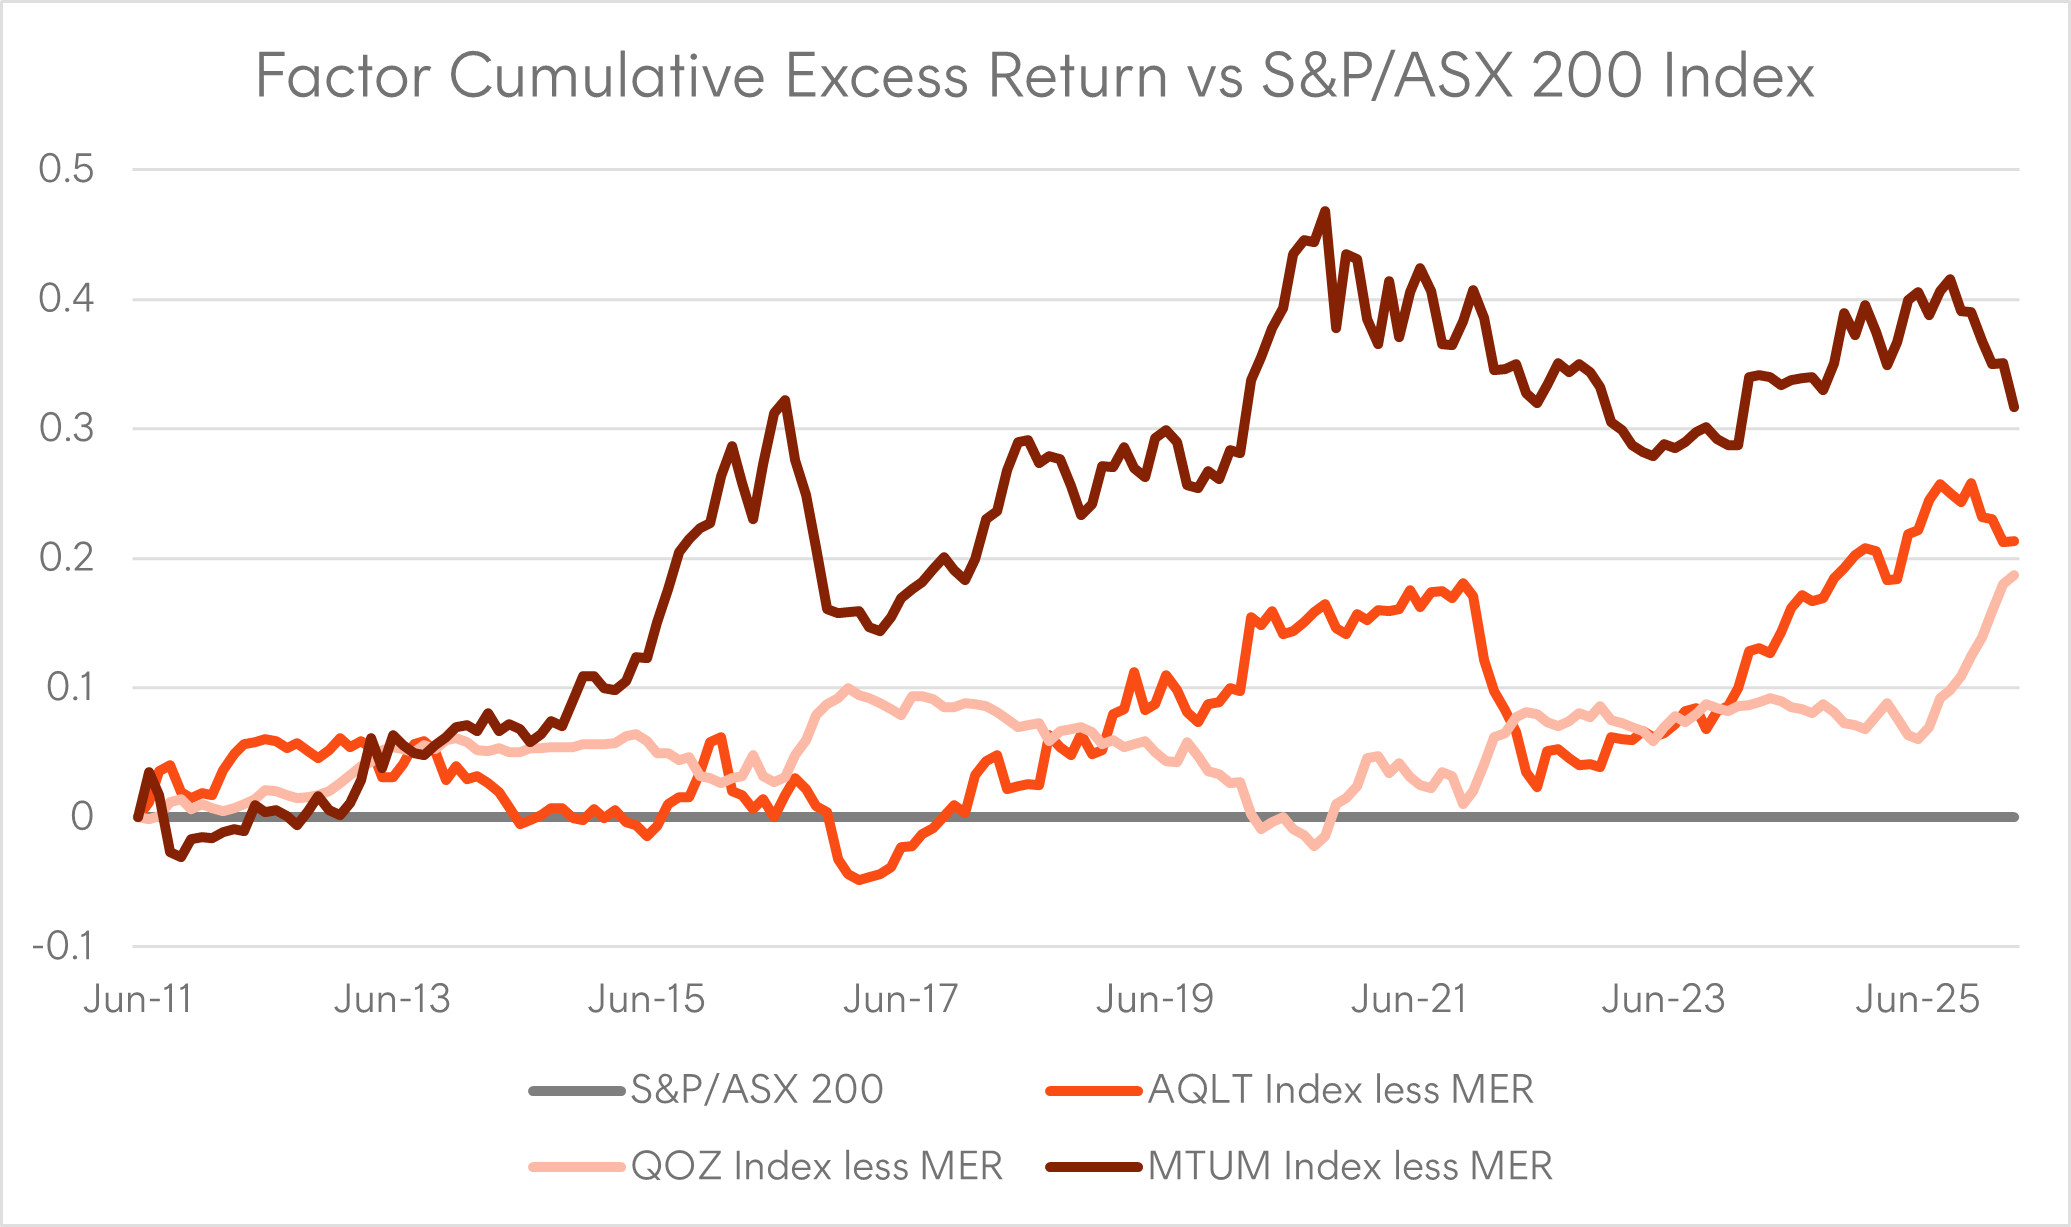
Investment Period is 30 June 2011 to 31 March 2026. Excess returns are calculated as geometric excess returns relative to the S&P/ASX 200 Index benchmark. Actual outcomes may differ materially. You cannot invest directly in an index. Past performance is no guarantee of future results of any index or ETF.
While each of these factors has demonstrated long term outperformance potential, it is also true that:
- They do not consistently outperform over all time periods and can suffer from episodic material drawdowns relative to market; and
- They tend to outperform at different time periods, their excess returns are not highly correlated.
We acknowledge these are risks of factor investing, but it also represents an opportunity for skilled investors. While some may try to move in and out of factors as they come into favour, we believe factor timing is extremely difficult, and instead seek to exploit the diversification benefits of combining factors. By blending excess return sources that have low or even negative correlation, we can potentially reduce the risk of deviating from market in the shorter term, as measured by tracking error, while maintaining the outperformance potential of each individual factor.
The investment committee’s objective is to find the right blend of these factor building blocks which maximises something called the Information Ratio (a measure of excess return per unit of tracking error). Based on our current modelling that optimal blend is 30% AQLT, 50% QOZ and 20% MTUM.
As can be seen in the chart below, this blend has a higher Information Ratio than any of the individual building blocks over the investment period.
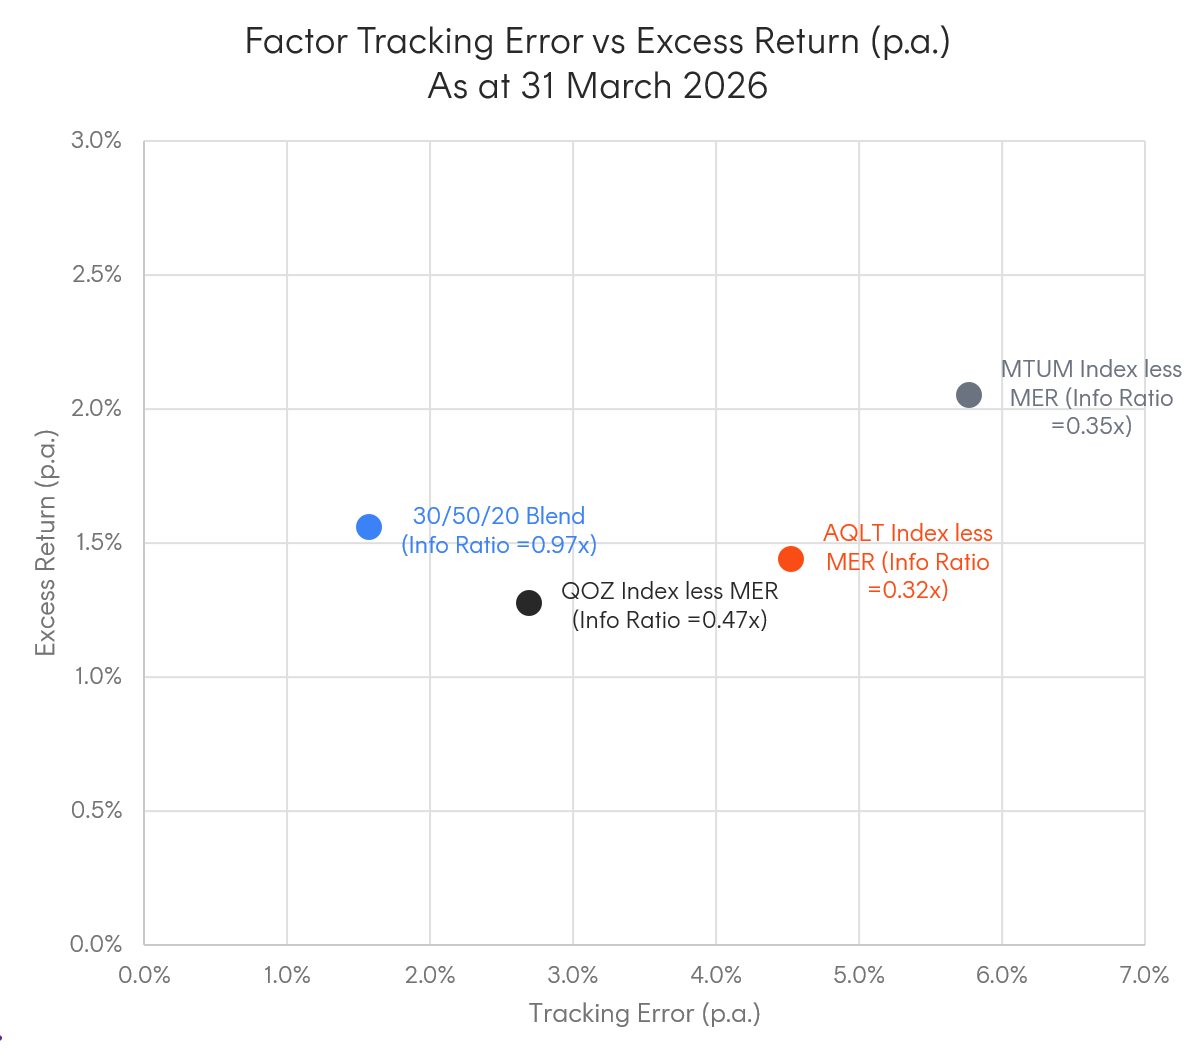
Investment Period is 30 June 2011 to 31 March 2026. “30/50/20 Blend” is 30% AQLT, 50% QOZ and 20% MTUM, rebalanced monthly. Excess returns and tracking error are calculated are excess returns relative to the S&P/ASX 200 Index benchmark, based on each ETF’s underlying index returns less the ETF management fees and costs (0.35%, 0.40%, 0.35% p.a. respectively). Actual outcomes may differ materially. You cannot invest directly in an index. Past performance is no guarantee of future results of any index or ETF.
Revisiting the earlier chart showing the cumulative excess return of each factor over time – but this time also including the 30/50/20 Blend in black in the chart below – the return profile of the blend is far more consistent in generating outperformance through time, and does not suffer from the significant drops experienced by each of the individual factor exposures.
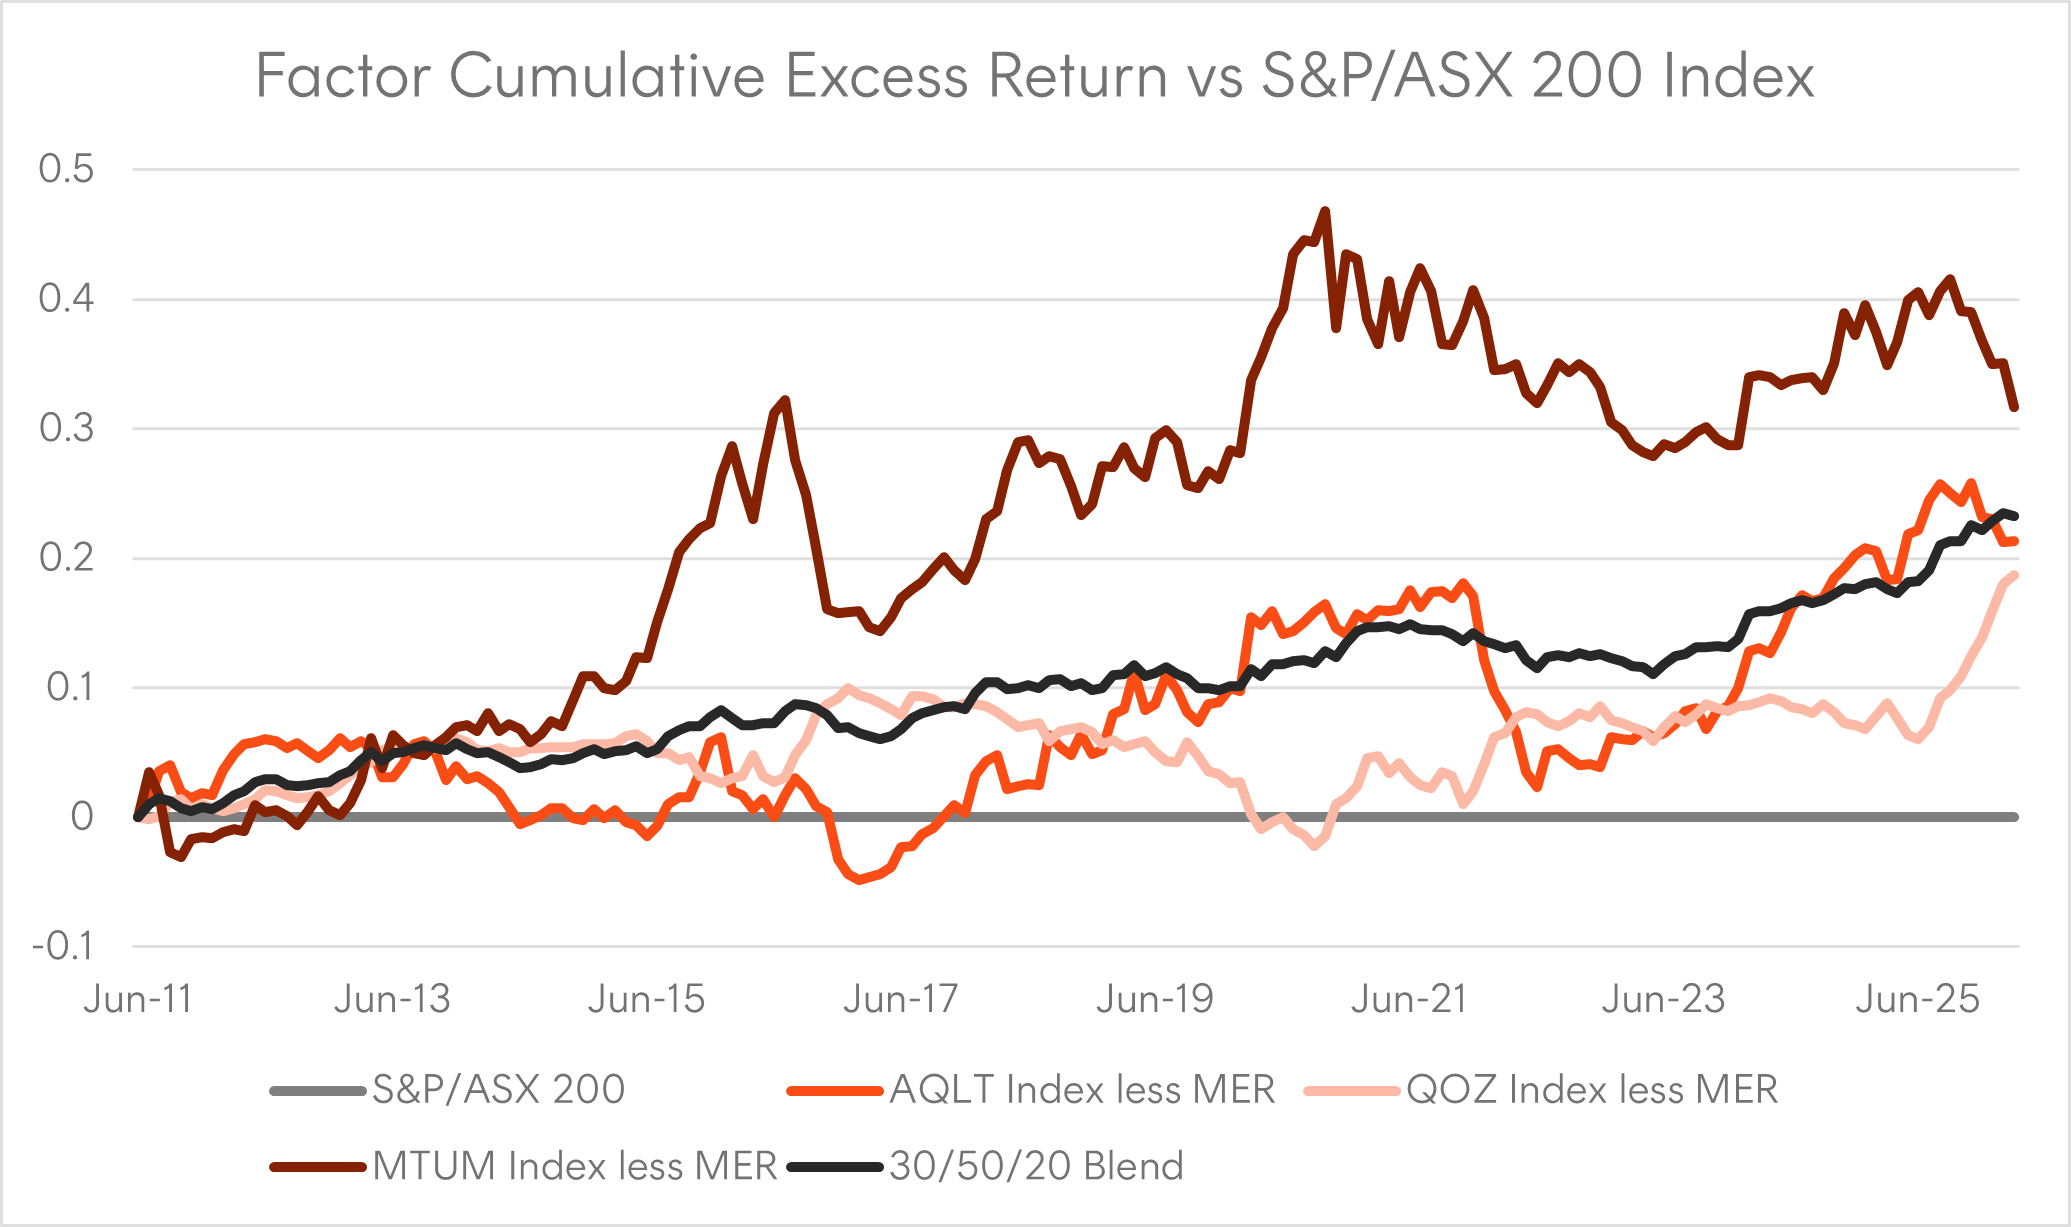
Investment Period is 30 June 2011 to 31 March 2026. “30/50/20 Blend” is 30% AQLT, 50% QOZ and 20% MTUM, rebalanced monthly. These specific weights for the Australian equities factor blend were first implemented within our Dynamic Managed Accounts on 28 February 2025. As such performance for the time period prior to that should be considered hypothetical and does not represent actual performance of the Dynamic Managed Accounts Australian equities allocation. Excess returns are calculated as geometric excess returns relative to the S&P/ASX 200 Index benchmark. Actual outcomes may differ materially. You cannot invest directly in an index. Past performance is no guarantee of future results of any index or ETF.
Then as a final step for our Dynamic Managed Account portfolios, we implement our Australian equities allocation as a 50% weight to the lowest cost Australian equity index ETF (A200) and a 50% weight to this factor blend (in the ratios described above). Adding low-cost market beta further reduces portfolio tracking error and management costs. These specific weights were first implemented on 28 February 2025.
How this approach has worked in practice
The 12-month period to 31 March 2026 provides context as to why blending factors is a sound investment approach. It really was a tale of two halves.
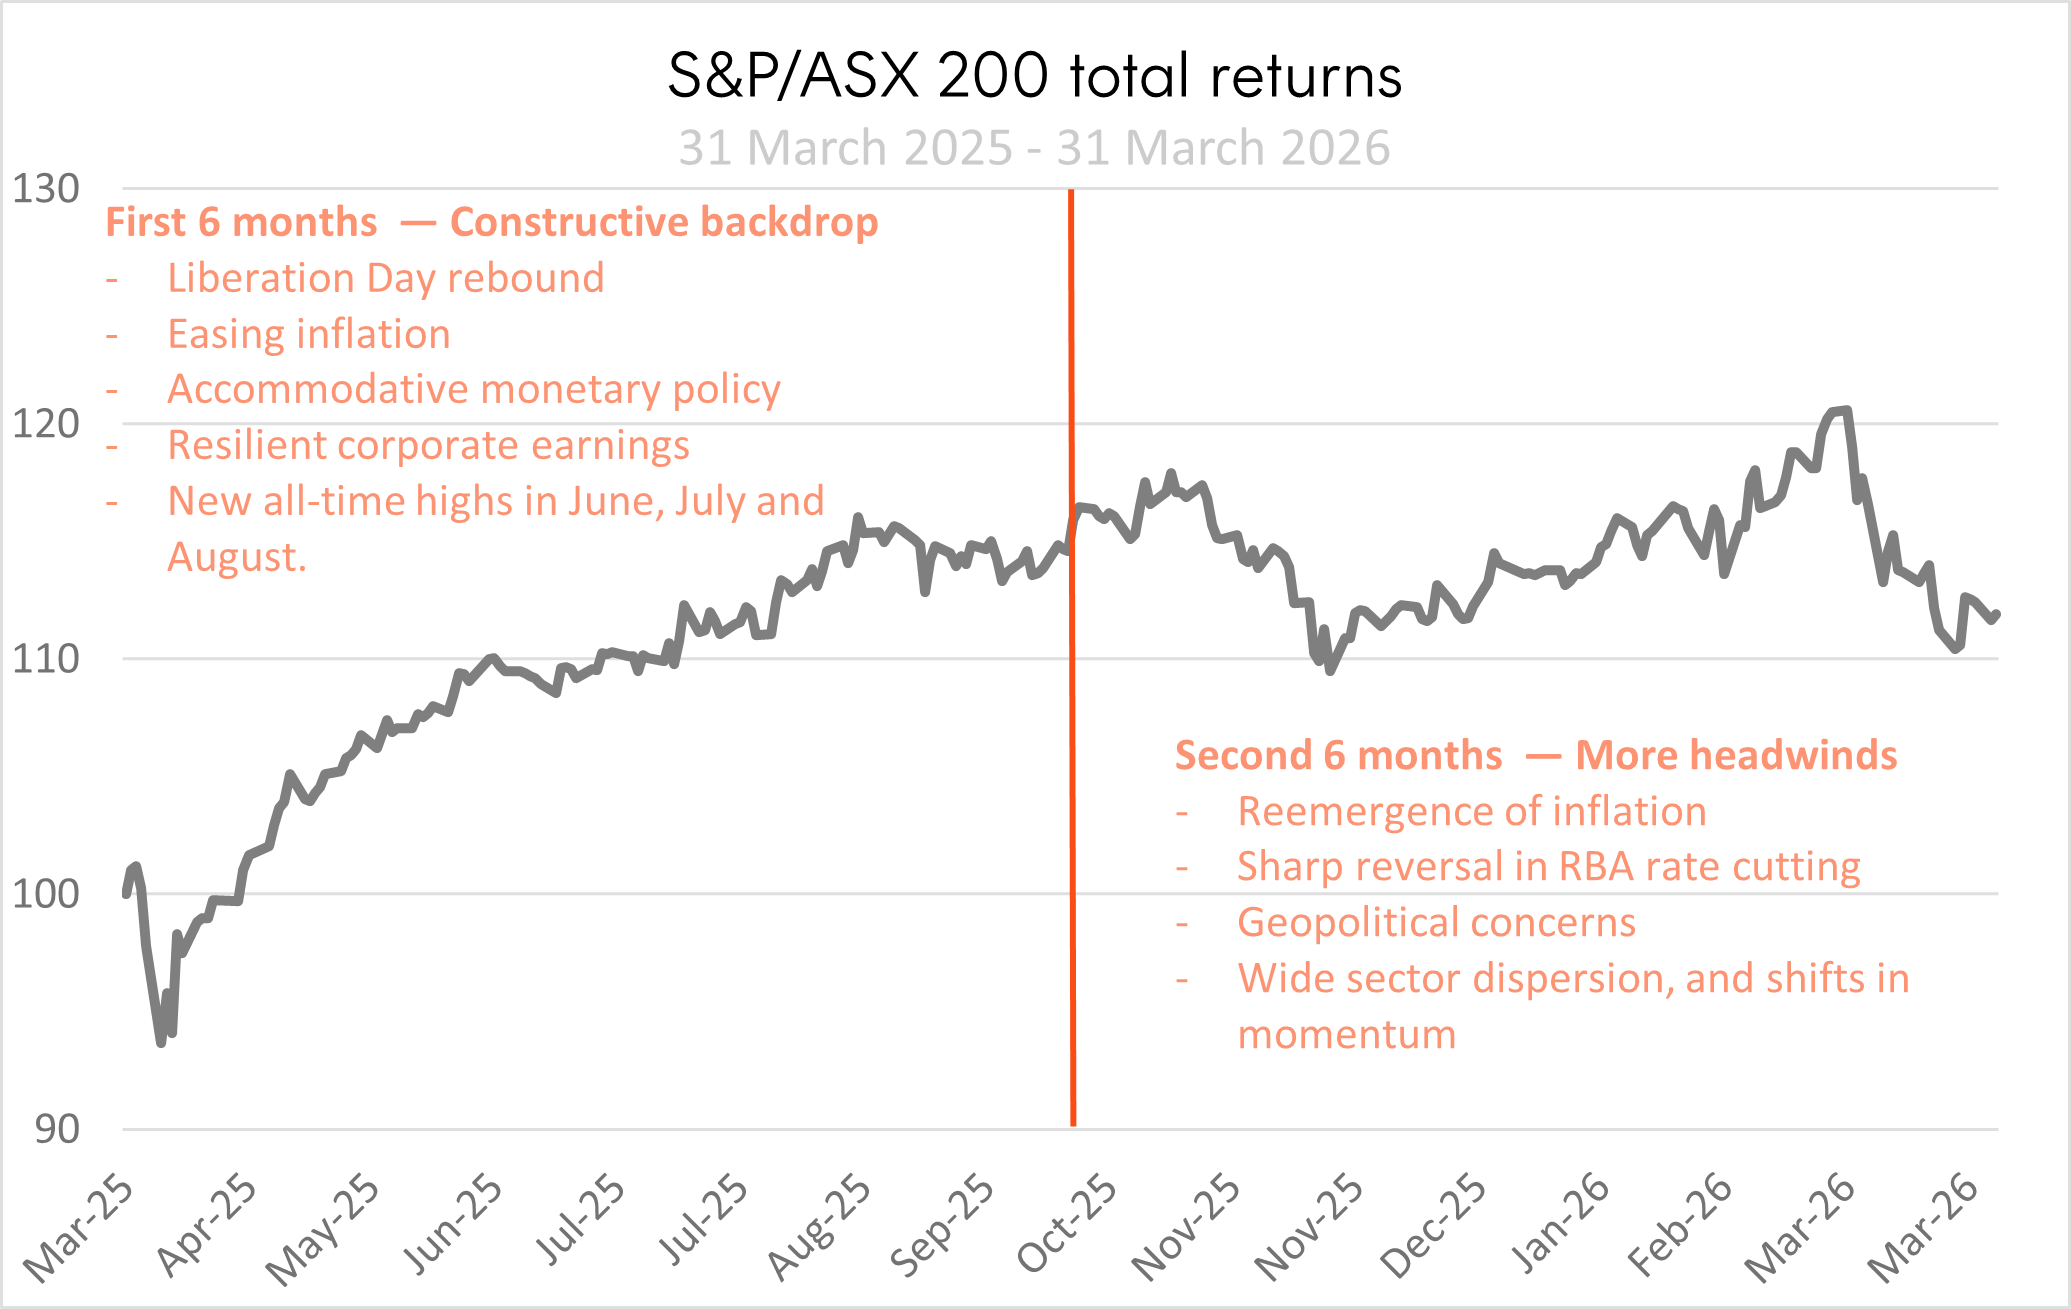
Investment Period is 31 March 2025 to 31 March 2026. Actual outcomes may differ materially. You cannot invest directly in an index. Past performance is no guarantee of future results of any index or ETF.
The difference in the performance of each of the factor ETFs between the first and second periods was quite stark, as can be seen in the cumulative excess return chart below.
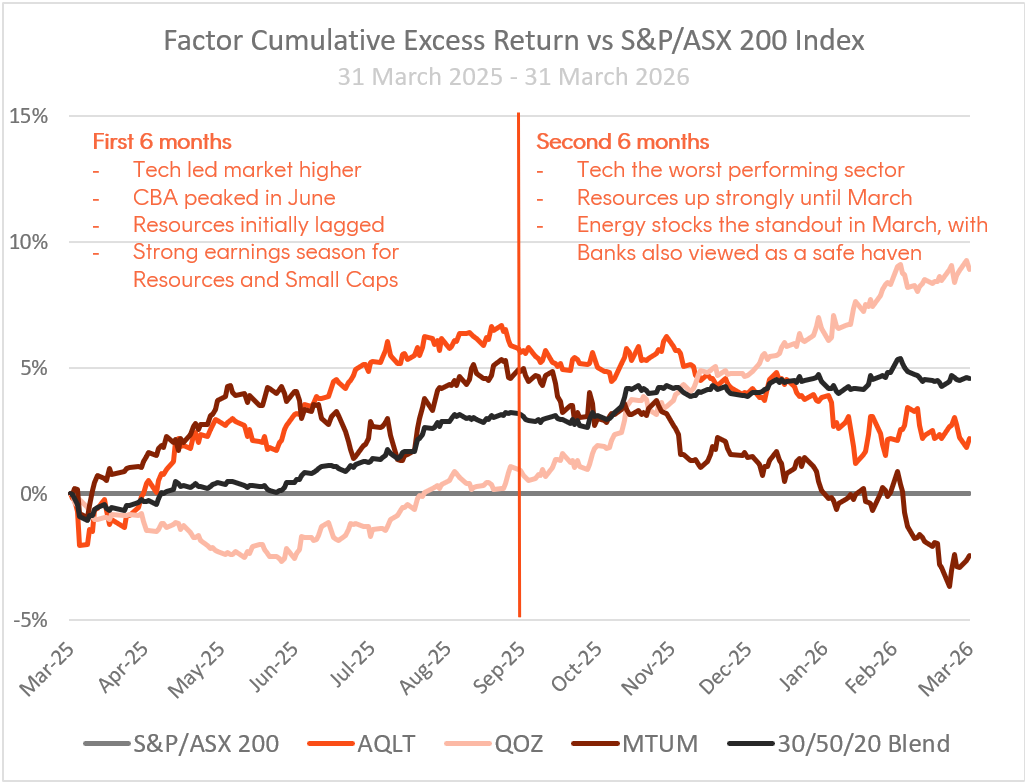
Investment Period is 31 March 2025 to 31 March 2026. Each of the ETF return series shown is total returns for the ETF (which is net of management fees and costs of 0.35%, 0.40%, 0.35% p.a. respectively). “30/50/20 Blend” is 30% AQLT, 50% QOZ and 20% MTUM, rebalanced monthly. The ETFs were incepted on 4 April 2022, 10 July 2013 and 22 July 2024, respectively. These specific weights within our Australian equities factor blend were first implemented on 28 February 2025. Excess returns in the chart are calculated as geometric excess returns relative to the S&P/ASX 200 Index benchmark. Actual outcomes may differ materially. You cannot invest directly in an index. Past performance is no guarantee of future results of any index or ETF.
|
Return Period |
|
A200 |
AQLT |
QOZ |
MTUM |
|
6 months to 30 Sept 2025 |
Total Return |
14.7% |
21.1% |
15.7% |
20.2% |
|
Relative Return |
6.5% |
1.1% |
5.6% |
||
|
6 months to 31 Mar 2026 |
Total Return |
-2.4% |
-5.5% |
5.3% |
-9.2% |
|
Relative Return |
-3.2% |
7.7% |
-6.8% |
A200 is the Betashares Australia 200 ETF, AQLT is Betashares Australian Quality ETF, QOZ is the Betashares FTSE RAFI Australia 200 Index and MTUM is the Betashares Australian Momentum ETF. Total returns for each ETF and relative returns (relative to A200) are shown for the period 31 March 2025 – 30 Sept 2025 and 30 Sept 2025 – 31 March 2026. Returns include all fees and costs associated with each ETF (0.04%, 0.35%, 0.40%, 0.35% p.a. respectively). Actual outcomes may differ materially. Past performance is no guarantee of future results of any index or ETF.
In the first six months, all three ETFs outperformed the market, but the easing RBA stance and risk on sentiment favoured Momentum and Quality. In the second six months, some of the sectors that had strong momentum like Information Technology suffered a material reversal, whereas value-oriented sectors were strongest during earnings season and through March, leading to strong outperformance by QOZ.
Despite negative relative returns for two of the three ETFs in the second six months, the factor blend used within the Dynamic Managed Accounts was far more consistent. As a result of the weights assigned to AQLT, QOZ and MTUM, the blend outperformed in both six-month periods. The total return of AQLT, QOZ and MTUM blend was 17.1% over the 12-months to 31 March 2026, compared to only 11.9% for our low cost market beta exposure, A200.
It is important to note that blending factors does not guarantee outperformance, and the factor blend adopted by within our Dynamic Managed Accounts will underperform from time to time. There are no guarantees in markets, but by blending multiple factors we stand a better chance of reducing the magnitude and longevity of those periods of underperformance. This is perhaps the greatest strength of our approach.
Disclaimers:
There are risks associated with an investment in the Funds. An investment in the Funds should only be considered as a part of a broader portfolio, taking into account your client’s particular circumstances, including your client’s tolerance for risk. For more information on risks and other features of the Funds, please see the Product Disclosure Statement and Target Market Determination, both available on www.betashares.com.au.Past performance is not indicative of future performance.Any Betashares Fund that seeks to track the performance of a particular financial index is not sponsored, endorsed, issued, sold or promoted by the index provider. No index provider makes any representations in relation to the Betashares Funds or bears any liability in relation to the Betashares Funds.Any information provided is not a recommendation or offer to make any investment or to adopt any particular investment strategy. Financial advisers should make their own professional assessment of the suitability of such information, relying on their own inquiries.