Key points
The Q2 earnings season has been an impressive show of force from the US equity market, with one of the highest ‘beat’ rates on record. But it’s more than just an AI story, the median S&P 500 stock has grown its Q2 earnings ~14% year over year, which is the largest increase since coming out of COVID.1
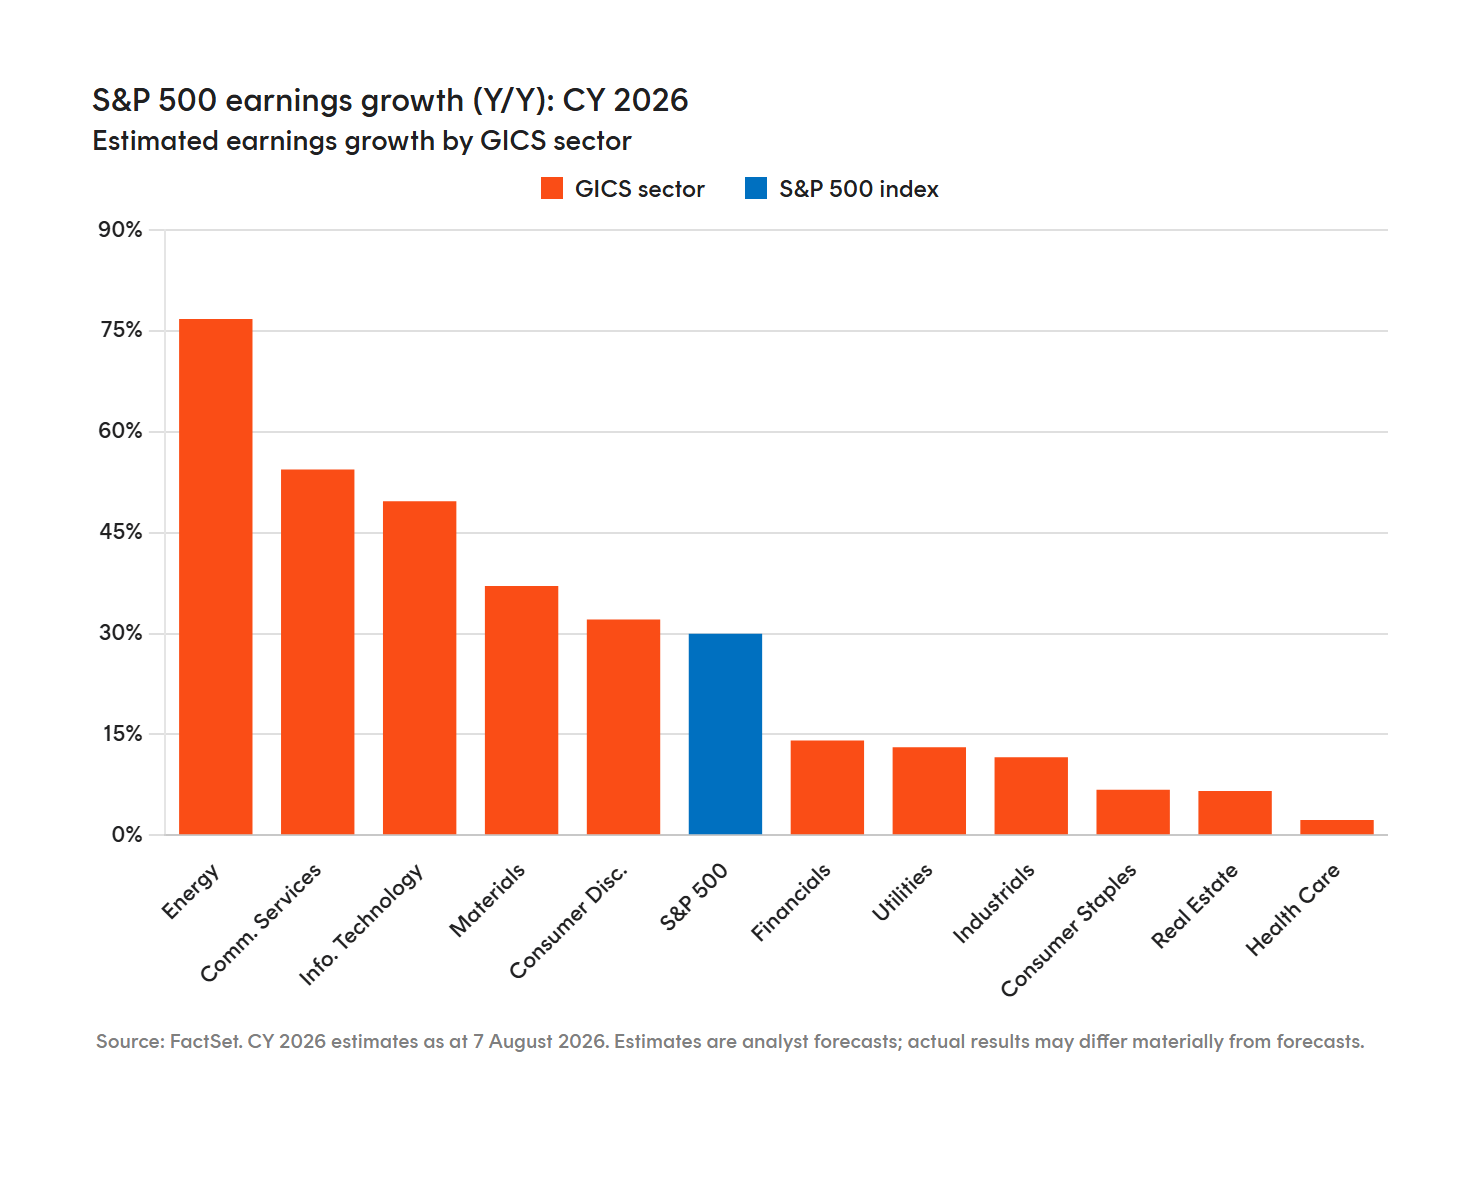
The IT sector has contributed approximately two thirds of the aggregate index growth, but earnings growth breadth is improving. All sectors are expected to post positive earnings growth in calendar year 2026. Energy and Materials have seen strong upward revisions this year, in particular.
While the cloud margin expansion and growing customer backlogs of the hyperscalers have been impressive, many US investors have become uncomfortable with the level of volatility in AI stocks and some extreme moves on announcement days. Investors are seeing value in sectors beyond AI, which were under-owned earlier in the year, like Healthcare, leading to a broadening out of the US equity market.
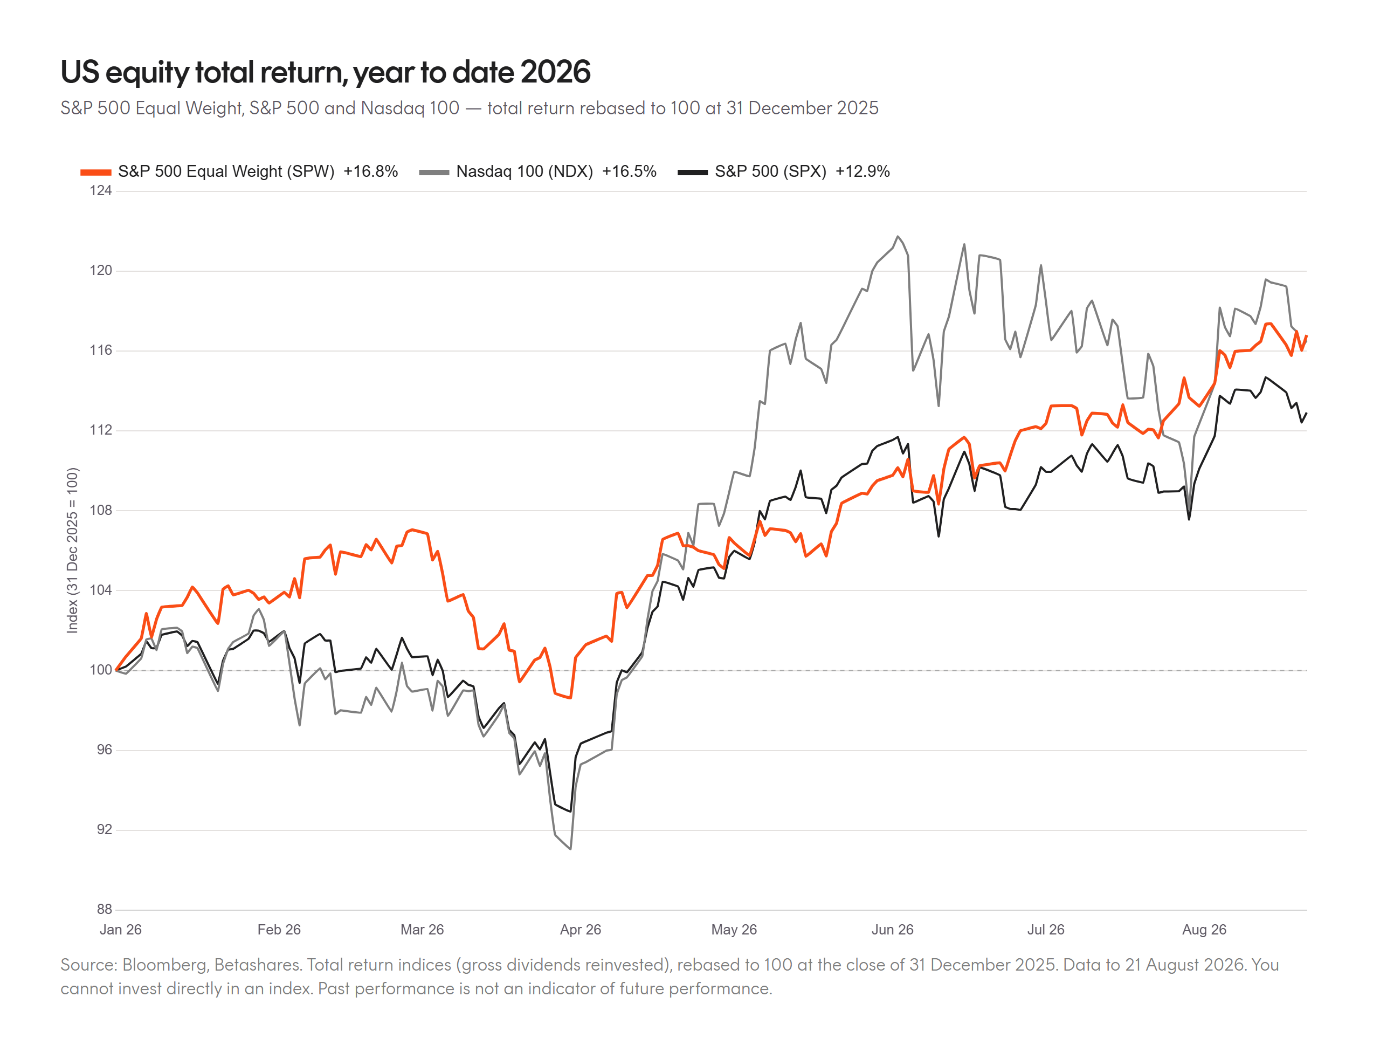
The S&P500 Equal Weight index has had a more durable rally this year, outperforming the S&P500 market-cap Index and holding its own against the more volatile Nasdaq 100. The equal weight index’s draw down in March/April was far more benign, and it held steady in July when the other indices were selling off.
Improving outlook of global equities beyond the US
Along with the US, Japan is the other developed market that stands out for earnings growth. There are a lot of positives for Japanese equities:
- Corporate Japan is becoming more focussed on shareholder returns, with a massive increase in share buybacks and cross-holding unwinds improving return on equity.
- Japanese households still hold ~50% of their assets in cash, and only 14% in equities. The revamped Nippon Individual Savings Account (NISA) program, together with inflation, is encouraging households to shift their wealth from cash to the share market.
- Japanese companies like Tokyo Electron, Advantest, Shin-Etsu Chemical and Lasertec are key suppliers of advanced materials and chemicals, key components, and manufacturing and testing equipment used to produce AI semiconductors and memory chips.
There are also risks to the Japanese bull case, in particular Japan’s earnings growth is in part flattered by a weakening Yen boosting export revenues. But on balance we expect the BOJ to adopt only a moderate trajectory in rate hiking, preserving a meaningful rate differential between the Yen and US dollar.
Europe’s earnings growth has historically been similar to that of Australia, with consistent downgrades to consensus earnings over the calendar years 2023 to 2025. But 2026 seems to have broken that pattern, with earnings growth grinding higher. The Q2 European earnings season was a strong one, with many companies announcing positive earnings surprises and upgrades to future guidance. Consensus 1 year forward EPS growth for the EURO STOXX is now 13.9%, still trailing the S&P500 at an impressive 19.6%.
Europe’s economy faces headwinds, for example higher energy import costs, but its equity market has large weights to energy and utilities that benefit from higher prices and European bank profitability is being helped by higher rates. European equity inflows have been strong this year, driven by foreign buyers, as investors have looked for diversification beyond the AI narrative.
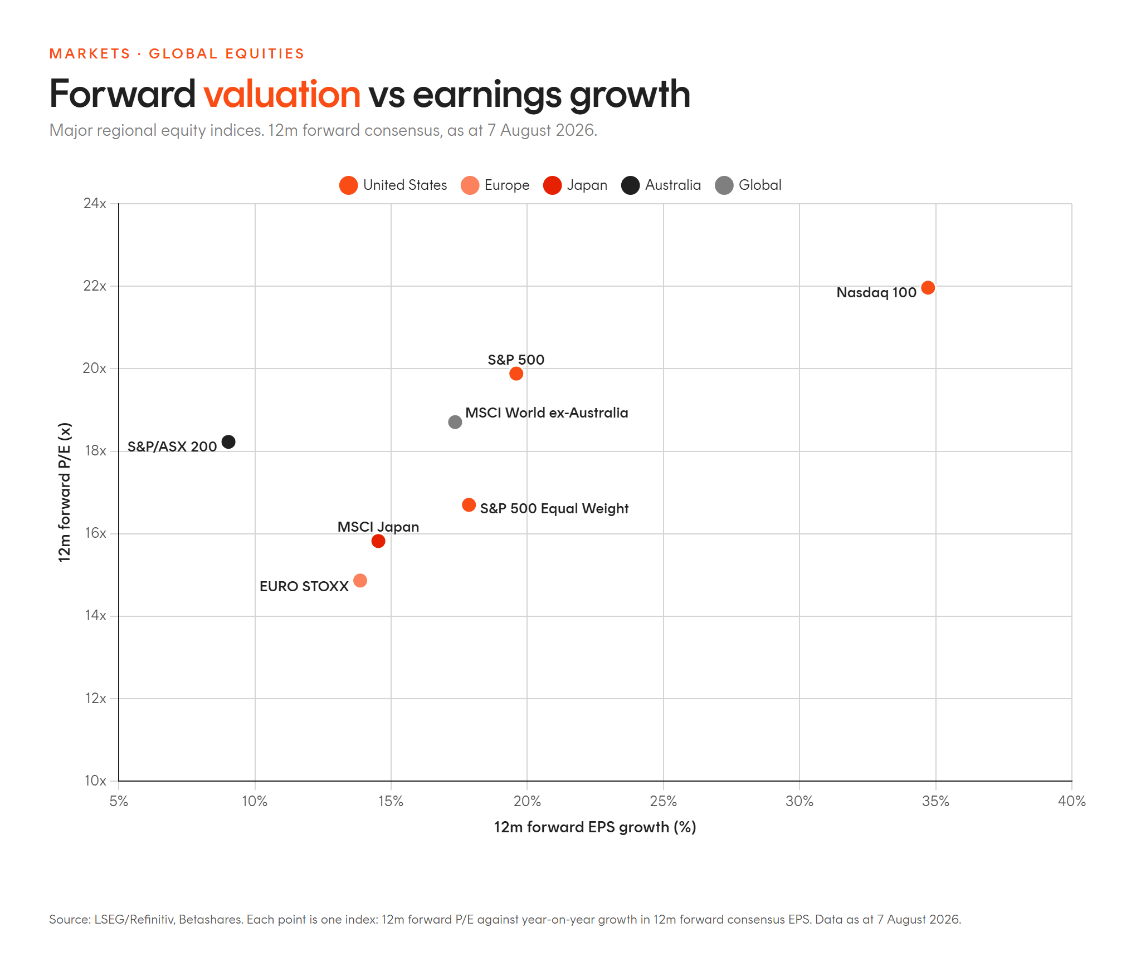
While Australia looks quite unappealing based on fundamentals, ex-US develop markets exposure and the S&P 500 equal weight index offer the combination of reasonable PEs and attractive earnings without being captive to the AI theme.
Investment options beyond the AI leaders
For investors seeking global equities exposure that can help diversify portfolios beyond AI there are good alternatives.
QUS S&P 500 Equal Weight ETF offers a way to participate in what appears to be a broadening out of US earnings growth, with less Tech and more meaningful exposure to Industrials, Financials and other sectors. The Information Technology sector now represents 37% of the S&P500 index, and the weight of the top 5 stocks sits in the 99th percentile.
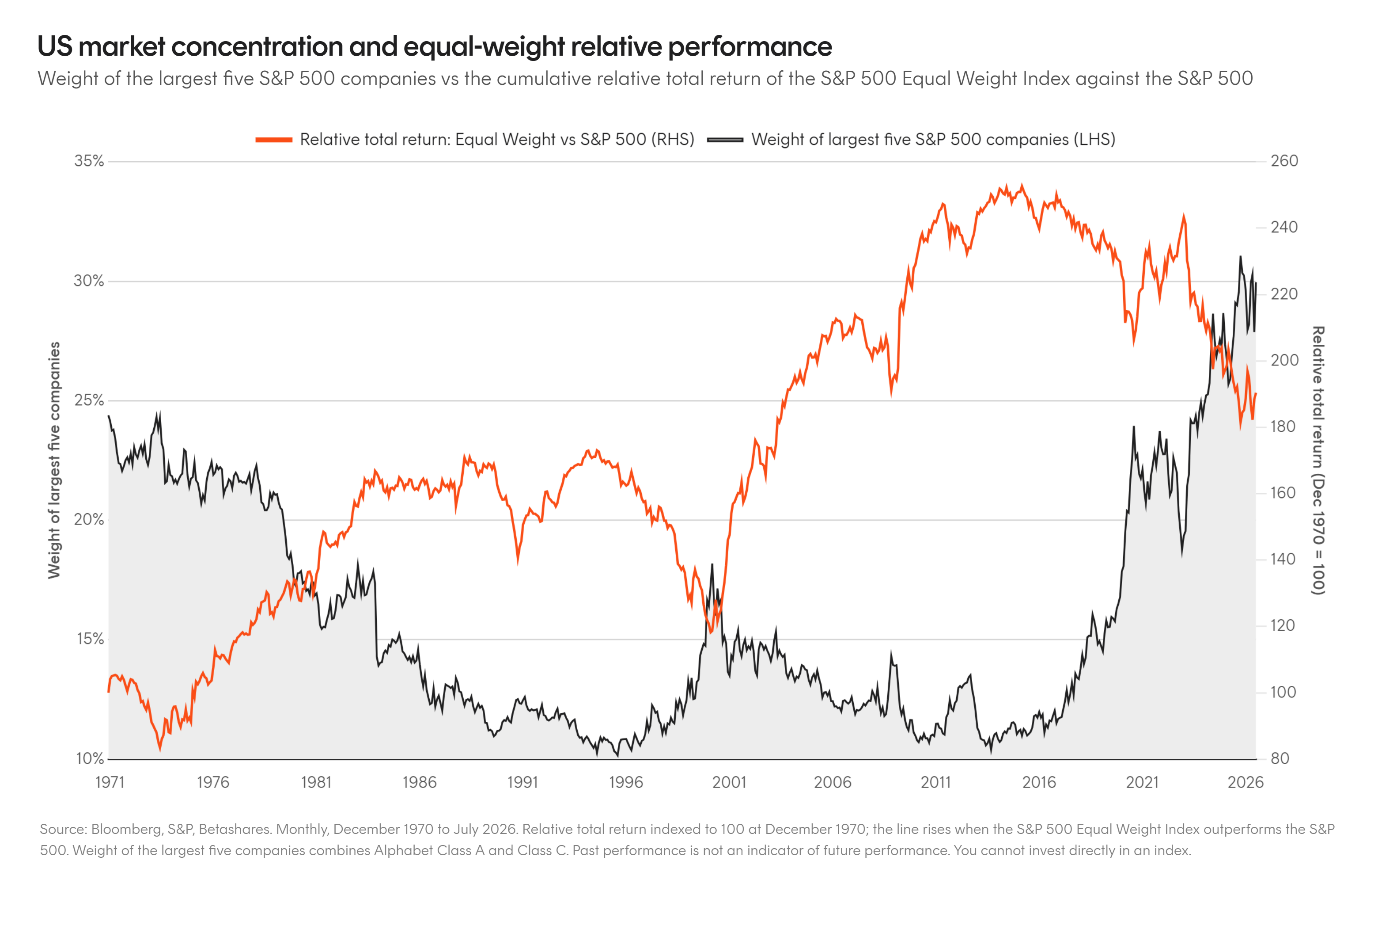
Past unwind of acute concentration in the US market tended to reward equal weight. Where the orange line in the chart above is upward sloping, it represents a period of S&P 500 Equal Weight Index outperformance relative to the market cap index. For example, the 1973 to 1980 Nifty Fifty unwind delivered 6.3% a year of relative outperformance, the 2000 to 2013 post-dotcom broadening 5.5% a year, and 2022 alone 7.9% in twelve months. Of course, the S&P500 Equal Weight has also underperformed over various periods, including the last 10 years, as US market concentration has increased. The question for investors is – are we at a point where this concentration has started to unwind?
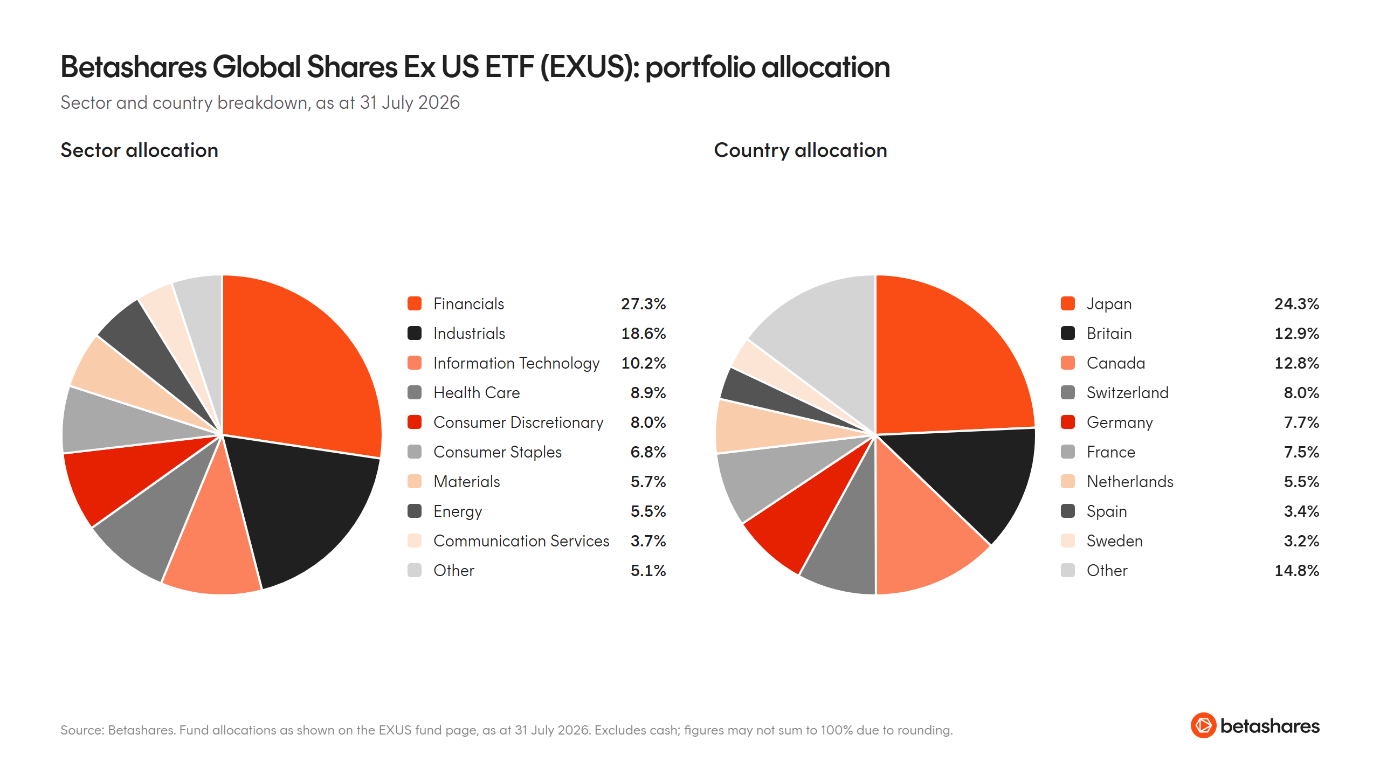
EXUS Global Shares Ex US ETF provides a global developed markets exposure that excludes the US and Australia. This ETF holds Japanese, European, Canadian and UK equities, again with a significantly lower weight to tech. EXUS can also be considered as a tactical allocation if US economic growth disappoints.