
Annabelle Dickson
5 minutes reading time
A wrap up of the charts catching our eye over the past month.
With the first quarter of the year already drawing to a close, we’ve seen a strong start to the year across a wide range of markets, including local, US, and global equities.
A lot of focus recently has been on US equities, and in particular, the ‘Magnificent 7’. In a change of pace this month, we’ll instead turn our attention to Asia, an area that’s underrepresented in many portfolios, despite boasting attractive fundamentals.
Rate cut expectations get pared back
Markets have significantly reduced their expectations for rate cuts from the Fed already this year, but pricing still points heavily to further cuts. The expected bottom in interest rates is also now notably lower than it was at the end of last year.
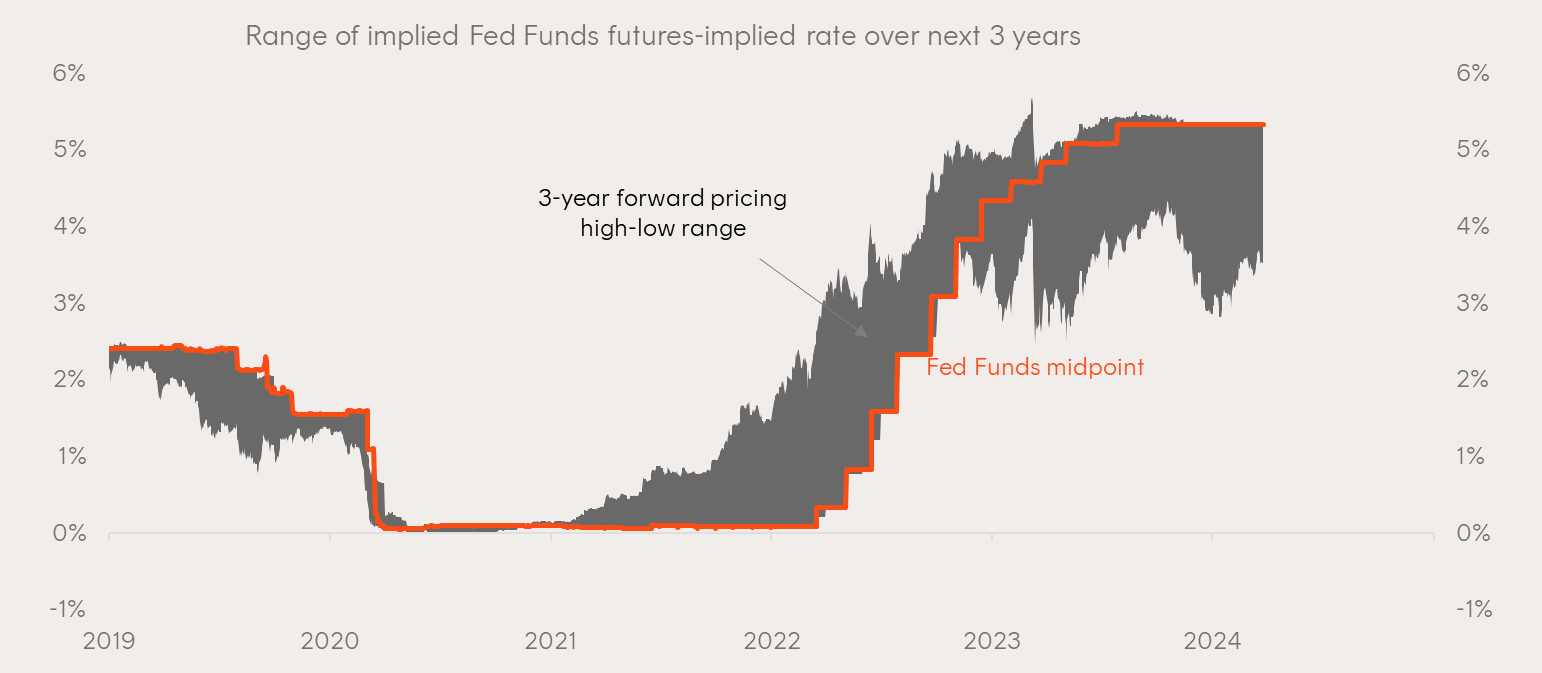
Source: Bloomberg, US Federal Reserve, Betashares. As at 25 March 2024. Future results are impossible to predict and inherently uncertain. Actual events or results may differ materially from those reflected above.
Asia – a key link in the Nvidia supply chain
Much has been said about the incredible growth seen from Nvidia over the last year. But when a company like Nvidia grows at such a pace, it inevitably has an impact on their suppliers.
Looking at Nvidia’s Cost of Goods Sold (COGS), Nvidia’s three biggest suppliers are all based in Asia:
- Taiwan Semiconductor Manufacturing Co – one of the world’s leading semiconductor foundries, best known for their ability to manufacture the most advanced available ‘3 nanometre’ chips.
- Wistron Corporation – an electronics company specialising in product design and manufacturing.
- SK Hynix – an electronics supplier specializing in dynamic random-access memory (DRAM) and flash memory.
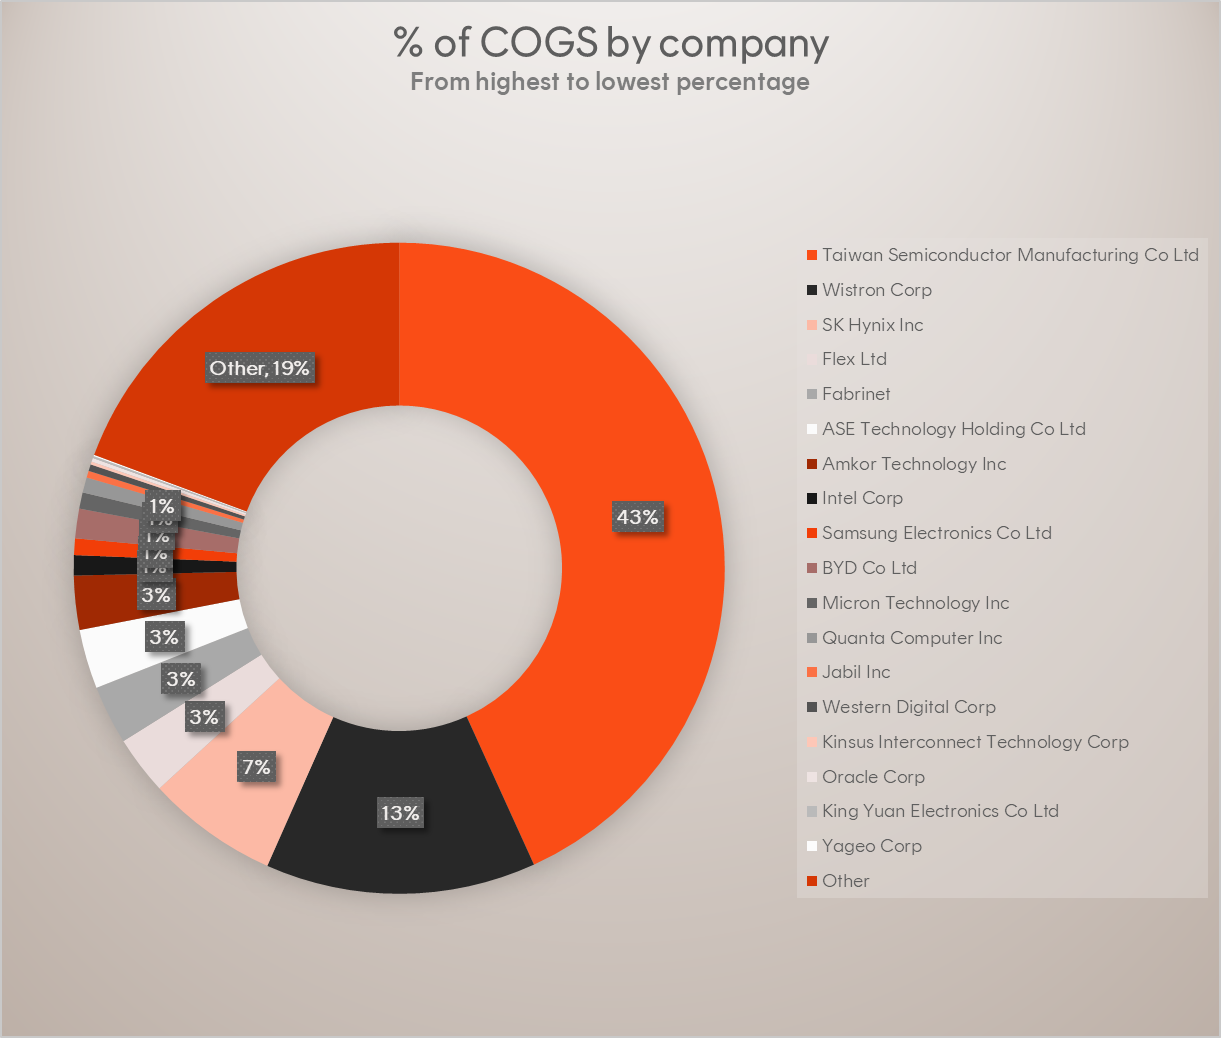
Source: Bloomberg. Suppliers ranked by relationship value (USD). Only quantified relationships are included. As at 29 January 2024, most recent reports or estimates for each supplier used.
When broken down by region, it’s clear that the vast majority of Nvidia’s suppliers are based in Asia.
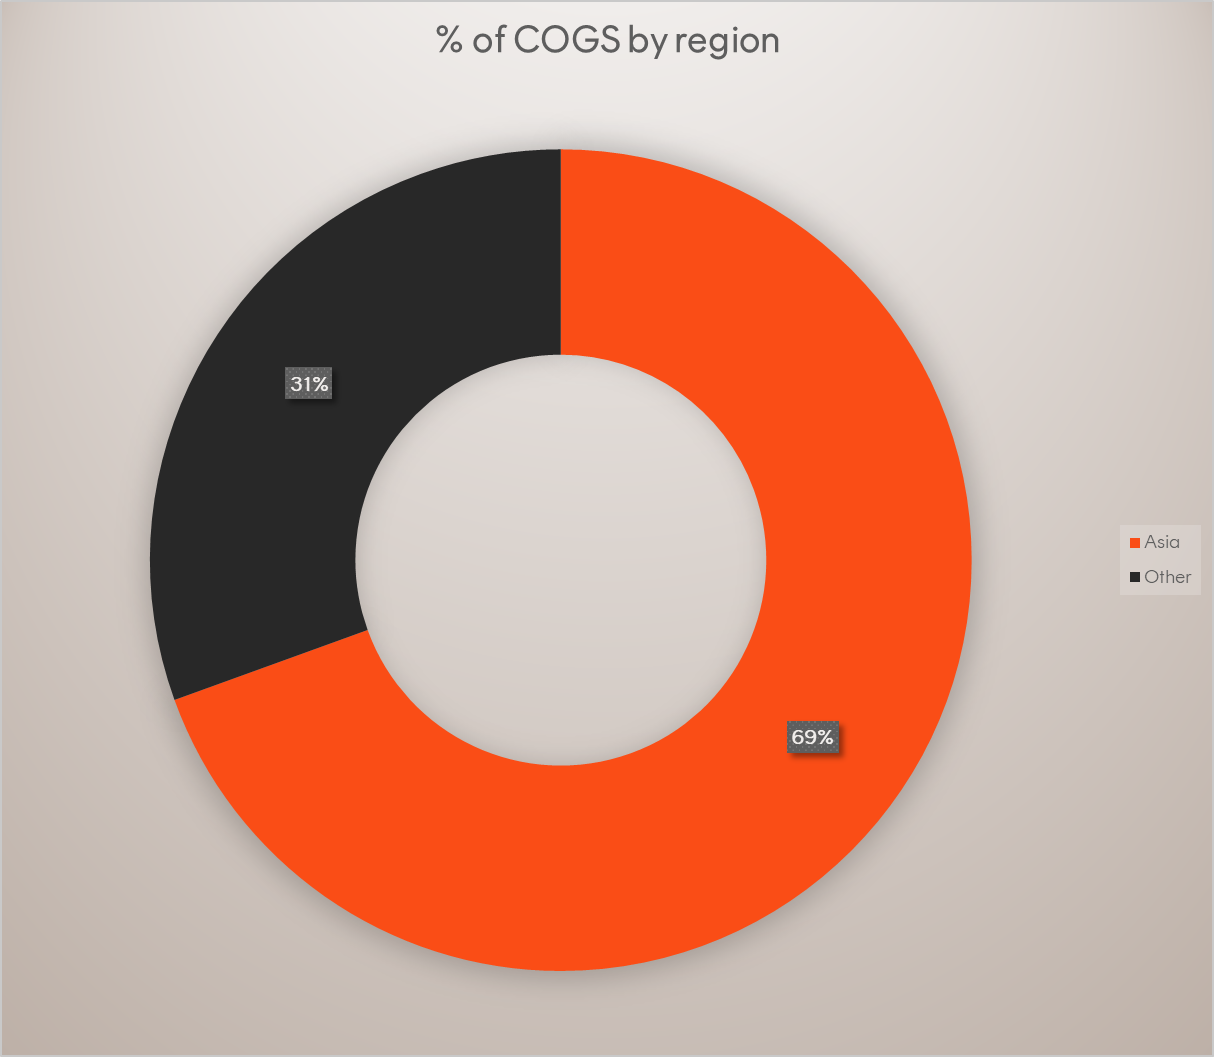
Source: Bloomberg, Betashares. Sum of Nvidia supplier relationship value (USD) for Cost Of Goods Sold expense category. Only quantified relationships are included. As at 29 January 2024, most recent reports or estimates for each supplier used.
Valuations in Asia still look attractive
Despite the recent strong performance of equity markets across many regions in Asia, valuations across these markets still sit within their ‘normal’ ranges, with several regions coming in below their low term averages.
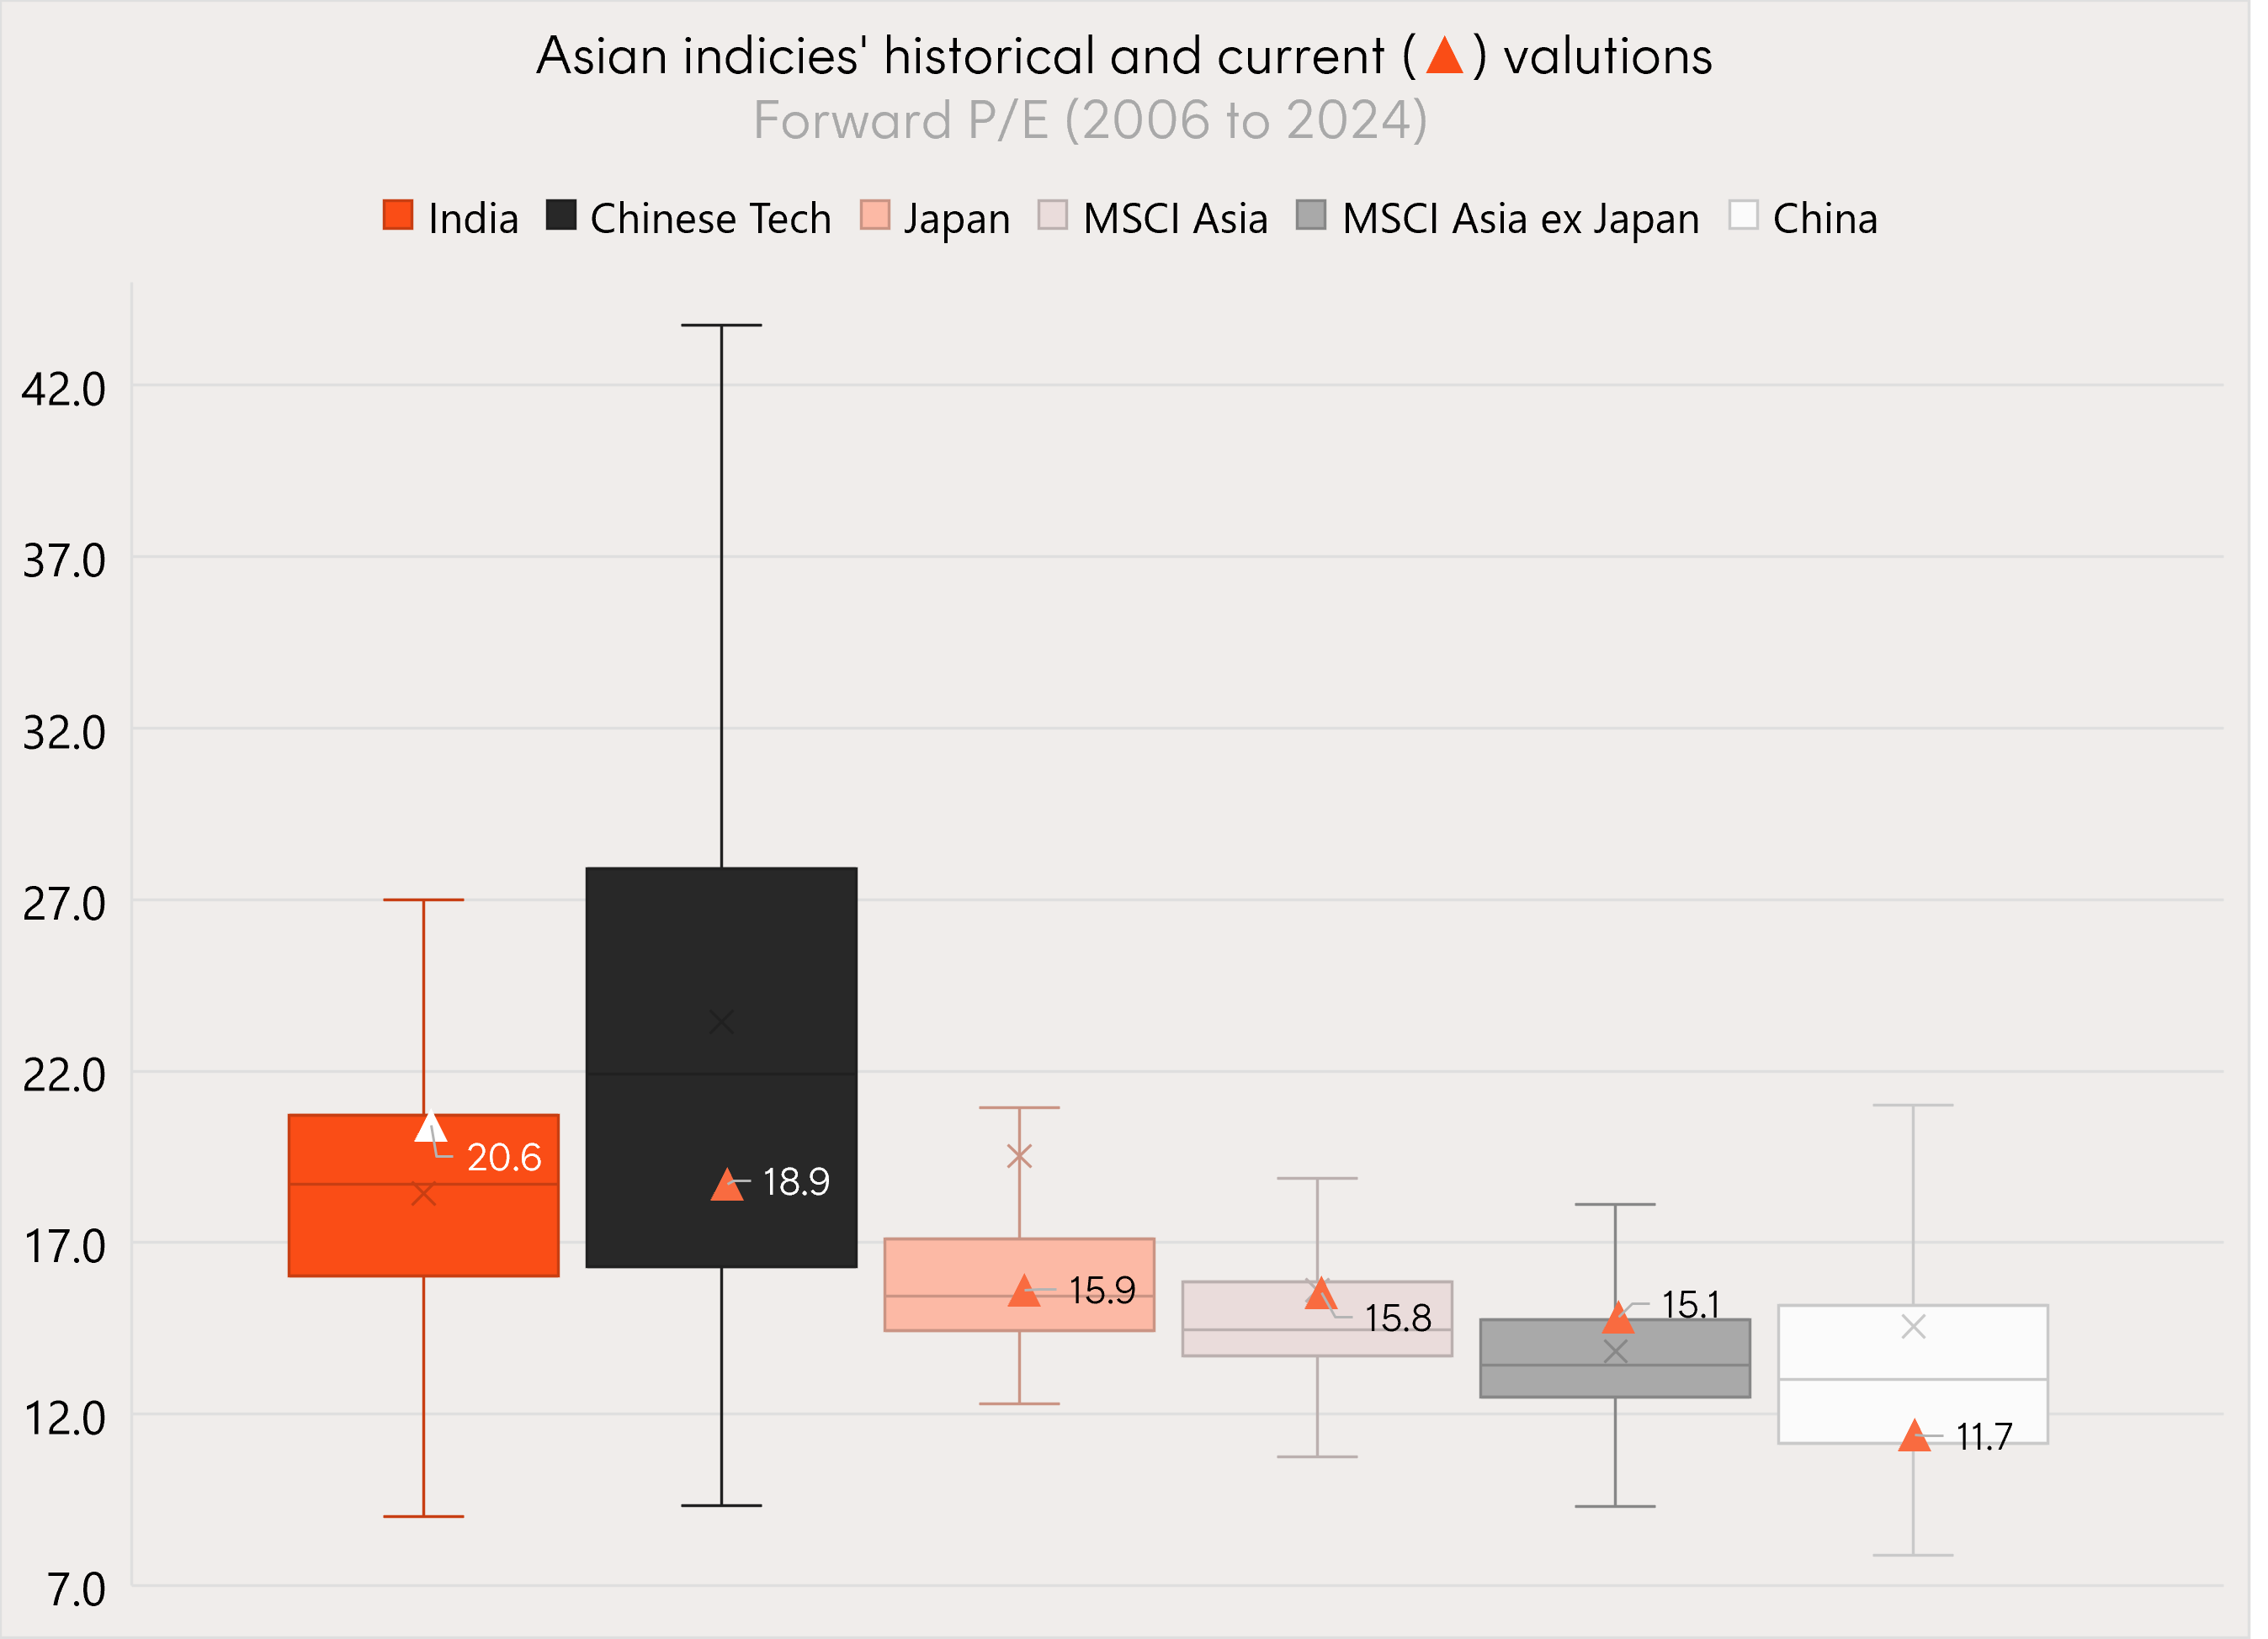
Source: Betashares, Bloomberg. Regions represented by the following indexes: Nifty Fifty (India), Nasdaq Golden Dragon China (Chinese Tech), Topix (Japan), MSCI Asia, MSCI Asia ex Japan, Shanghai Composite (China). You cannot invest directly in an index.
Indian earnings have grown faster than peers
Indian equities have posted strong returns in recent years, and as the chart above shows, now trade at a premium to other Asian regions. But given the impressive growth in earnings per share (EPS) seen over the past five years, the premium is arguably justified.
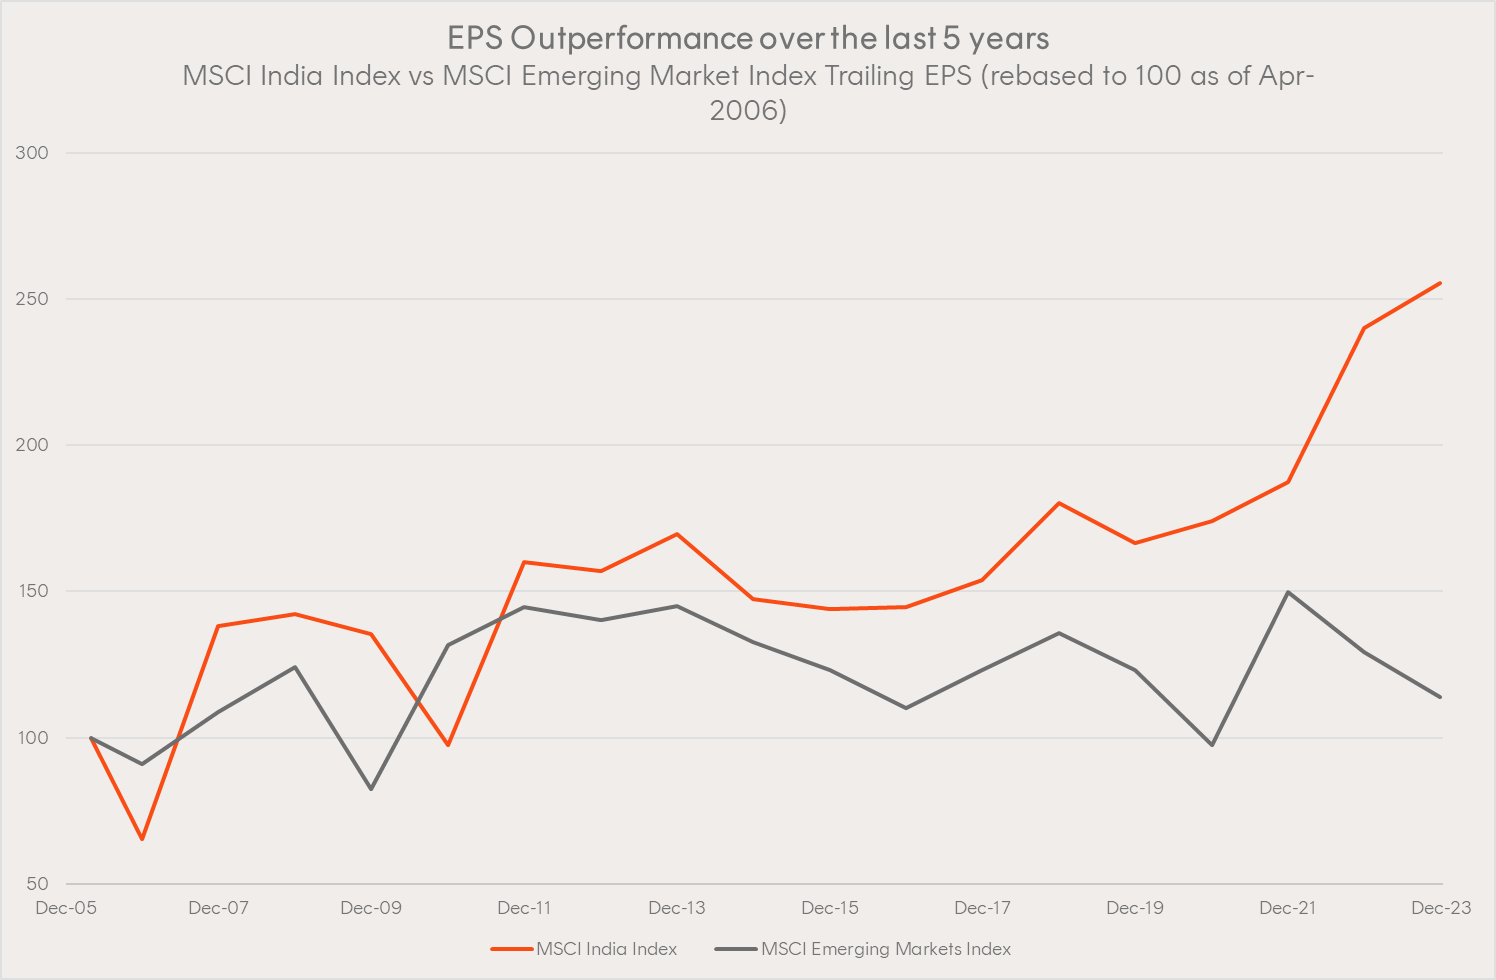
Source: Bloomberg. 28 April 2006 to 31 December 2023. You cannot invest directly in an index. Past performance is not an indicator of future performance.
Rising inflation brings the end of negative rates in Japan
While many countries expressed alarm at the post-COVID rise in inflation, in the case of Japan – which has battled low inflation/deflation for years – the lift in pricing pressure was largely welcome. The sustained lift in wage and prices over the past year was enough to convince the Bank of Japan to jettison its negative interest rate policy in March.
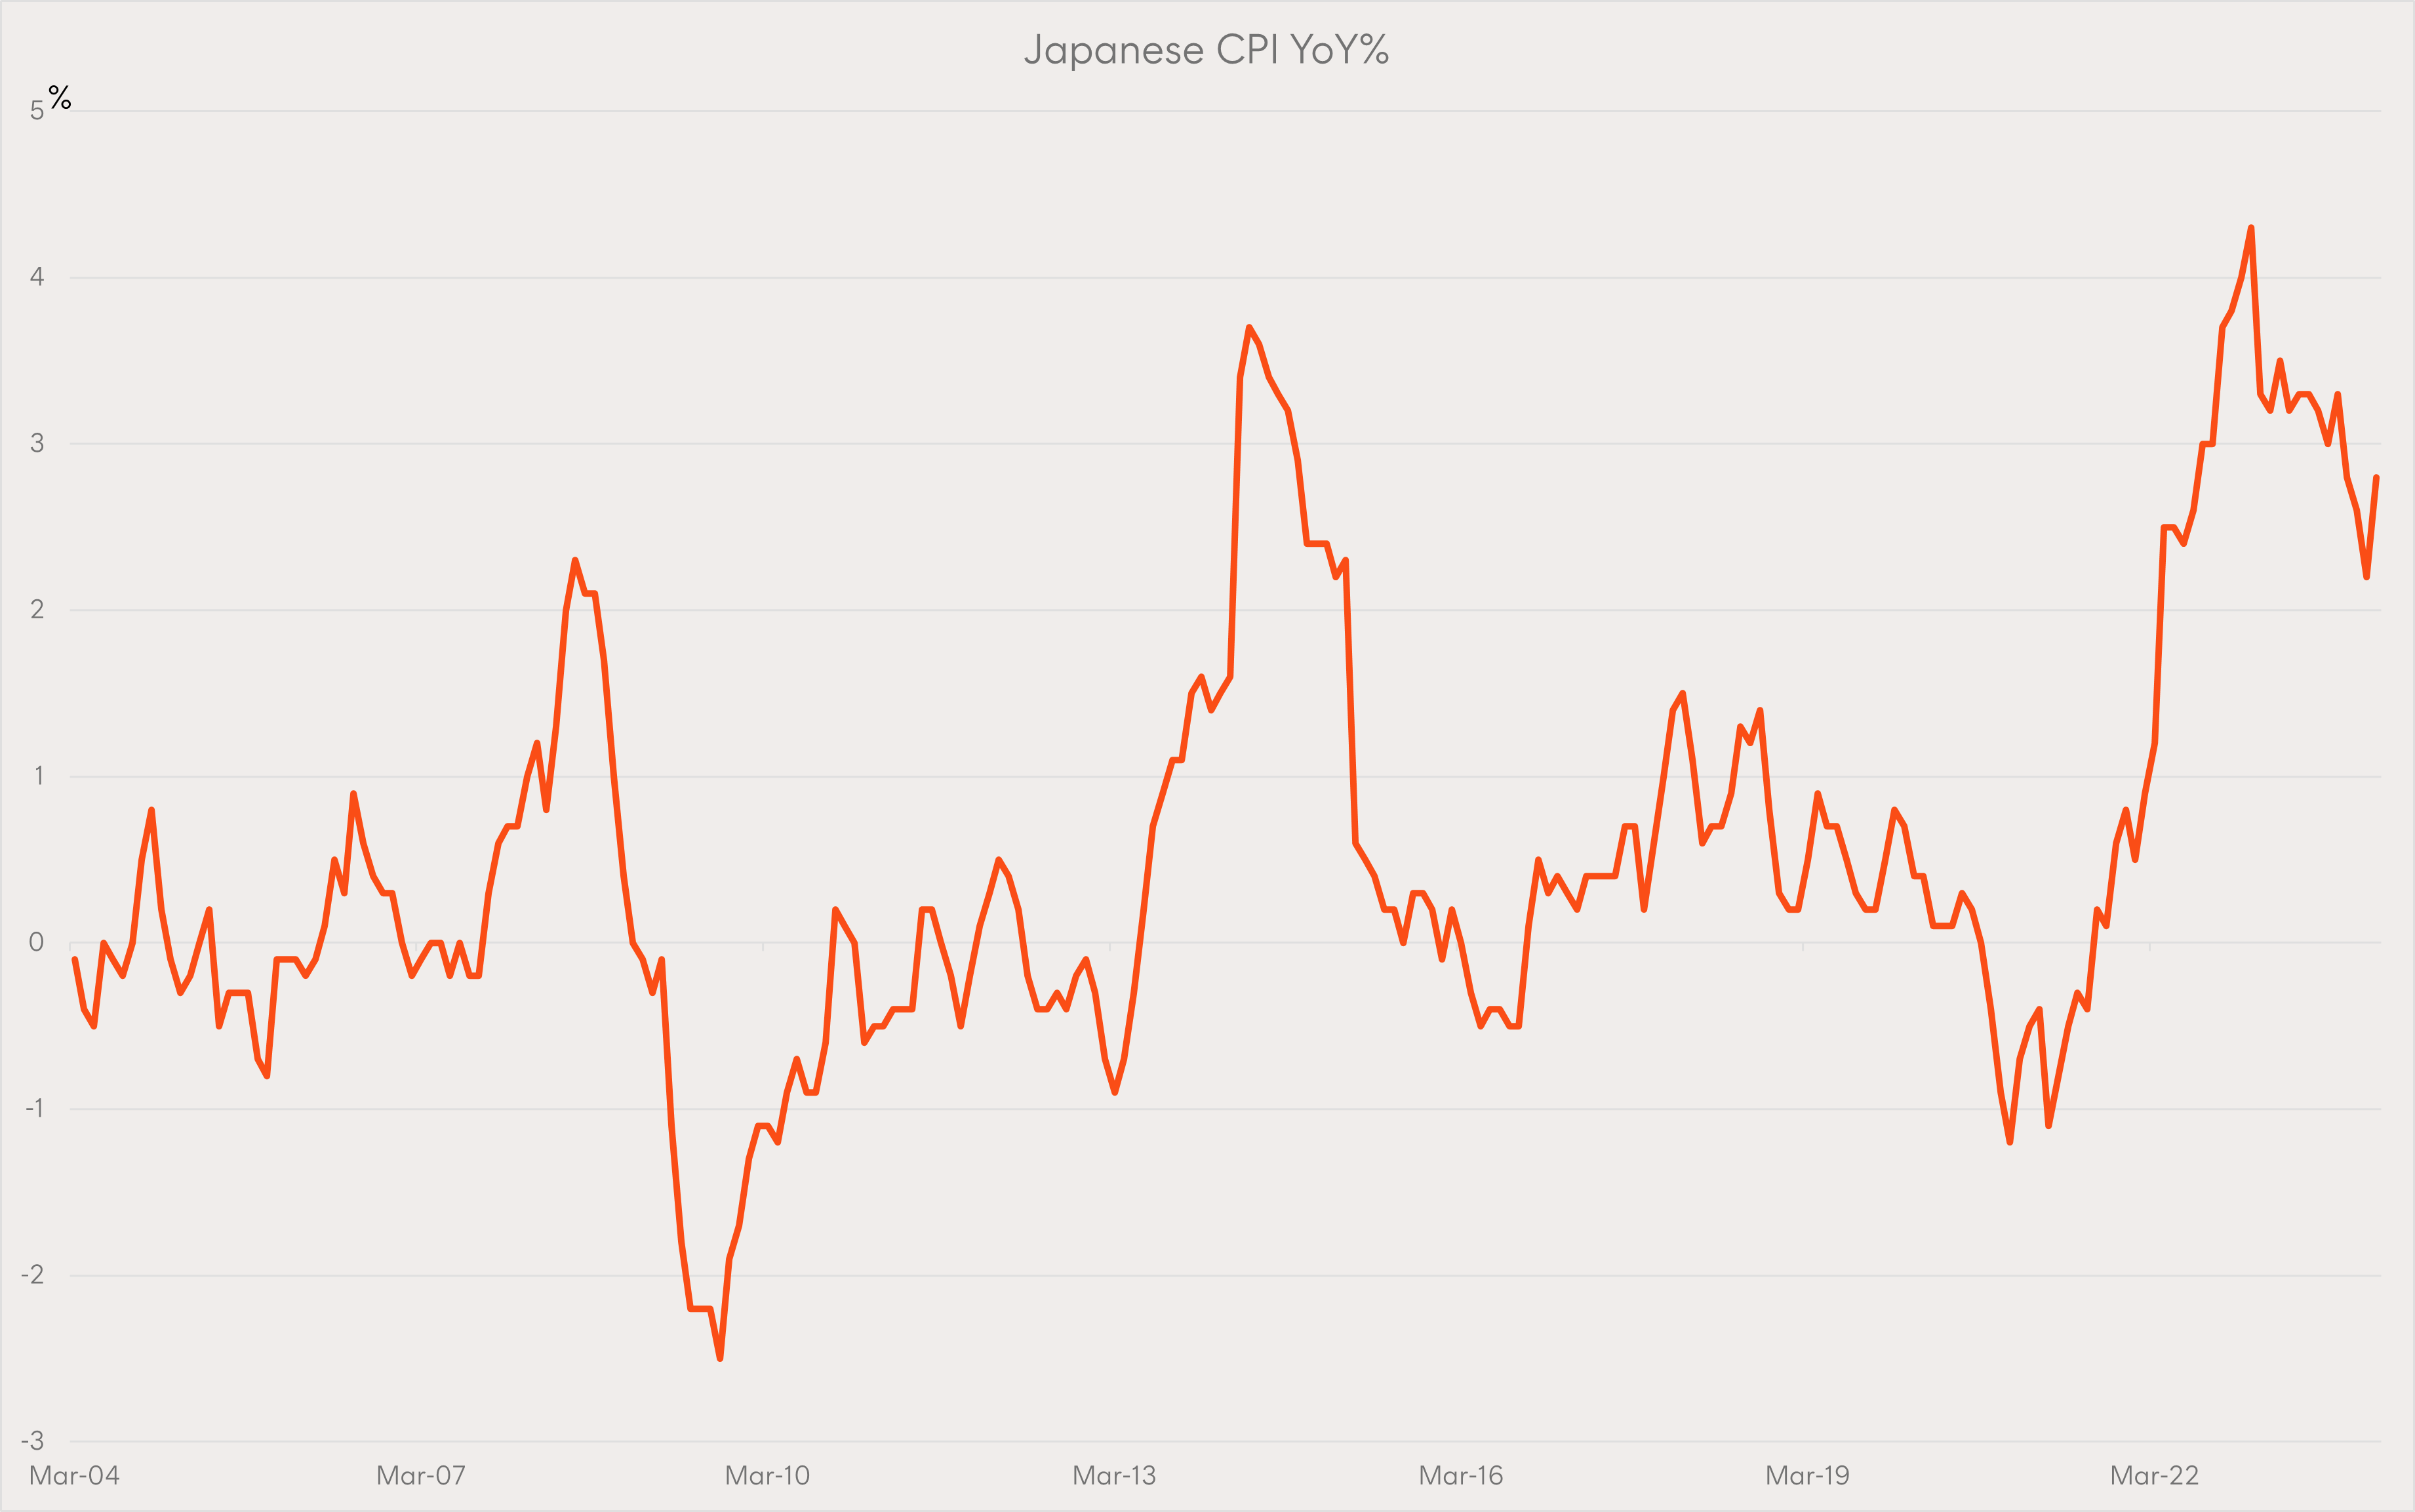
Source: LSEG Datastream/Betashares. As at 15 February 2024.
As it turns out, Taylor may not be the biggest pop artist in the world
In this month’s ‘just for fun’ chart, we were surprised to learn that despite all the hype about Taylor Swift following her recent tour, she is arguably not the biggest pop artist in the world right now.
Using YouTube views as a proxy, given its global reach and free use, K-Pop group BTS has racked up more views than any Western artist, Taylor Swift included. Perhaps more surprising though (to this author at least, who is not an avid follower of the latest trends in pop music), Puerto Rican rapper Bad Bunny managed to trump even the K-Pop superstars, racking up over 32 billion views on the platform. He also holds the crown for the most tracks with over 1 billion views, with 14 of his songs reaching the 10-figure mark.
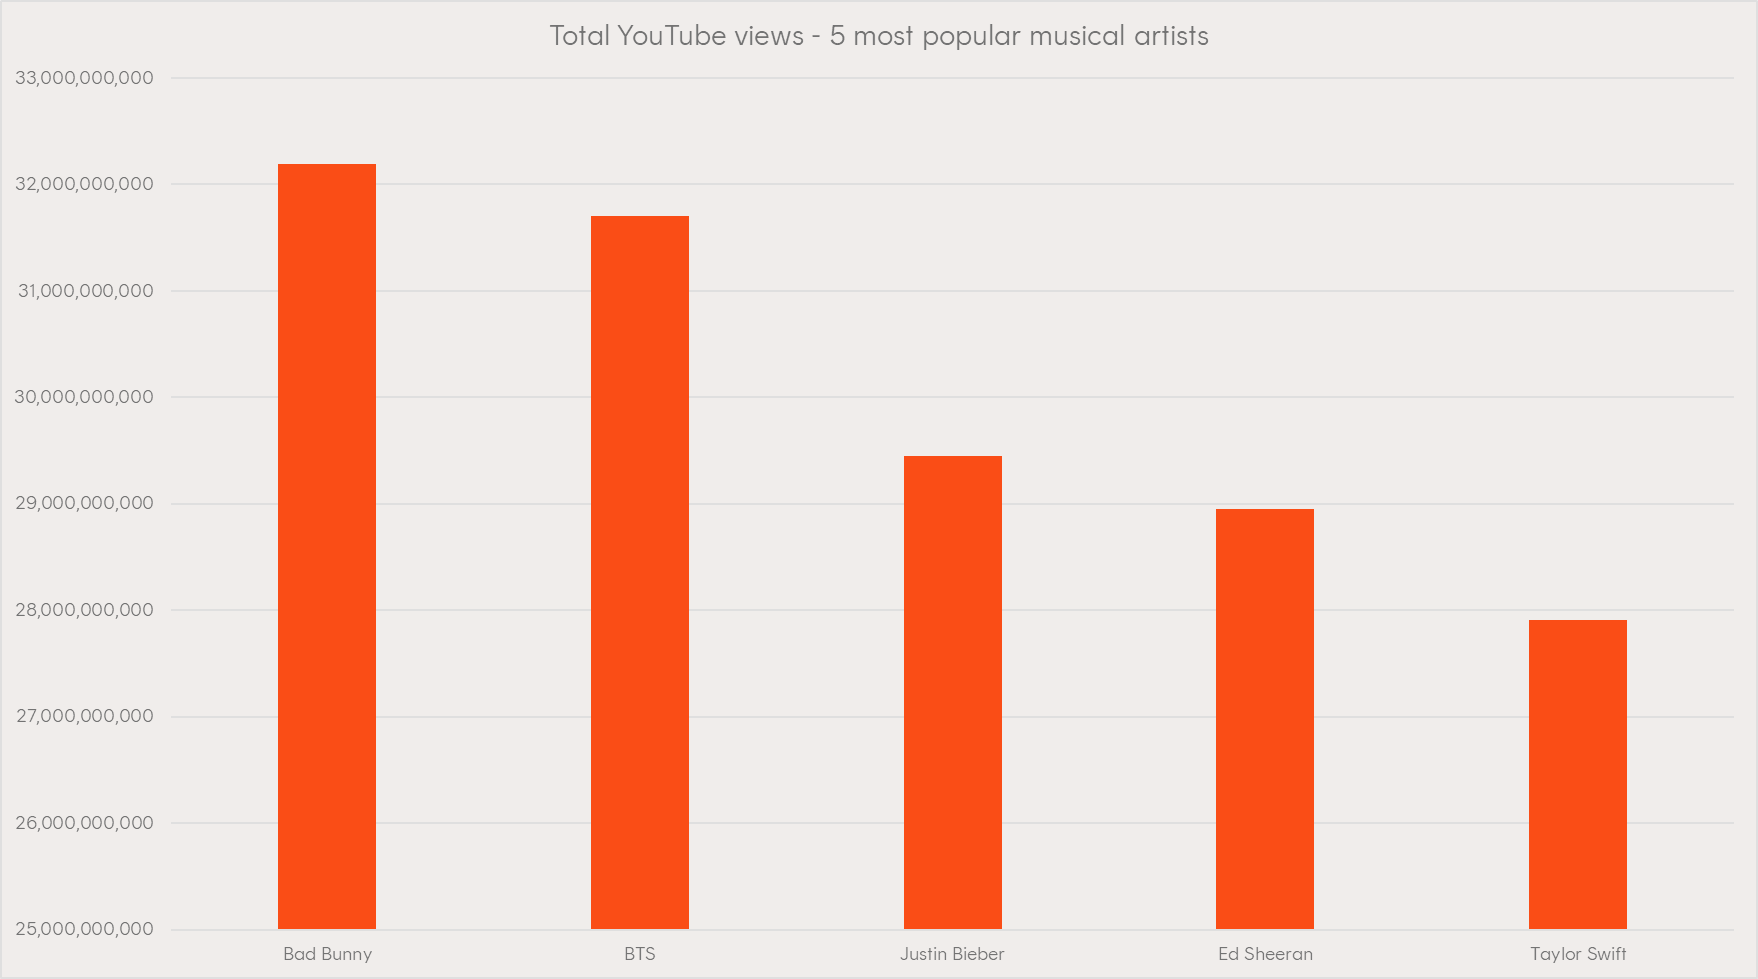
Source: Kworb.net, Betashares. As at 22 March 2024.
That’s it for Charts of the Month in March, but we’ll be back with more interesting (and fun) charts at the end of next month.