Betashares Australian ETF Review: May 2026

Ilan Israelstam
3 minutes reading time
Related articles

Better investing starts here
Get Betashares Direct
Betashares Direct is the new investing platform designed to help you build wealth, your way.
Scan the code to download.
Learn more
Learn more
Industry reaches fresh new high with international equities all the rage
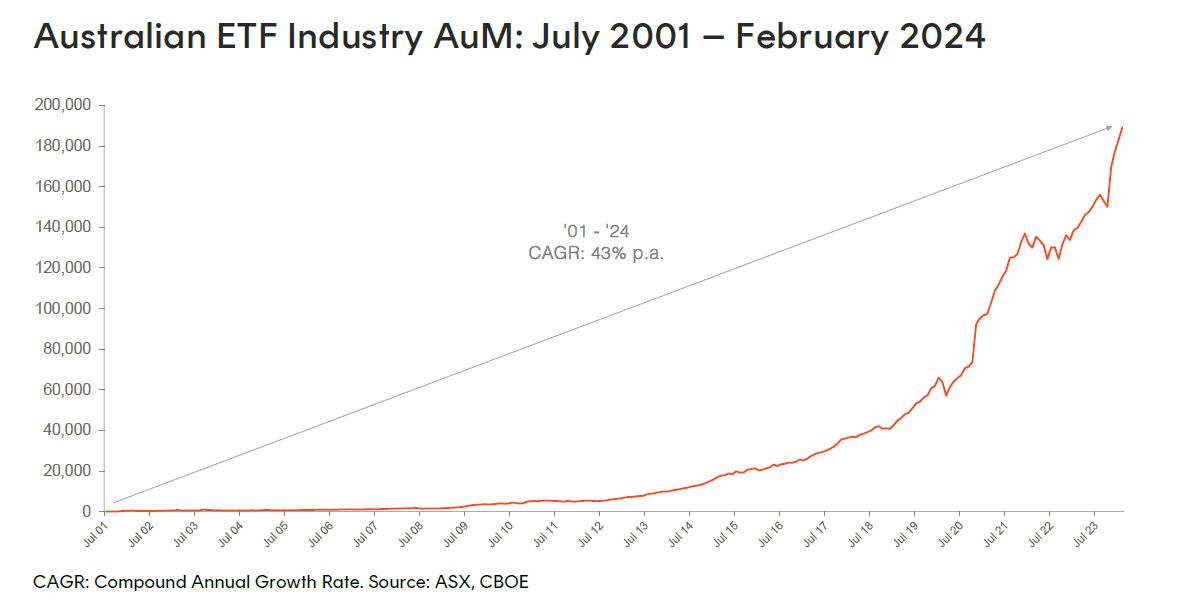
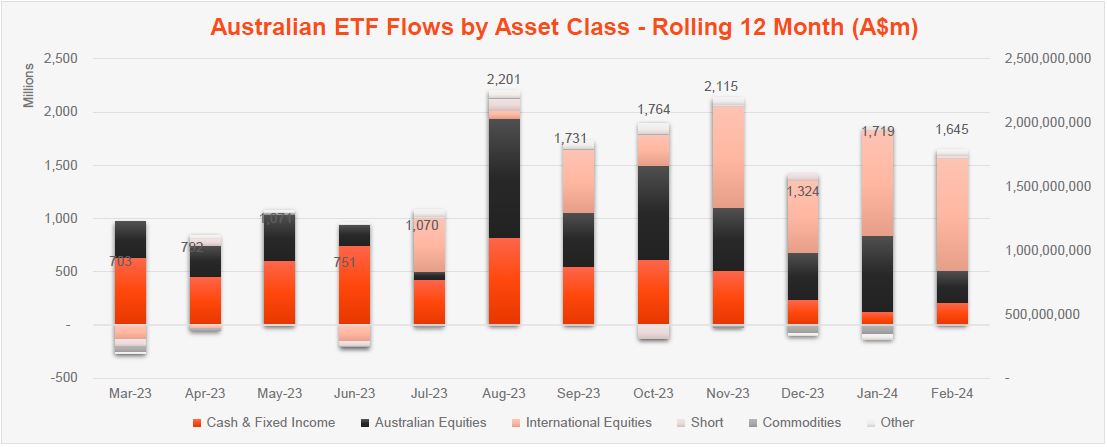
- The Australian ETF industry hit a new all-time high in assets under management in February with industry growth driven by a combination of asset value appreciation and investor net inflows.
- February saw assets grow 3.4% month-on-month, for a total monthly market cap increase of $6.3B, with the industry reaching a new all-time high of $189.4B.
- Net inflows for the month were $1.6B, representing ~25% of the industry’s growth in February.
- As the holiday period came to a close, we saw trading value rise a full 24% month on month in February, with ASX trading value of ~$10B for the month.
Exchanged Traded Funds Market cap
- Australian Exchange Traded Funds Market Cap (ASX + CBOE): $189.4B – New all-time high
- ASX CHESS Market Cap: $161.4B1
- Market Cap increase for month: 3.4%, $6.3B
- Market cap growth for last 12 months: 35.5%, $49.6B
Net Flows
- Net flows for the month: $1.6B
New Products
- 359 Exchange Traded Products trading on the ASX & CBOE
- A big month of new launches with 11 new funds launched. This included two new Nasdaq variants by Betashares (JNDQ and QNDQ), 5 new factors funds launched by iShares on CBOE along with 4 other funds by other issuers.
- Due to the closure of the single bond ETF oriented issuer XTB, all of their remaining exposures (19) were delisted from the ASX and CBOE.
Trading value
- Trading value rose by 24% in February, with ASX trading value of ~$10B for the month
Performance
- The best performing ETFs were overwhelming crypto focused products, with both Ethereum (+51%), Bitcoin (47%) and crypto oriented equities (35%) rising strongly post the approval of US-listed Bitcoin ETFs.
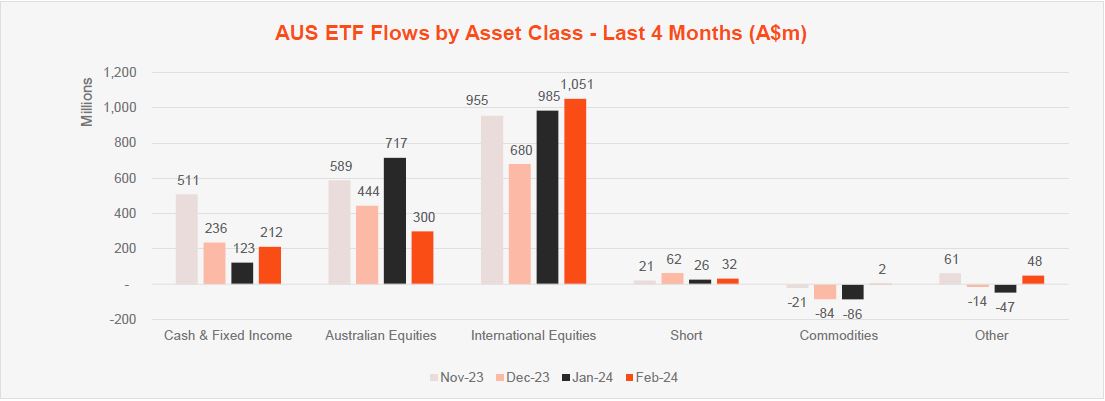
Top 5 category inflows (by $)
| Broad Category | Inflow Value |
| International Equities | $1,051,299,196 |
| Fixed Income | $309,465,791 |
| Australian Equities | $299,787,097 |
| Short | $31,784,476 |
| Multi-Asset | $25,810,949 |
Top category outflows (by $)
| Broad Category | Inflow Value |
| Cash | ($97,915,444) |
Top sub-category inflows (by $)
| Sub-category | Inflow Value |
| International Equities – Developed World | $583,157,637 |
| International Equities – US | $294,898,658 |
| Australian Equities – Broad | $237,350,917 |
| Australian Bonds | $225,015,723 |
| International Equities – E&R – ESG Lite | $150,592,293 |
Top sub-category outflows (by $)
| Sub-category | Inflow Value |
| Cash | ($97,915,444) |
| International Equities – Europe | ($73,883,456) |
| International Equities – E&R – Sustainability | ($33,863,355) |
| Australian Equities – Sector | ($33,428,416) |
| International Equities – E&R – Ethical | ($17,740,478) |
Top Performing Products – 2023
| Ticker | Product Name | Performance |
| EETH | Global X 21Shares Ethereum ETF | 51.1% |
| EBTC | Global X 21Shares Bitcoin ETF | 46.9% |
| CRYP | Betashares Crypto Innovators ETF | 34.9% |
| MCCL | Munro Climate Change Leaders Fund (Managed Fund) | 21.3% |
| CURE | Global X S&P Biotech ETF | 14.2% |
Footnotes:
1. Since February 2023, the ASX started reporting additional data on a CHESS-only basis. The primary use of such data is that it will exclude, amongst other things, the FuM and Flows in ‘dual class’ Active ETFs and potentially provide a more accurate picture of exchange traded activity.
Explore
ETF industry