
July 2022: INDUSTRY RETURNS TO GROWTH, HIGHEST FLOWS IN 9 MONTHS
Following 3 months of market declines, the Australian ETF Industry returned to its growth trajectory in July, assisted by the strongest net inflows in 9 months. Read on for details, including best performers, asset flow categories and more.
Market cap
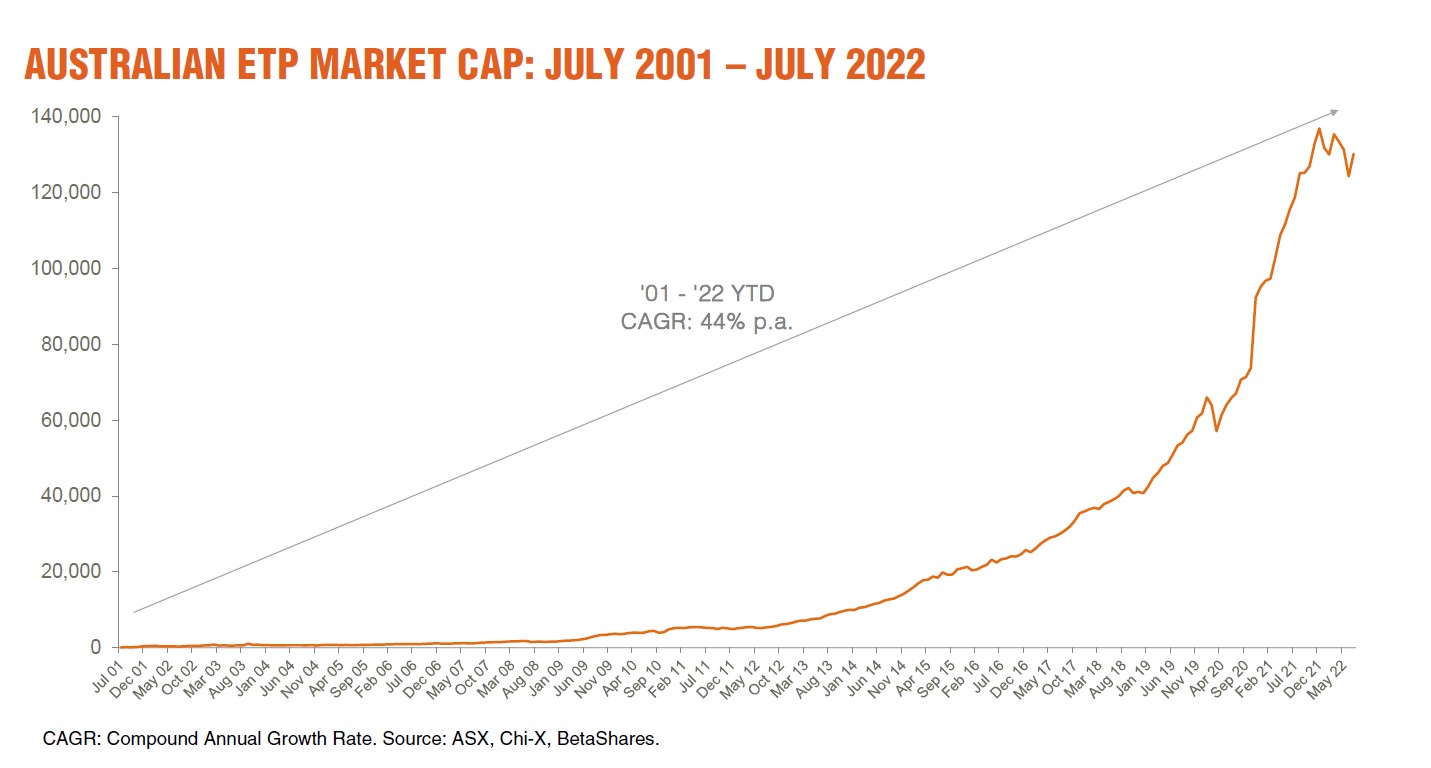
- Australian Exchange Traded Funds Market Cap: $130.2B
- Market cap increase for month: 4.8%, $5.9B
- Market cap growth for the last 12 months: 9.7%, + $11.5B
Comment: Industry AuM grew 4.8% ($5.9B) month on month, ending July at $130.2B
New money
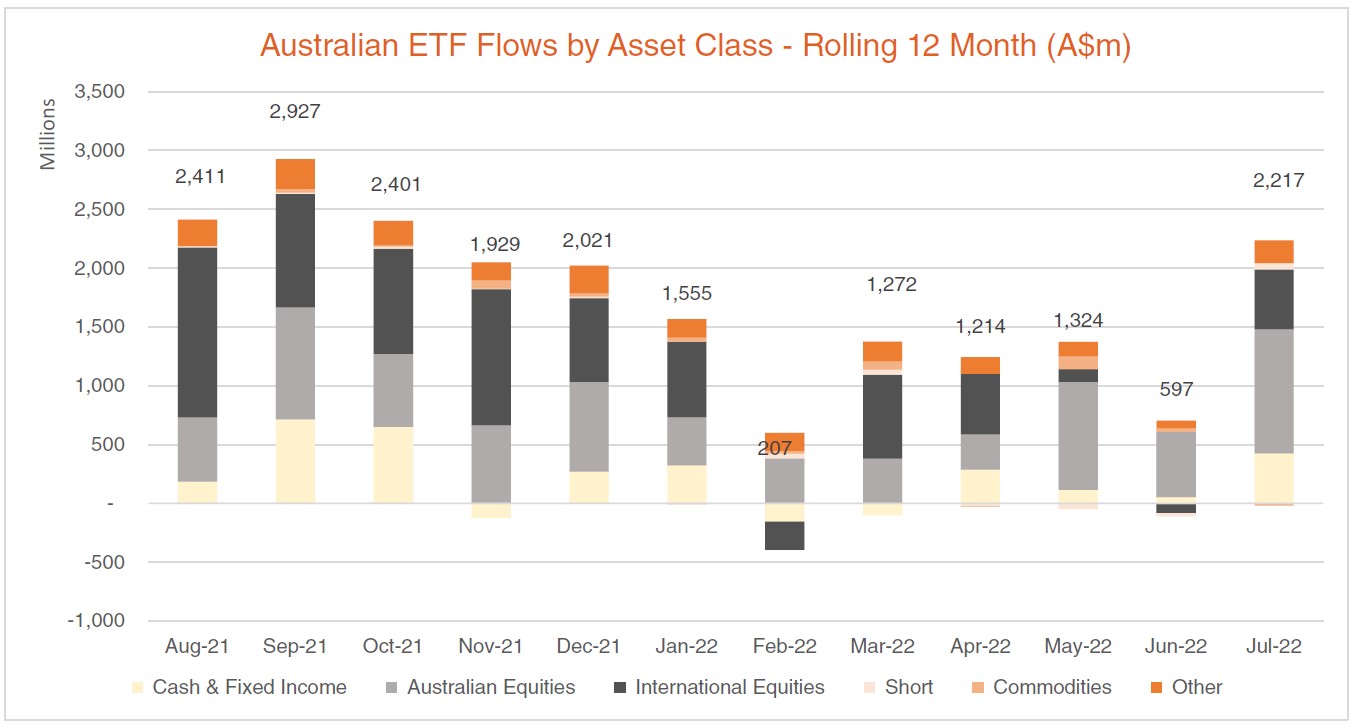
- Net flows for month: +$2.2B
Comment: Approximately 40% of the industry growth came from strong net flows this month, with net inflows of $2.2B, the highest level of the last 9 months. Notably, particularly in light of all the volatility we have seen in sharemarkets in recent times, the Australian ETF Industry has not had a single month of net outflows over the last 10 years.
Products
- 300 Exchange Traded Products trading on the ASX.
- 2 new products launched – new US-focused bond products from ETF Securities
- 2 products closed this month, including Magellan’s FPAY retirement product and Vanguard’s Active Global Multi-Factor ETF. 1 single bond product matured.
Comment: 2 products were closed this month. Magellan closed its FPAY retirement-oriented product just over a year after launch, which had ~$20m in assets. We also saw Vanguard shutter its Global Active Multi-Factor ETF, which had ~$30m in assets.
Trading value
- ASX ETF trading value decreased 19% month on month.
Performance
- This month we saw crypto-related exposures bounce significantly after months of large falls. For example, our Crypto Innovators ETF (ASX: CRYP) returned 40% for the month.
Comment: Industry growth over the last 12 months has been 18%, or a total of $19.6B.
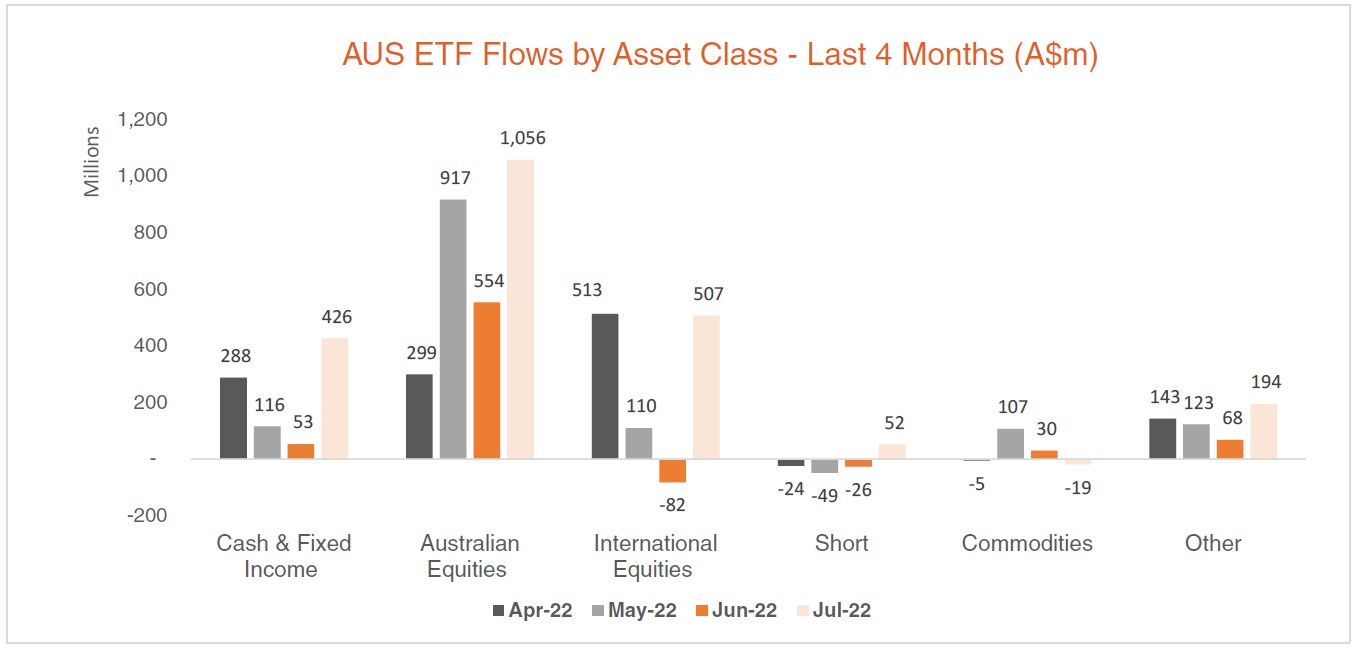
Top 5 Category inflows (by $) – July 2022
| Category | Inflow Value |
| Australian Equities | $1,056,292,104 |
| International Equities | $506,985,897 |
| Fixed Income | $336,739,977 |
| Listed Property | $109,400,842 |
| Cash | $89,688,618 |
Comment: In terms of category flows, the industry flows remained focused on equities, and with Australian equities in particular, which took in ~$1B of net flows, followed by international equities.
Top Category outflows (by $) – July 2022
| Category | Inflow Value |
| Commodities | ($18,546,243) |
| Currency | ($3,117,815) |
Comment: Outflows were subdued in almost all categories this month, with Gold exposures receiving the highest amount of net outflows.
Source: Bloomberg, BetaShares.
Top Sub-Category inflows (by $) – July 2022
| Sub-Category | Inflow Value |
| Australian Equities – Broad | $858,825,823 |
| Australian Bonds | $298,433,286 |
| International Equities – Developed World | $197,510,825 |
| International Equities – US | $118,795,126 |
| Cash | $89,688,618 |
Top Sub-Category outflows (by $) – July 2022
| Sub-Category | Inflow Value |
| Gold | ($24,417,886) |
| Currency | ($3,117,815) |
| Australian Equities – Sector | ($1,911,731) |
Investor & founder with a Financial Services & Fintech focus. Co-founder of Betashares. Passionate about entrepreneurship and startups.
Read more from Ilan.