
Richard Montgomery
Senior Content Manager - Richard Montgomery brings over 25 years of financial expertise to Betashares, where he steers investor communication. Prior to joining Betashares, Richard worked as a communications consultant for various financial institutions, including the Australian Securities Exchange (ASX).
17 minutes reading time
This information is for wholesale client use only.
The launch of the first index funds in the 1970s and Exchange Traded Funds (ETFs) in the 1990s made low-cost passive investing accessible to the average investor. By far the most popular form of passive investment benchmarks are those where constituent stocks are weighted according to their size (market capitalisation). Some of the most well-known indices, such as the S&P 500 Index and the S&P/ASX 200 Index, are examples of such a
weighting methodology.
Critics of market capitalisation-weighted indices highlight the fact that investors using such indices ultimately buy more of the overpriced stocks and less of the underpriced. The rise of ‘smart beta’ investing provided an alternative approach to passive investing. Smart beta refers to passive, rules-based strategies that seek to weight indices by something other than market capitalisation, often by targeting a specific factor (e.g. Value, Size or Momentum). The ultimate objective of smart beta is therefore either to enhance returns relative to a standard benchmark, or to reduce the risk (or a combination of these two objectives). In this way smart beta offers the dual benefit of the potential outperformance that comes from active management, but within a transparent, passive framework at lower fees.
Introducing the S&P 500 Equal Weight Index
In January 2003, S&P Dow Jones Indices (S&P DJI) launched the world’s first equal-weight index, the S&P 500 Equal Weight Index. Given that stocks are not weighted purely by their market capitalisation, equal weighting is a
form of smart beta, albeit not one that targets a specific factor.
The S&P 500 Equal Weight Index includes the same constituents as the market capitalisation-weighted S&P 500 Index, but each company in the S&P 500 Equal Weight Index is allocated an equal portfolio weight of 0.20% (1/500) of the index total at each quarterly rebalance. The table below shows a comparison of the weight for the top 10 holdings for the S&P 500 and S&P 500 Equal Weight Indices as at 30 November 2020:
Table 1: Top 10 holdings by % weight
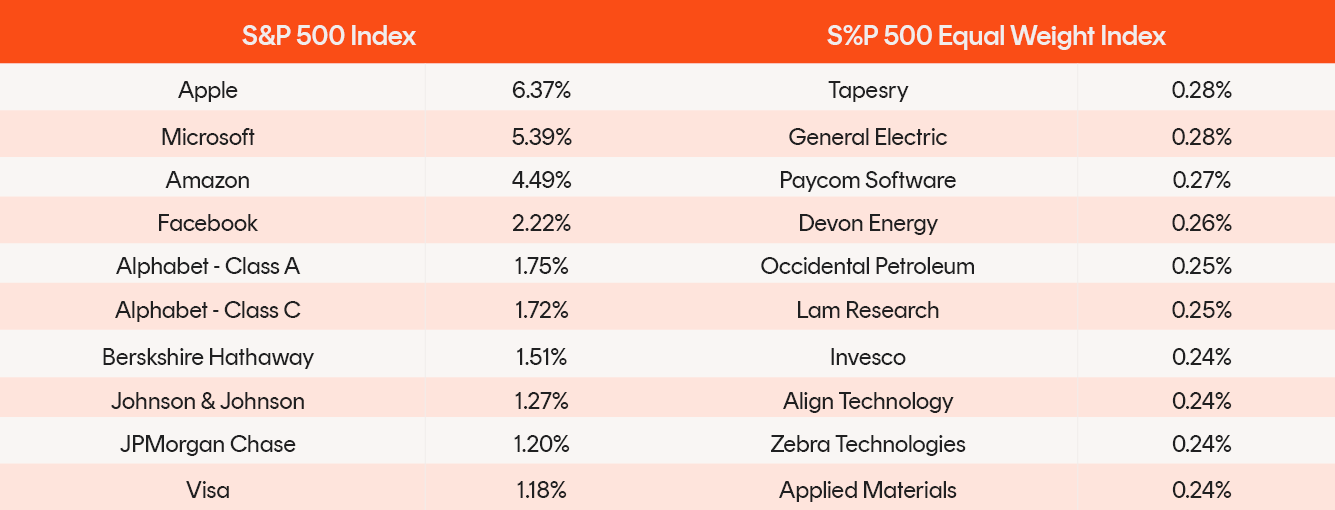
Source: S&P Dow Jones Indices, Betashares.
The names on the left of Table 1 will be familiar to investors, whereas one cannot necessarily say the same for the top names on the right. The important point is this – the top stocks for the equal weight index will change frequently given that all stocks start from the same weight on rebalance, and therefore stocks such as Apple and Microsoft will have a similar weight to the smallest market capitalisation stock in the index (uniform distribution).
Chart 1: Distribution by weight
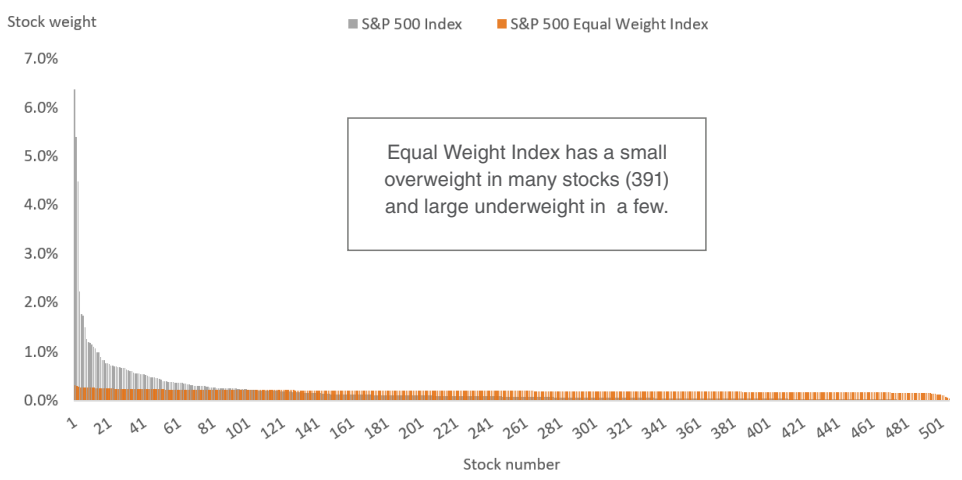
Source: S&P Dow Jones Indices, Betashares, data as at 30 November 2020
Performance of Equal Weight
Whilst not targeting any specific investment factor, indices based on equal weight have produced long-term outperformance relative to their market cap-weighted equivalents. In the case of the S&P 500 Indices, the
outperformance over the past 20 years has been +2.17% p.a. This is remarkable considering the simplicity of equal weight and the depth of analyst research coverage of stocks within the S&P 500 Index, a market which
would be considered highly efficient. However, the outperformance of equal weight over the long term has not been confined to the U.S. and has also been evident in many other regions and countries1.
Chart 2: Performance
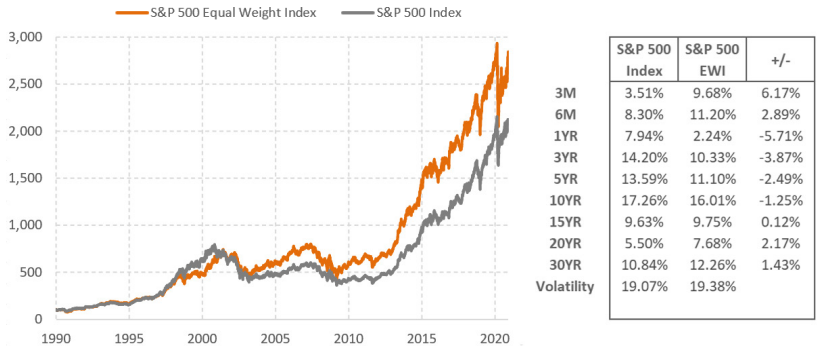
Source: Bloomberg, Betashares. Data as at 30 November 2020 and in AUD. You cannot invest directly in an index. Index performance does not take into account ETF fees and costs. Past performance is not an indicator of future performance of any ETF or index
If we consider shorter holding periods, we can more clearly see the periods of under or outperformance by the Equal Weight Index. The chart below shows the rolling 3-year relative returns since 1993, and whilst there have
been periods of equal weight underperformance (including the most recent period), equal weight has outperformed the majority of the time (62%). What is also evident is the magnitude of the excess returns over such holding
periods, even though both indices comprise the same stocks.
Chart 3: Rolling 3-year relative returns (S&P 500 EWI – S&P 500 Index)
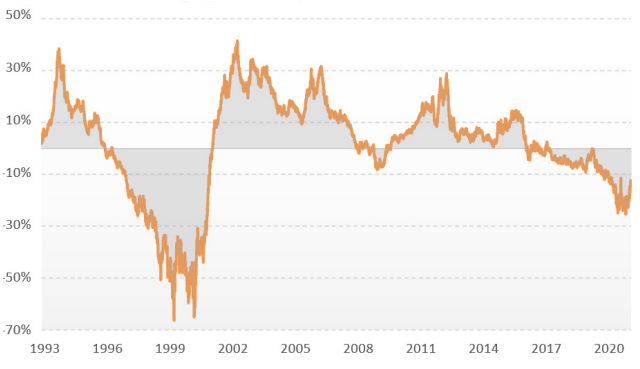
Source: Bloomberg, Betashares. Data as at 30 November 2020 and in AUD. You cannot invest directly in an index. Index performance does not take into account ETF fees and costs. Past performance is not an indicator of future performance of any ETF or index.
What has driven the long-term outperformance of the S&P 500 Equal Weight Index?
As mentioned previously, equal weighting by itself does not provide targeted exposure to any specific risk factor. In fact, equal weighting by definition implies that each constituent has the same expected return and volatility. Given the simplicity of equal weighting, the question then becomes, what have been the potential drivers of this outperformance?
1. Stock Return Skew
Most investors are aware that the most they can lose owning a stock is 100%. However, not many are aware of the implications for stock selection given that upside performance is not limited and often extends well beyond
positive 100% returns. Empirical evidence finds that the majority of returns within an index are clustered at the lower end of the return distribution, and that a smaller subset of stocks typically delivers very large positive returns2. This means that the average return will generally be greater than the median return. In statistical terms this means that stock returns are not normally distributed, but rather display a positive skew3. Returns from the S&P 500 Index have been positively skewed in 25 out of the last 29 years and the existence of the skew is not limited to the U.S.4.
Chart 4: Stock return skew in S&P 500 Index
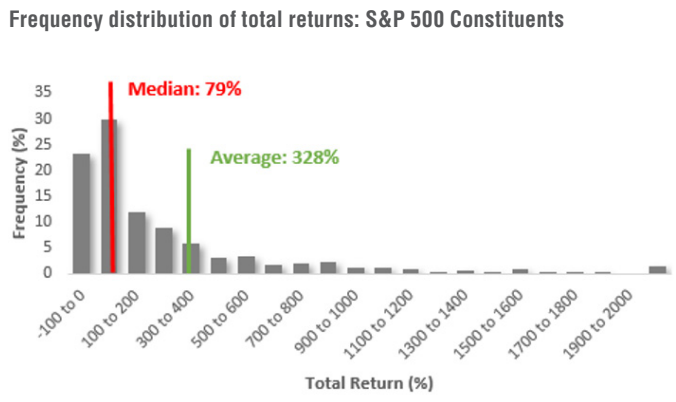
Source: S&P Dow Jones Indices, Factsheet, March 2003 to October 2020
The relevance and implication for equal weighting is significant and helps explain not only the historical tendency for equal weight to outperform market capitalisation, but also the persistent underperformance by active managers in general.
Given that the average return is higher than the median return, it means that more than half the stocks deliver a return below the average. Active managers with more concentrated portfolios therefore have a lower probability of picking above average performers. On the other hand, equal weight indices such as the S&P 500 Equal Weight Index, where 391 out of the 500 stocks have a higher weighting than the equivalent market capitalisation index, have a higher probability of an overweight position in the smaller subset of stocks with outsized returns.
Chart 5 below confirms that these stocks with above average returns have added more returns to the S&P 500 Equal Weight Index than to the S&P 500 Index.
Chart 5: Above-average stock contribution to index returns
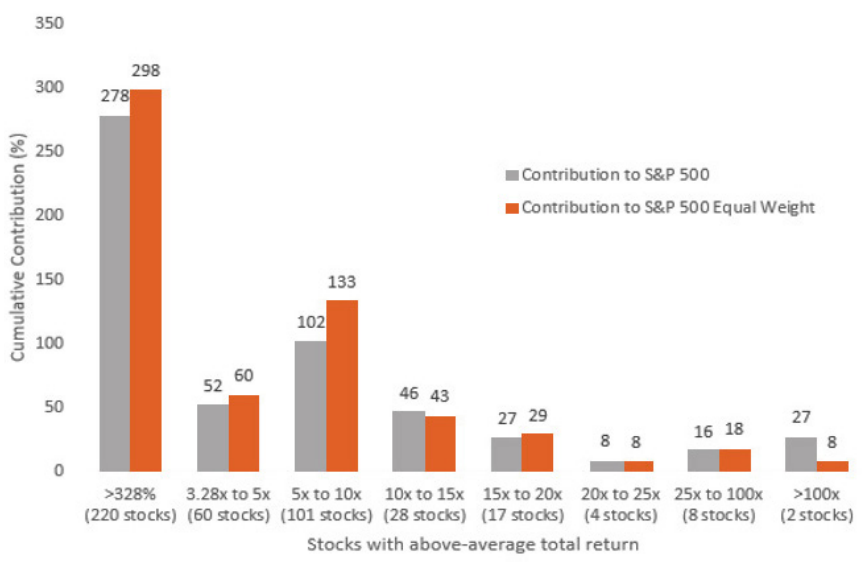
Source: S&P Dow Jones Indices, Factsheet, March 2003 to October 2020
2. Rebalancing Impact
Smart beta indices must be rebalanced regularly to a specific target weight that by definition is not market capitalisation weighted. For the S&P 500 Equal Weight Index this means that quarterly, each stock will simply
be rebalanced to have the same weight, which means that stocks that have risen in value are sold and stocks that have fallen in value are bought. This systematic “buy low sell high” rebalancing strategy has tended to be
value accretive over time, especially during times of mean reversion5.
Momentum strategies, on the hand, do exactly the opposite. Winners are generally added and losers are sold. It is for this reason that equal weight strategies have tended to display negative-momentum properties.
3. Size Impact
The size premium refers to the empirical evidence that smaller companies have tended to outperform larger capitalisation stocks over the long run. Banz was the first to highlight the superior risk adjusted returns of
smaller capitalisation stocks relative to large capitalisation stocks6. However, the landmark research by economists Eugene Fama and Kenneth French created the backdrop for the future attention to the size
premium after showing that size, along with value and market beta, explains a significant part of the crosssectional variation in stock returns7 . Various explanations have been put forward as to why smaller size
companies outperform over the longer term, including lower liquidity premium, greater sensitivity to macro factors, higher default risk, or even greater awareness of benchmark returns which may lead institutional
investors to only focus on larger cap names.
The size factor can of course be specifically targeted in the portfolio construction process by overweighting smaller sized companies and underweighting larger capitalisation stocks. However, another way to achieve a smaller size bias is simply to equal weight stocks. Chart 1 diagrammatically shows how this is achieved – equal weight significantly underweights the largest stocks in the S&P 500 Index, whilst at the same time overweighting a large number of the smaller constituents.
One can also view the equal weight outcome in terms of the average index weighted market capitalisation. Chart 6 compares the index weighted market capitalisation for the S&P 500 Index, the S&P 500 Equal Weight Index, and the S&P MidCap 400 Index. Despite the S&P 500 Equal Weight Index consisting of the same stocks as the S&P 500 Index, its index weighted market capitalisation is much closer to that of the S&P MidCap 400 Index.
Chart 6: Index weighted market capitalisation ($ million)
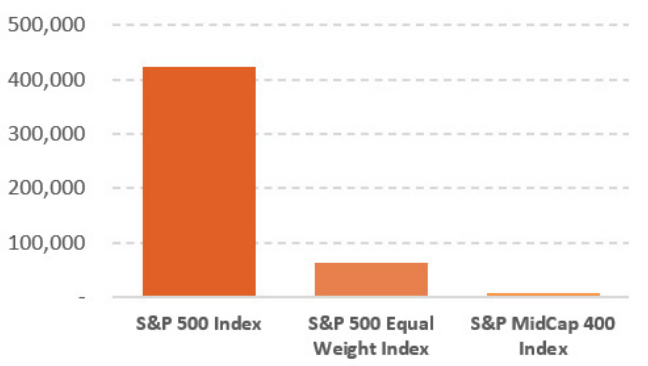
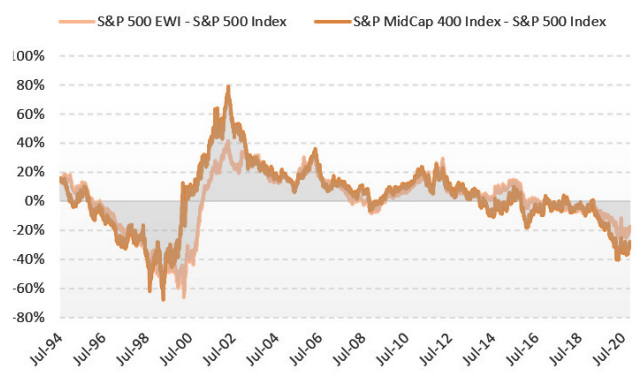
Chart 7: Rolling 3-year return comparison
Source: Bloomberg, Betashares. Performance data as at 30 November 2020 and in AUD. You cannot invest directly in an index. Index performance does not take into account ETF fees and costs. Past performance is not an indicator of future performance of any ETF or index.
Chart 7 shows the same information as presented in Chart 3 above, namely the rolling 3-year excess returns between the S&P 500 Equal Weight Index and the S&P 500 Index, but in this chart we also overlay the same
rolling relative returns between the S&P MidCap 400 Index and the S&P 500 Index. It is clear the size impact is captured in the S&P 500 Equal Weight Index, and statistical analyses consistently show that after market
beta, size explains the largest residual component of excess returns in equal weight. This also explains why equal weight has tended to exhibit slightly higher volatility than market capitalisation indices.
Over the last two years, larger companies have outperformed strongly against a global backdrop of lower economic activity and greater uncertainty regarding the growth outlook. Smaller companies tend to be more
cyclical in nature and the relative performance may well mean-revert in the event of an increase in global economic activity.
4. Increased Diversification/Lower Concentration
Although still the most popular form of indexing, market capitalisation-weighted indices suffer from the drawback that a large portion of the returns and risk can be driven by a small subset of very large companies.
This will benefit the passive investor in times when these very large companies do particularly well and when momentum is strong. This is exactly what has occurred in recent times – the S&P 500 Index’s five largest
names are up significantly over the past two years to 30 November 2020 (Microsoft +97.99%, Apple +173.02%, Amazon +87.44%, Facebook +96.98%, and Alphabet +60.88%). The weighted average return of the remaining
stocks was only 24.91% over the same time period8. This of course helps explain the recent underperformance for both equal weight, given its large underweight position in these stocks, and size (as a factor) in general.
The stock concentration has also increased significantly of late and is now at the highest level since the 1960s when the top 5 stocks were AT&T, General Motors, Standard Oil, IBM and Texaco.
Chart 8: Concentration in S&P 500 Index
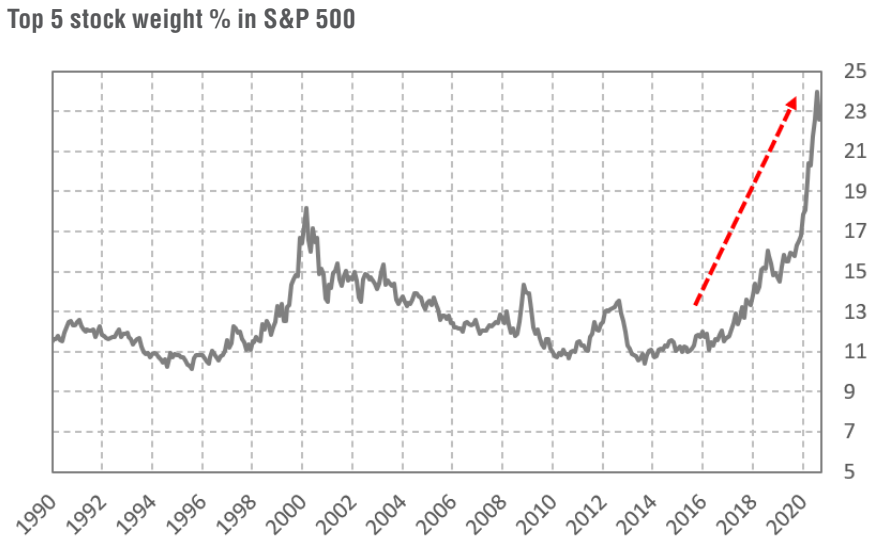
Source: Bloomberg, Betashares. Data as at 30 November 2020
If history is anything to go by, the current level of stock and sector concentration is unlikely to continue in its current form. Whether based on shorter-term reasons such as valuation reversals or longer-term structural
adjustments due to healthy competition in free markets or even regulatory/anti-competitive enforcement, the composition and level of concentration tends to change over time.
Equal weight by design is more diversified at a single stock weight level, and the associated sector weights have also shown greater diversification over time. Diversification is often said to be the only free lunch in
investing and on this basis alone makes equal weight a compelling consideration as a longer-term investment approach for U.S. equities.
Considering the rapid recent increase in concentration levels, strategies such as equal weight may benefit even more on a relative basis once the concentration profile changes – either due to shorter or longer-term drivers.
One way to measure concentration in portfolios is by way of the Herfindahl-Hirschman Index (HHI). The index level is calculated by adding the squared constituent weights9. A higher stock concentration will result in a higher HHI level. The chart below shows the historic HHI level for the S&P 500 Index and the corresponding 1-year forward excess return of the S&P 500 Equal Weight Index over the S&P 500 Index. Historically,
increases in concentration levels offered excess return opportunities. The build up to the dot-com bubble initially saw negative excess returns as concentration levels grew, but eventually reverted significantly following the crash in 2000. The most recent period also shows a significant divergence between increased stock concentration levels and forward returns.
Chart 9: Portfolio concentration and excess return potential
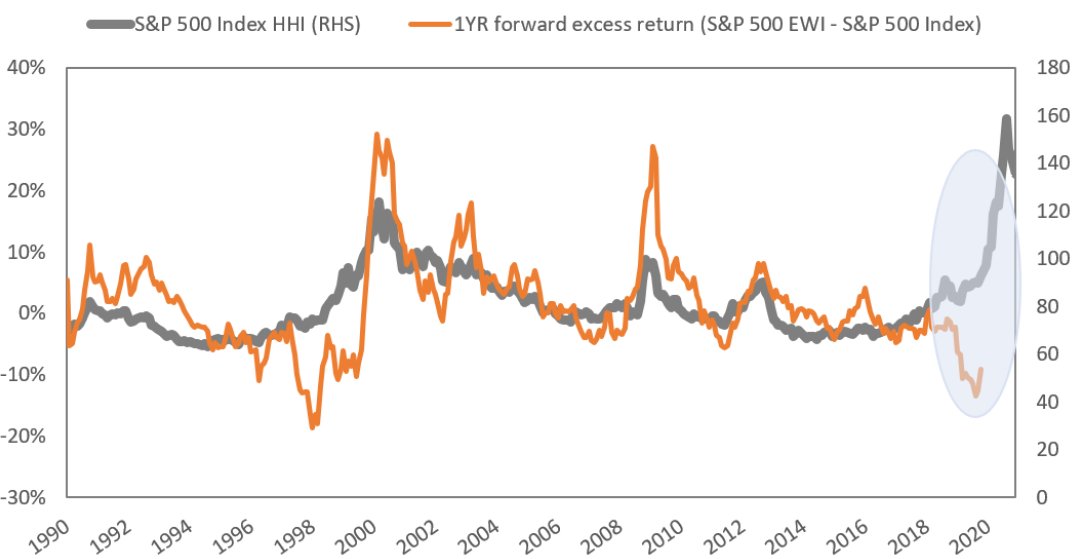
Source: Bloomberg, Betashares. Data as at 30 October 2020 in USD. You cannot invest directly in an index. Index performance does not take into account ETF fees and costs. Past performance is not an indicator of future performance of any ETF or index.
What do we know about sector diversification and the impact of equal weight?
Unlike a market capitalisation-weighted index, where the sector weight comprises the total market capitalisation for that sector, the sector weight for an equal weight index is represented by the total number of stocks in that sector. Therefore, equal weight indexing does not necessarily mean equal sector weights. From a diversification point of view, it is worthwhile noting that the S&P 500 Equal Weight Index’s sector weight distribution is more closely aligned with equally weighted sectors, and, on this basis, as well as the individual stock basis described above, is therefore considered more diversified than the market capitalisation equivalent
index.
Over time, equal weight sector weights also tend to avoid large increases in concentration – an issue that presents itself in market capitalisation weighting from time to time due to stocks within popular sectors
becoming more expensive. The diagram below shows a more consistent distribution of sector weights over time for the S&P 500 Equal Weight Index.
Chart 10: Sector weights over time
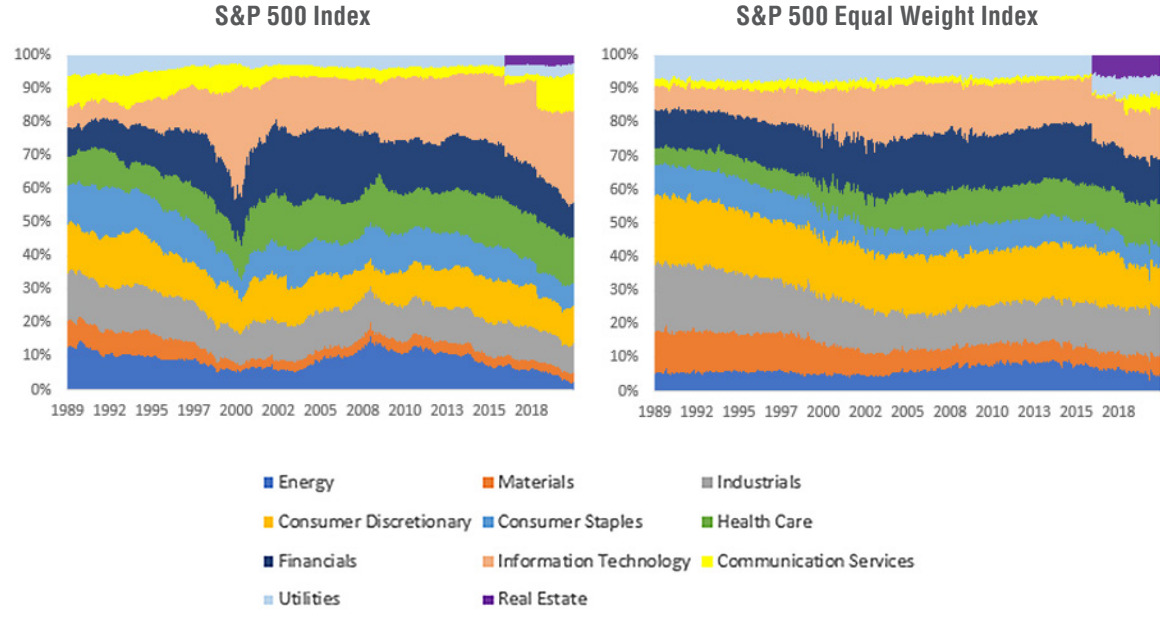
Source: S&P Dow Jones Indices, Betashares. Data as at 30 October 2020. Real Estate was added as a separate GICS sector in September 2016.
How can investors use equal weight within their portfolios?
1. Long term core allocation
The mean reversion impact of systematic rebalancing, greater portfolio diversification, favourable stock return skew properties, and constant exposure to the size factor, all have tended to benefit equal weight over market
capitalisation weighting over time and this is reflected in the long term outperformance in many regions and country specific exposures. The associated volatility is slightly higher (mainly due to the size impact), but so
are the overall risk adjusted returns over the long-term. Hence an investment linked to the S&P 500 Equal Weight Index, which still includes the 500 largest companies in the U.S., can represent a core allocation to U.S. equities.
2. Shorter/medium term tactical allocation
Historic analyses have shown that periods of equal weight underperformance, due to strong price momentum in particular segments of the market (and leading to increased stock and/or sector concentration levels), are unlikely to last, and the mean reversion profile offers attractive risk/return opportunities for equal weight exposures.
3. Blending complementary portfolio exposures
Even though equal weight has displayed attractive long-term excess returns, investors can also use the exposure’s risk/return characteristics as a complementary allocation to seek to improve an equity portfolio’s overall risk adjusted returns. Equal weight’s anti-momentum rebalancing characteristics and performance behaviour during up/down markets can complement other risk premia exposures such as momentum and low volatility, or even market capitalisation indices, due to their inherent momentum profile. It may also make sense to blend an equal weight exposure to portfolios with already large weightings to the largest U.S. stocks, particularly those in the technology sector, as a way to improve overall portfolio diversification.
Chart 11: Improved risk adjusted returns
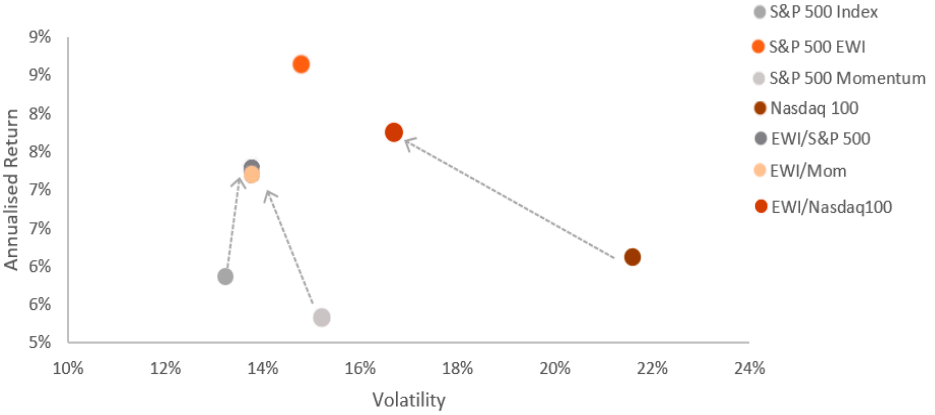
Source: Bloomberg, Betashares. Data from January 2000 to November 2020 and in AUD. Combined portfolio assumes 50% allocated to S&P 500 Equal Weight Index and rebalanced monthly. Provided for illustrative purposes only. Not a recommendation to adopt an investment strategy. Investors should seek financial advice before making an investment decision.
Conclusion
Whilst a very simple concept, the power of equal weighting has been demonstrated in long-term excess performance results against a number of country specific and regional market capitalisation weighted indices.
For this reason, equal weight remains one of the most popular alternatively weighted strategies.
Unlike other alternative indices, equal weighting takes an agnostic approach to factor exposure and has an inherent assumption of the same expected stock return or volatility for each security. Given this profile and the mean-reversion impact from systematically rebalancing, an equal weight exposure ultimately tends to benefit when markets reveal from time to time that they are not always efficient.
Notwithstanding the strong relative outperformance of the S&P 500 Equal Weight Index over the long-term, the recent performance has been underwhelming. It is unusual to get excited when short term performance has lagged, but when considering the backdrop of significant price appreciation and momentum in a narrow set of U.S. mega cap, sector-specific stocks, it is conceivable that an alternatively weighted strategy such as the S&P 500 Equal Weight Index will be very well-placed to outperform upon any mean reversion. Historic returns also confirm that excess returns have been significant upon such reversion events.
Betashares S&P 500 Equal Weight ETF trades under the ASX code ‘QUS’, and, like all ETFs, can be bought and sold like any share.
-
QUS
S&P 500 Equal Weight ETF
There are risks associated with an investment in QUS, including market risk, index methodology risk, country risk and currency risk. Investment value can go up and down. An investment in the Fund should only be considered as a part of a broader portfolio, taking into account your particular circumstances, including your tolerance for risk. For more information on risks and other features of the Fund, please see the Product Disclosure Statement and Target Market Determination, both available on this website.
Important: This information has been prepared by Betashares Capital Ltd (ABN 78 139 566 868 AFSL 341181) (Betashares), the issuer of the S&P 500 Equal Weight ETF (Fund). It is not a recommendation to buy units or adopt any particular investment strategy. You should make your own assessment of the suitability of this information. It is general information only and does not take into account any person’s particular circumstances. Before making an investment decision regarding the Fund, investors should consider the Product Disclosure Statement (PDS), available at www.betashares.com.au, and their circumstances and obtain financial advice. An investment in the Fund is subject to investment risk including possible delays in repayment and loss of income and principal invested.
Past performance is not an indication of future performance of any index or the Fund. Any opinions are subject to change without notice and actual events may differ materially from those reflected in any opinions or other forward-looking statements. To the extent permitted by law Betashares accepts no liability for any loss from reliance on this information.
“S&P” and “S&P 500 Equal Weight” are registered trademarks of Standard & Poor’s Financial Services LLC (S&P) and have been licensed for use by Betashares. QUS is not sponsored,
endorsed, sold or promoted by S&P or its respective affiliates, and none of such parties make any representation regarding the advisability of investing in QUS nor do they have any liability for any errors, omissions or interruptions of the Index.
Written by
Richard Montgomery
Senior Content Manager
Richard Montgomery brings over 25 years of financial expertise to Betashares, where he steers investor communication. Prior to joining Betashares, Richard worked as a communications consultant for various financial institutions, including the Australian Securities Exchange (ASX).
Read more from Richard.