
Cameron Gleeson
5 minutes reading time
With inflation falling and the bulk of interest rate hikes apparently behind us, the economy increasingly looks to be headed for that elusive ‘soft landing’. With this backdrop, many opportunities and risks no doubt await investors.
And what better way than charts to keep abreast of these opportunities and risks?
We asked six Betashares investment experts to nominate a chart that they think investors should be watching in the year ahead1.
No red flags from unemployment rate yet
Nominated by: David Bassanese, Chief Economist.
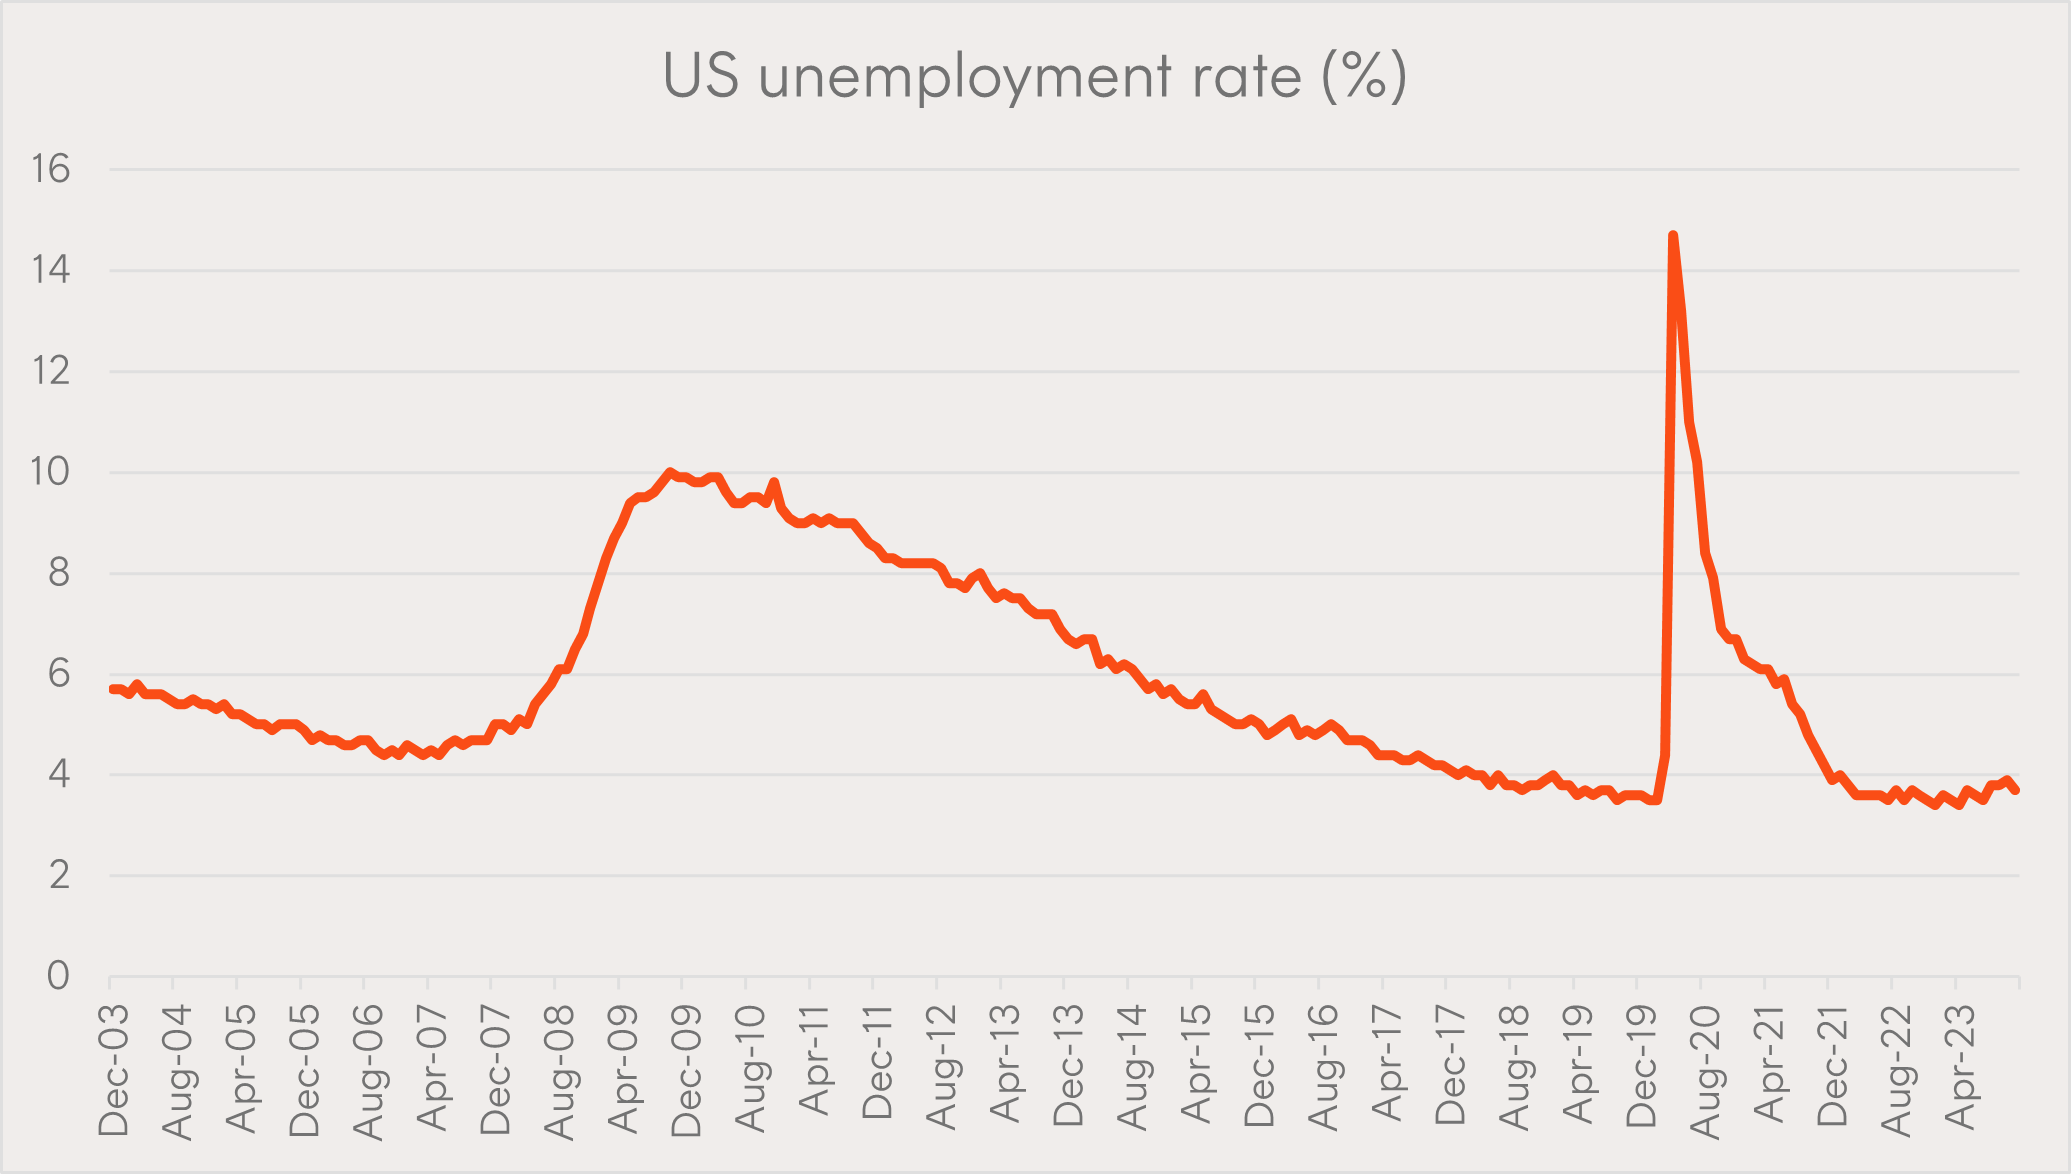
Source: US Bureau of Labor Statistics, Betashares. As at 31 December 2023.
Why it’s important: US unemployment effectively indicates whether the world’s largest economy is likely to go into or avoid a recession. Historically, the US economy has tipped into recession whenever the unemployment rate has lifted by more than 0.5% for a sustained period of three months or more. Despite aggressive US interest rate increases in the past year, the unemployment rate has so far drifted up only marginally and remains remarkably low.
Concentration is at historic levels: Could it mean-revert?
Nominated by: Louis Crous, Chief Investment Officer.
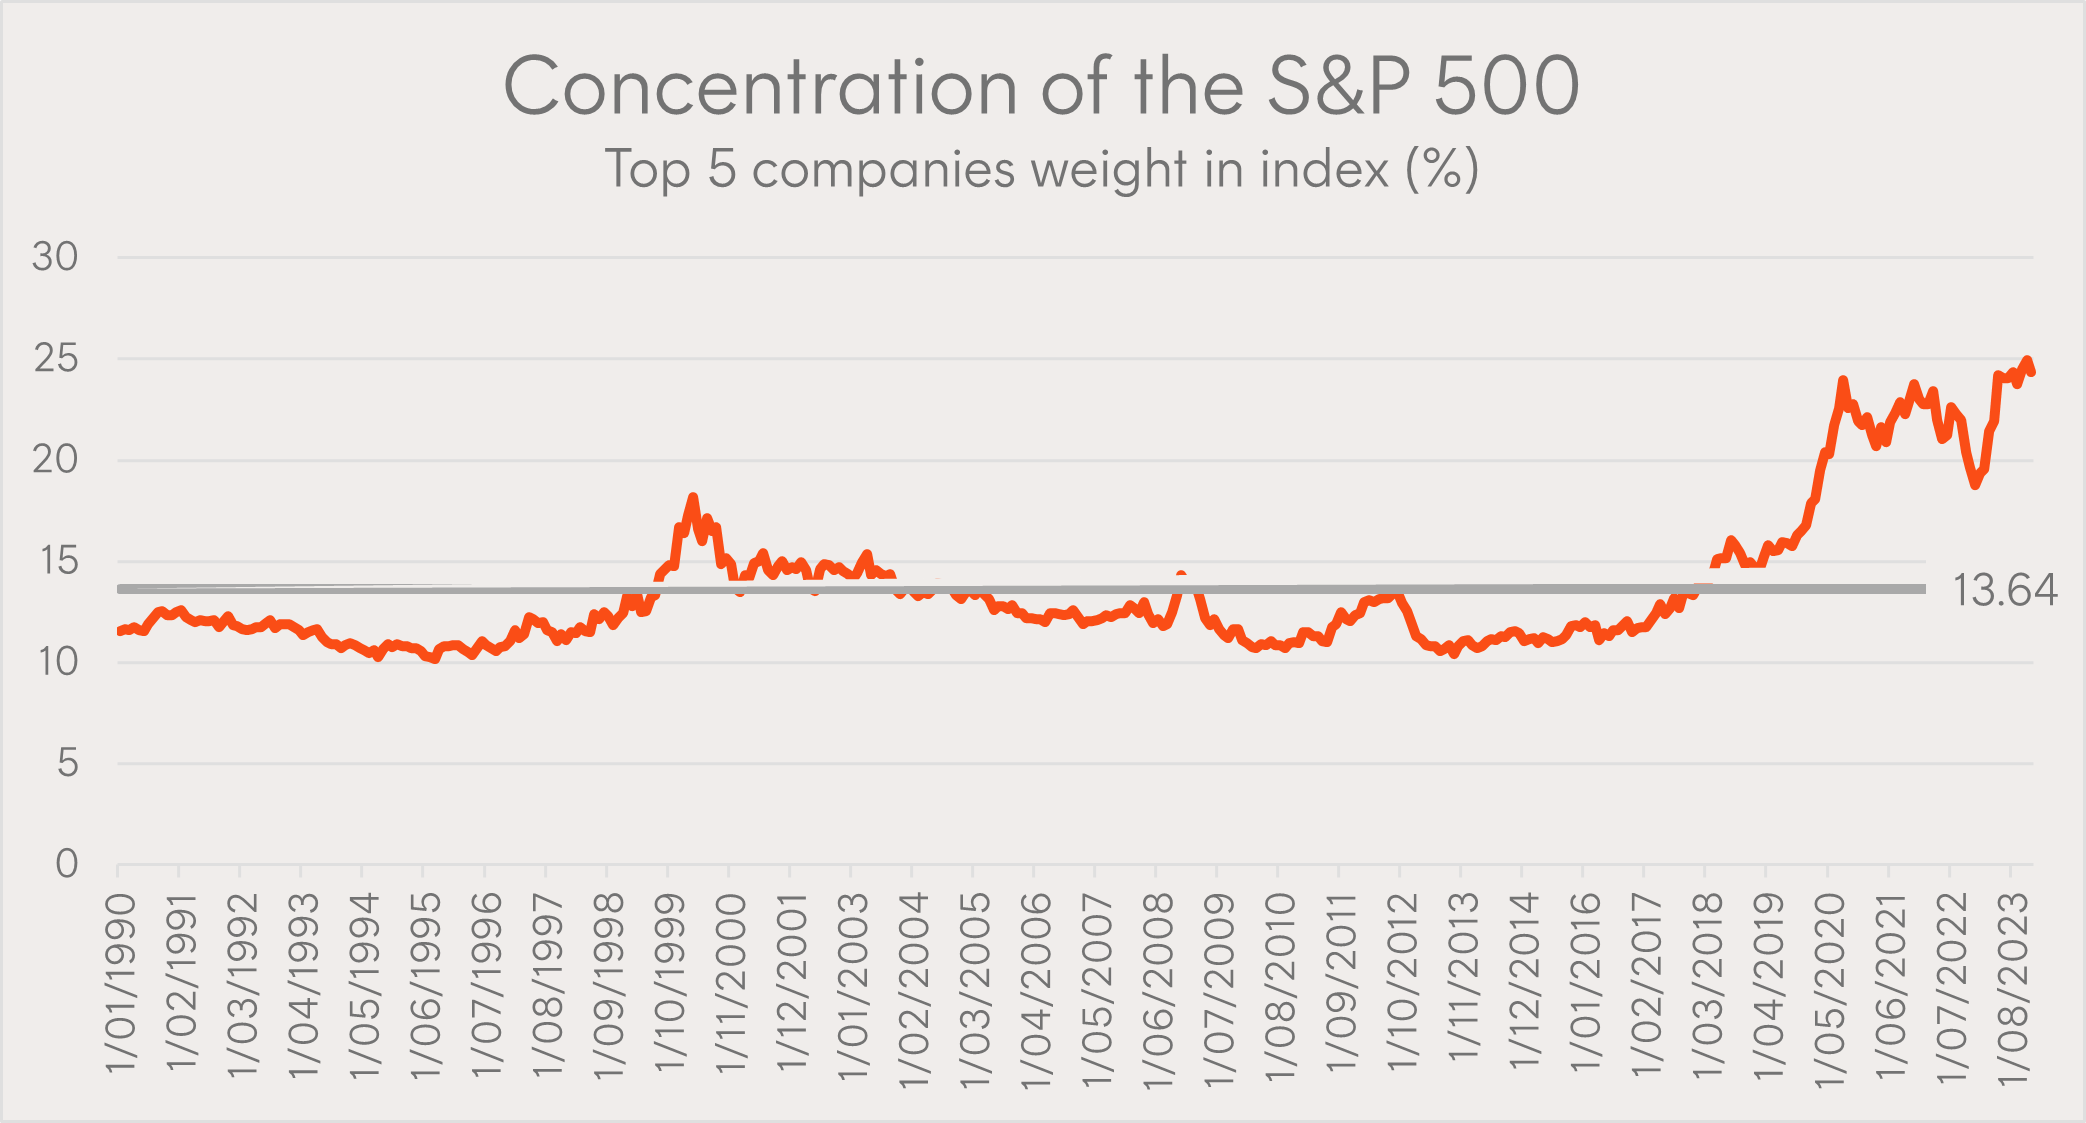
Source: Bloomberg, Betashares. 31 December 2023. Note: GOOG and GOOGL share classes are combined.
Why it’s important: The S&P 500 Index is the most concentrated it’s been since the early 70’s*. Historically, high levels of concentration have tended to mean-revert, which is positive for relative performance of the equal weight index.
*As measured by the weight of the top five holdings in the index.
Will Nvidia maintain the momentum in 2024?
Nominated by: Cameron Gleeson, Senior Investment Strategist.
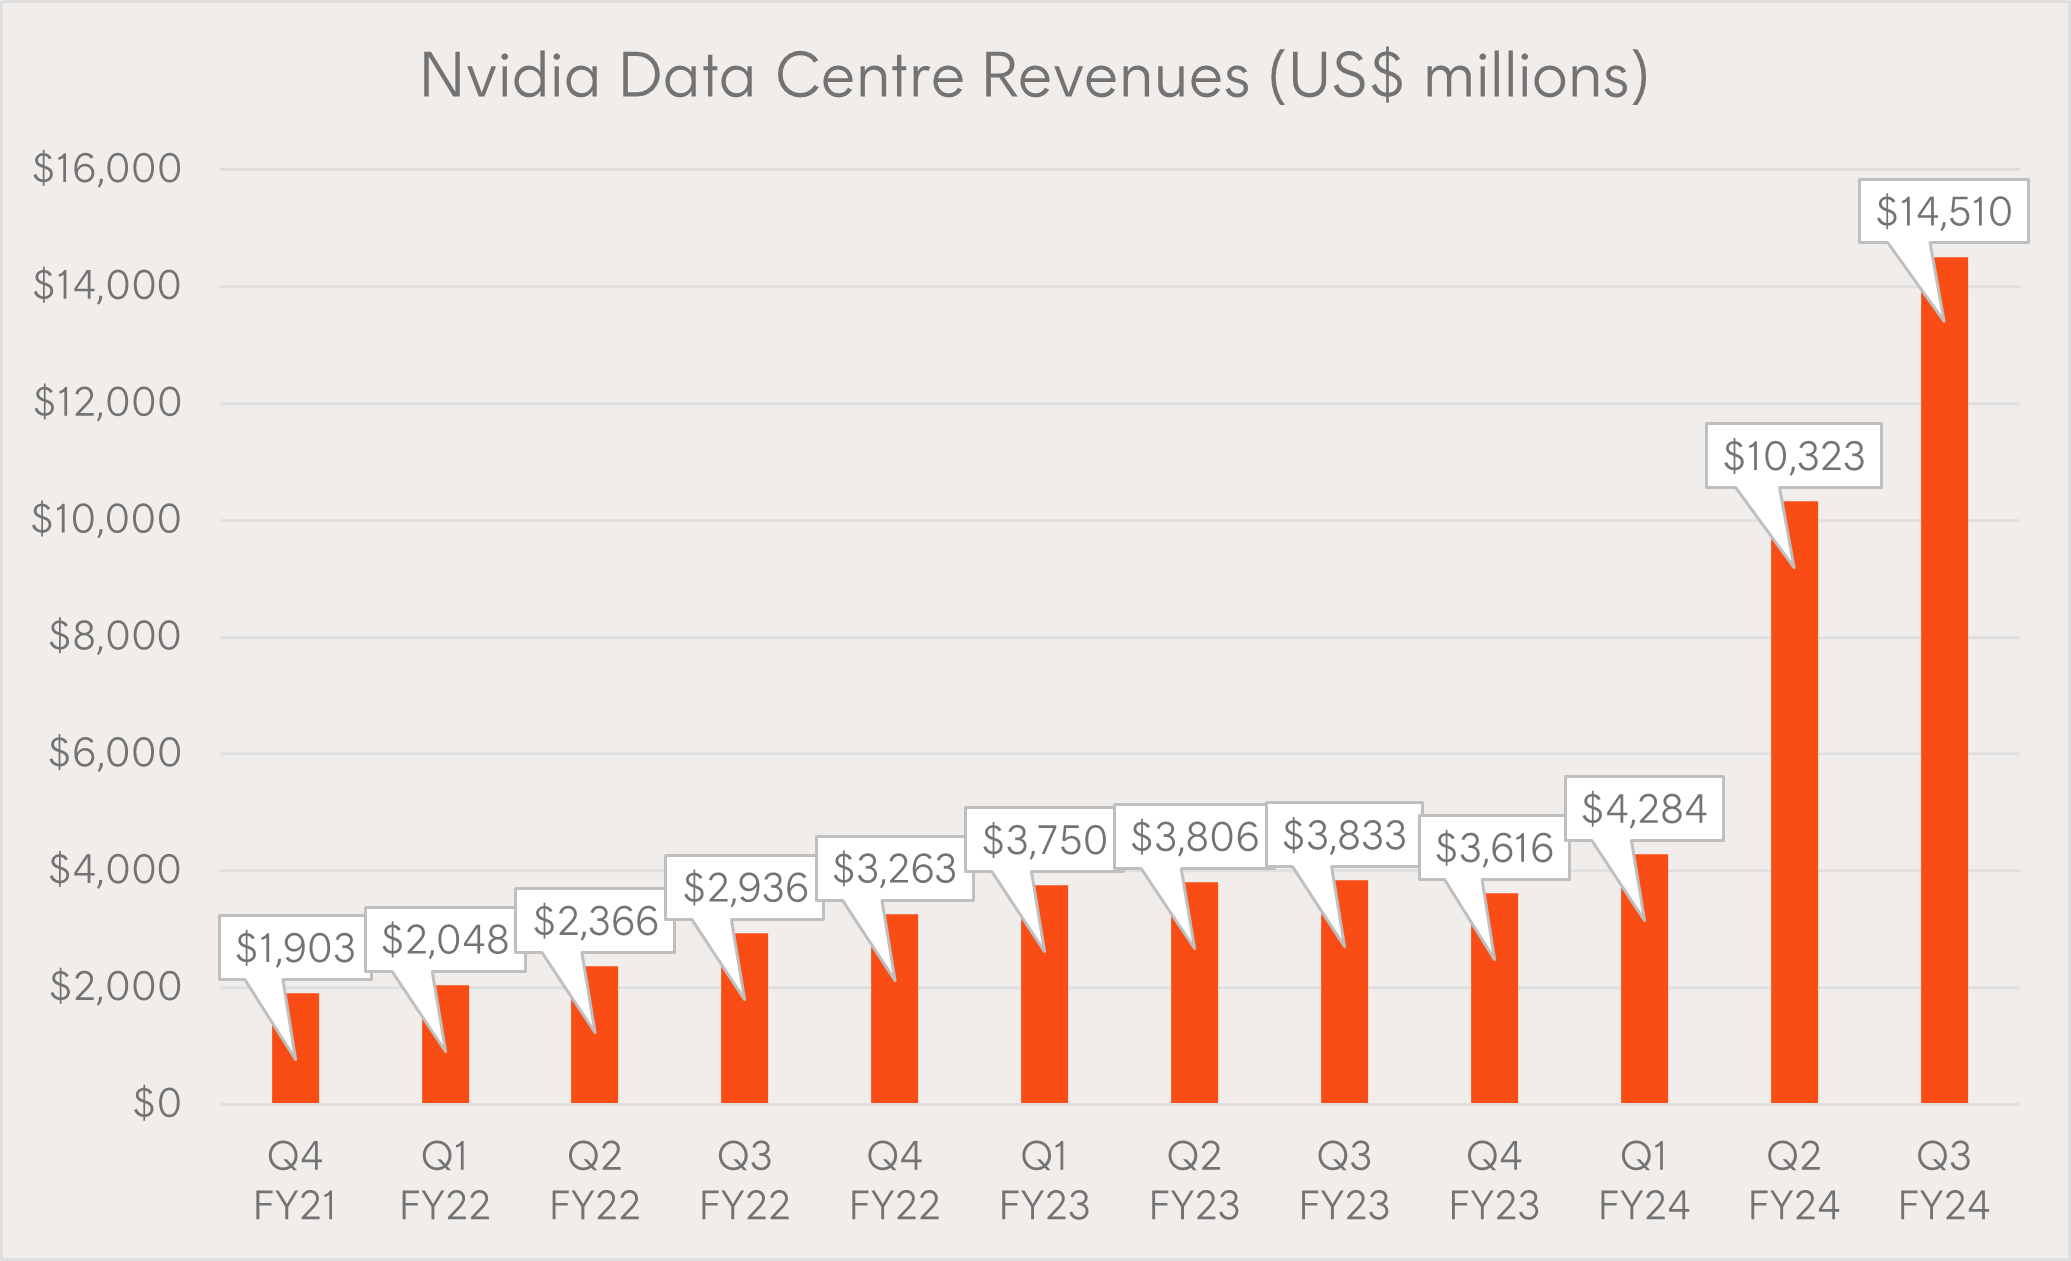
Source: Nvidia, Betashares. As at 31 December 2023.
Why it’s important: Nvidia has transformed itself from a supplier of gaming hardware to an AI-leader that’s powering development in the field. In 2023, the company’s share price jumped 240%, compared to 24% for the S&P 500, and it has seemingly become the bellwether stock for the AI industry. And with the recent launch of their revolutionary new GH200 Grace Hopper Superchip, Nvidia appears well placed to maintain their leadership in AI and data centres. Nvidia management provided guidance for Q4 FY24 of US$20 billion, including a QoQ fall in gaming revenues, implying that Data Centre Revenues is forecast to exceed US$17 billion2.
US corporates due to pay their debts
Nominated by: Chamath De Silva CFA, Head of Fixed Income.
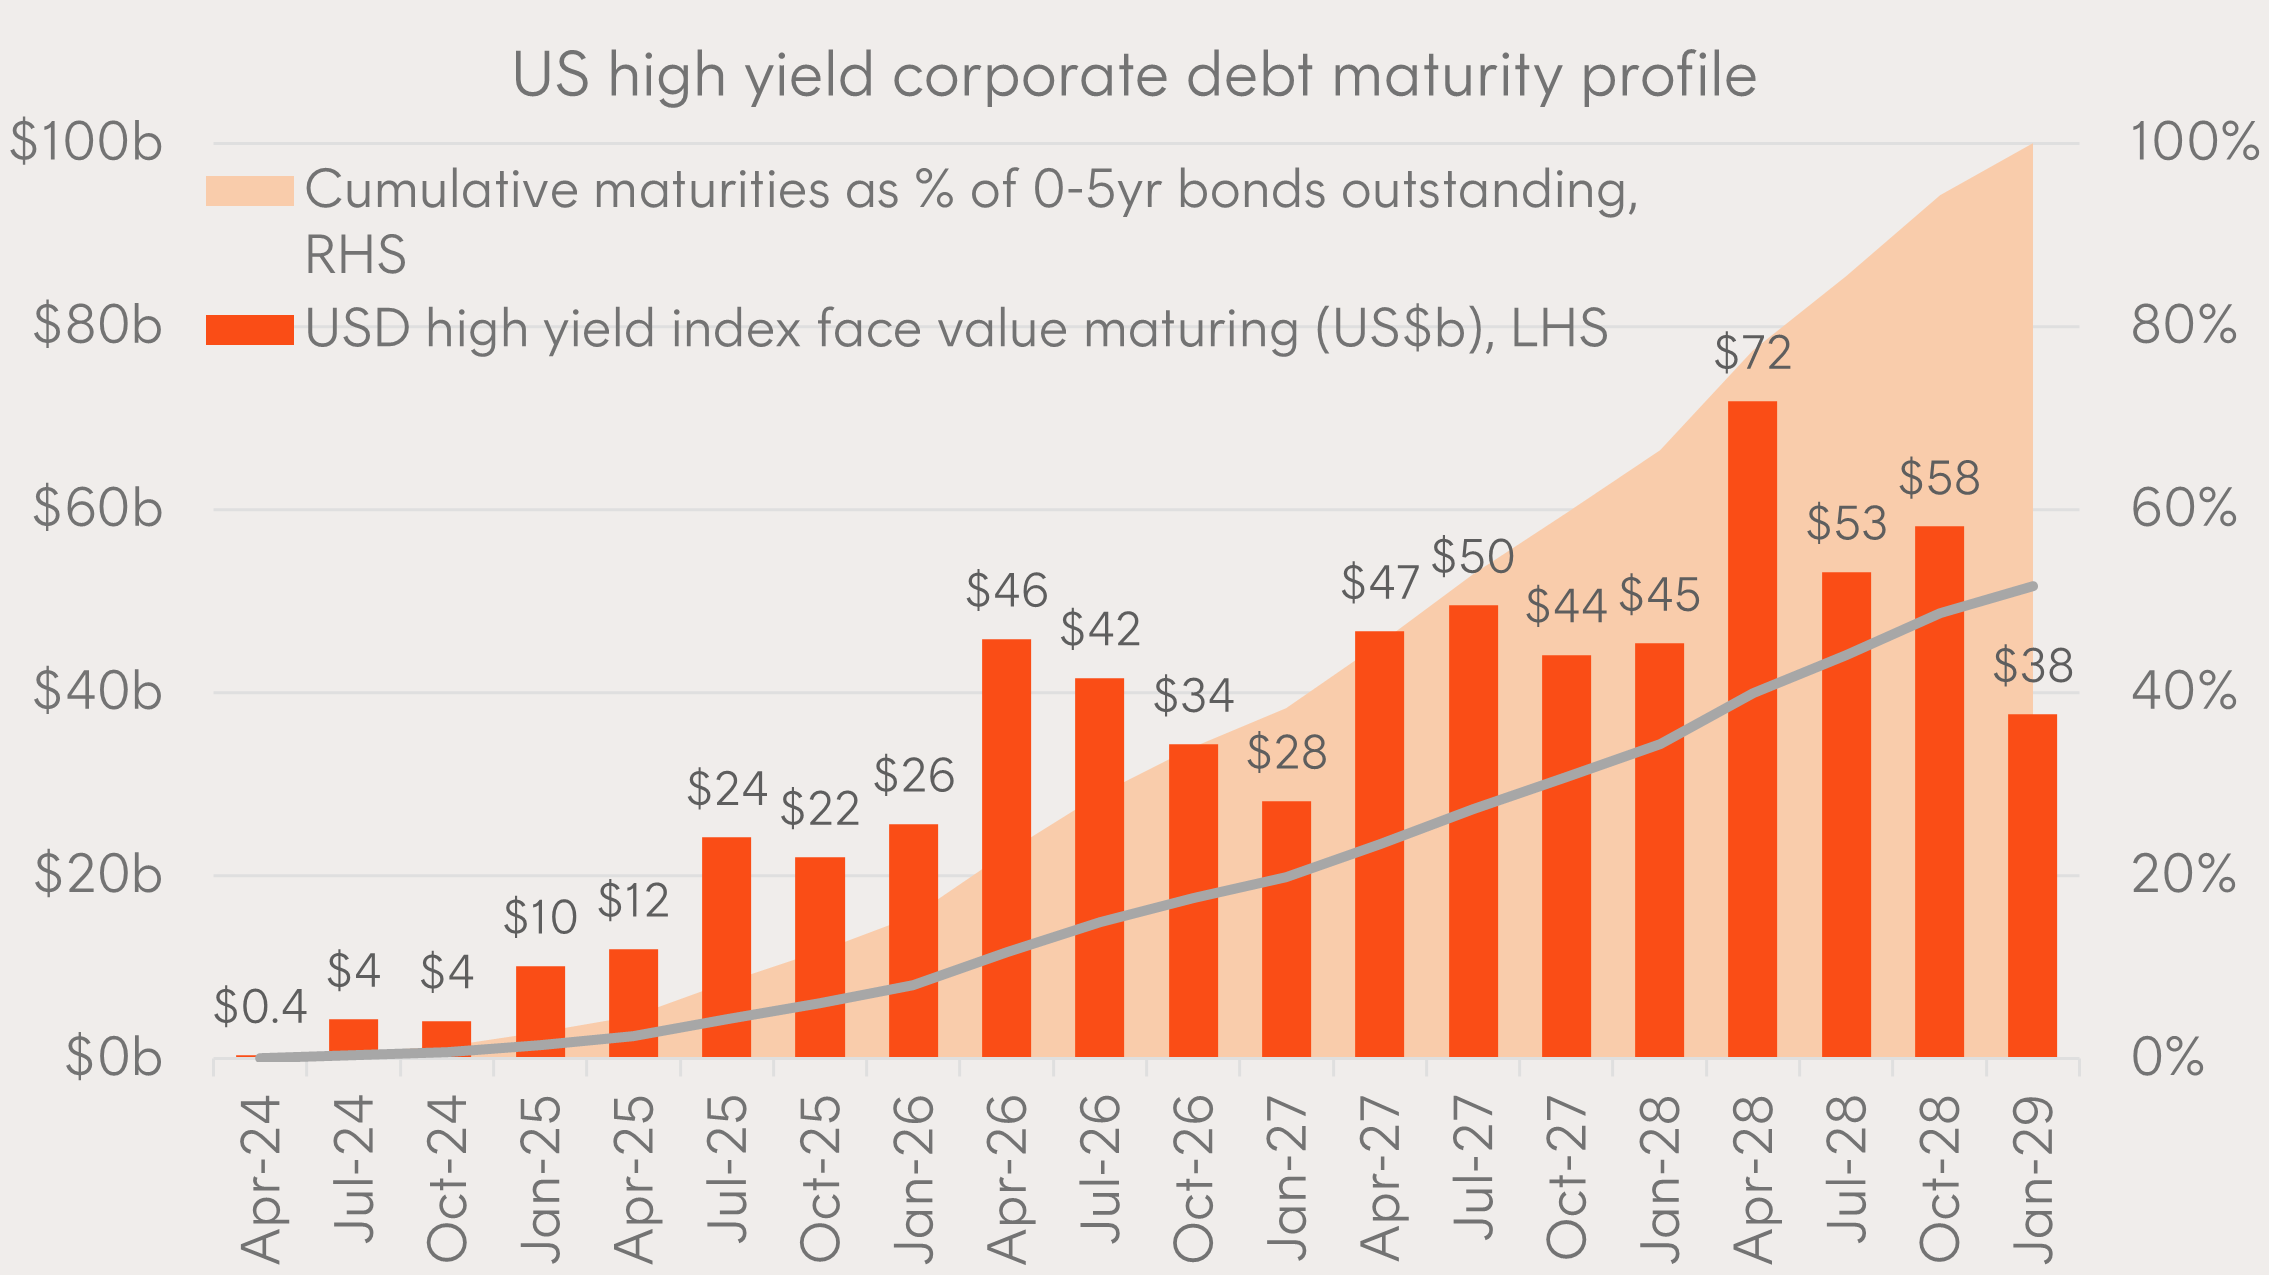
Source: Bloomberg, Betashares. As at 31 December 2023.
Why it’s important: Between April 2020 and March 2022 – the two years that the US Federal Funds Rate sat at zero – corporations issued US$1.95 trillion in high yield debt. Much of this debt was issued with long maturities as issuers took advantage of low interest rates, so just US$227 billion has matured so far. As the rate of maturities picks up towards the end of this year, corporates will need to decide whether to roll the debt over at new (higher) interest rates or pay it out in cash (assuming they can). If neither of these options are possible, we may see a tick-up in defaults.
Large caps outperformed in 2023: Will it continue?
Nominated by: Tom Wickenden, Investment Strategist.
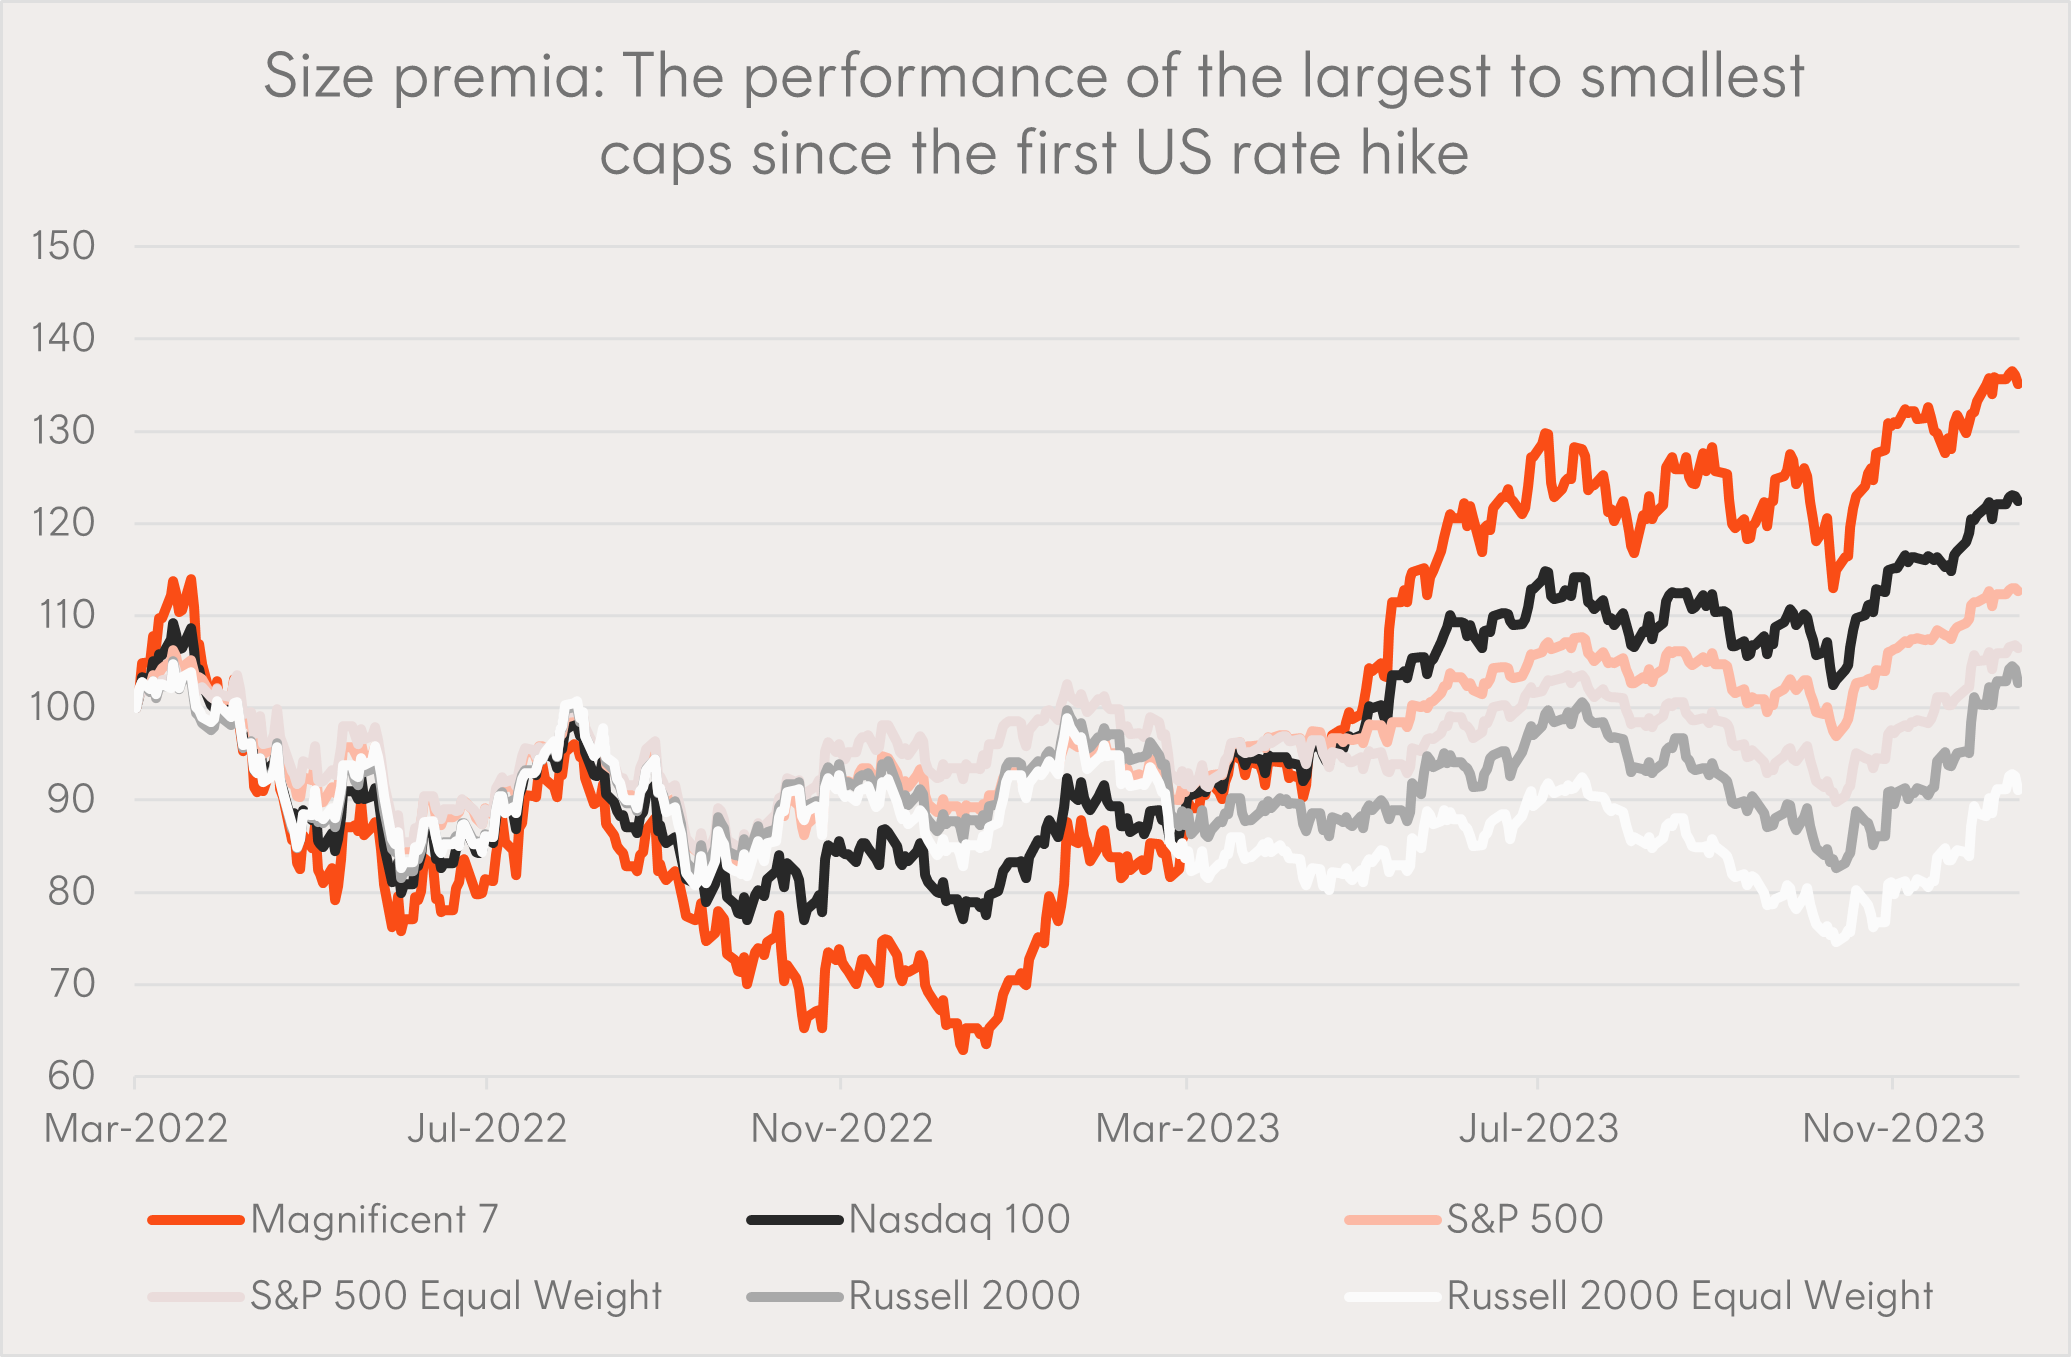
Source: Bloomberg. As at 31 December 2023.
Why it’s important: Conventional wisdom did not prevail this rate hiking cycle as the longest duration large cap technology stocks outperformed. As we head into 2024, market commentary will be fixated on how, when, and why rates are cut. For investors, the big question is which companies will be the biggest beneficiaries from the rate cutting cycle. If market breadth improves and the mid- and small- cap stocks catch up to the large caps, some investors may wish to consider Betashares S&P 500 Equal Weight ETF (ASX: QUS).
Investment required to fill the gap
Nominated by: Patrick Poke, Editorial Director.
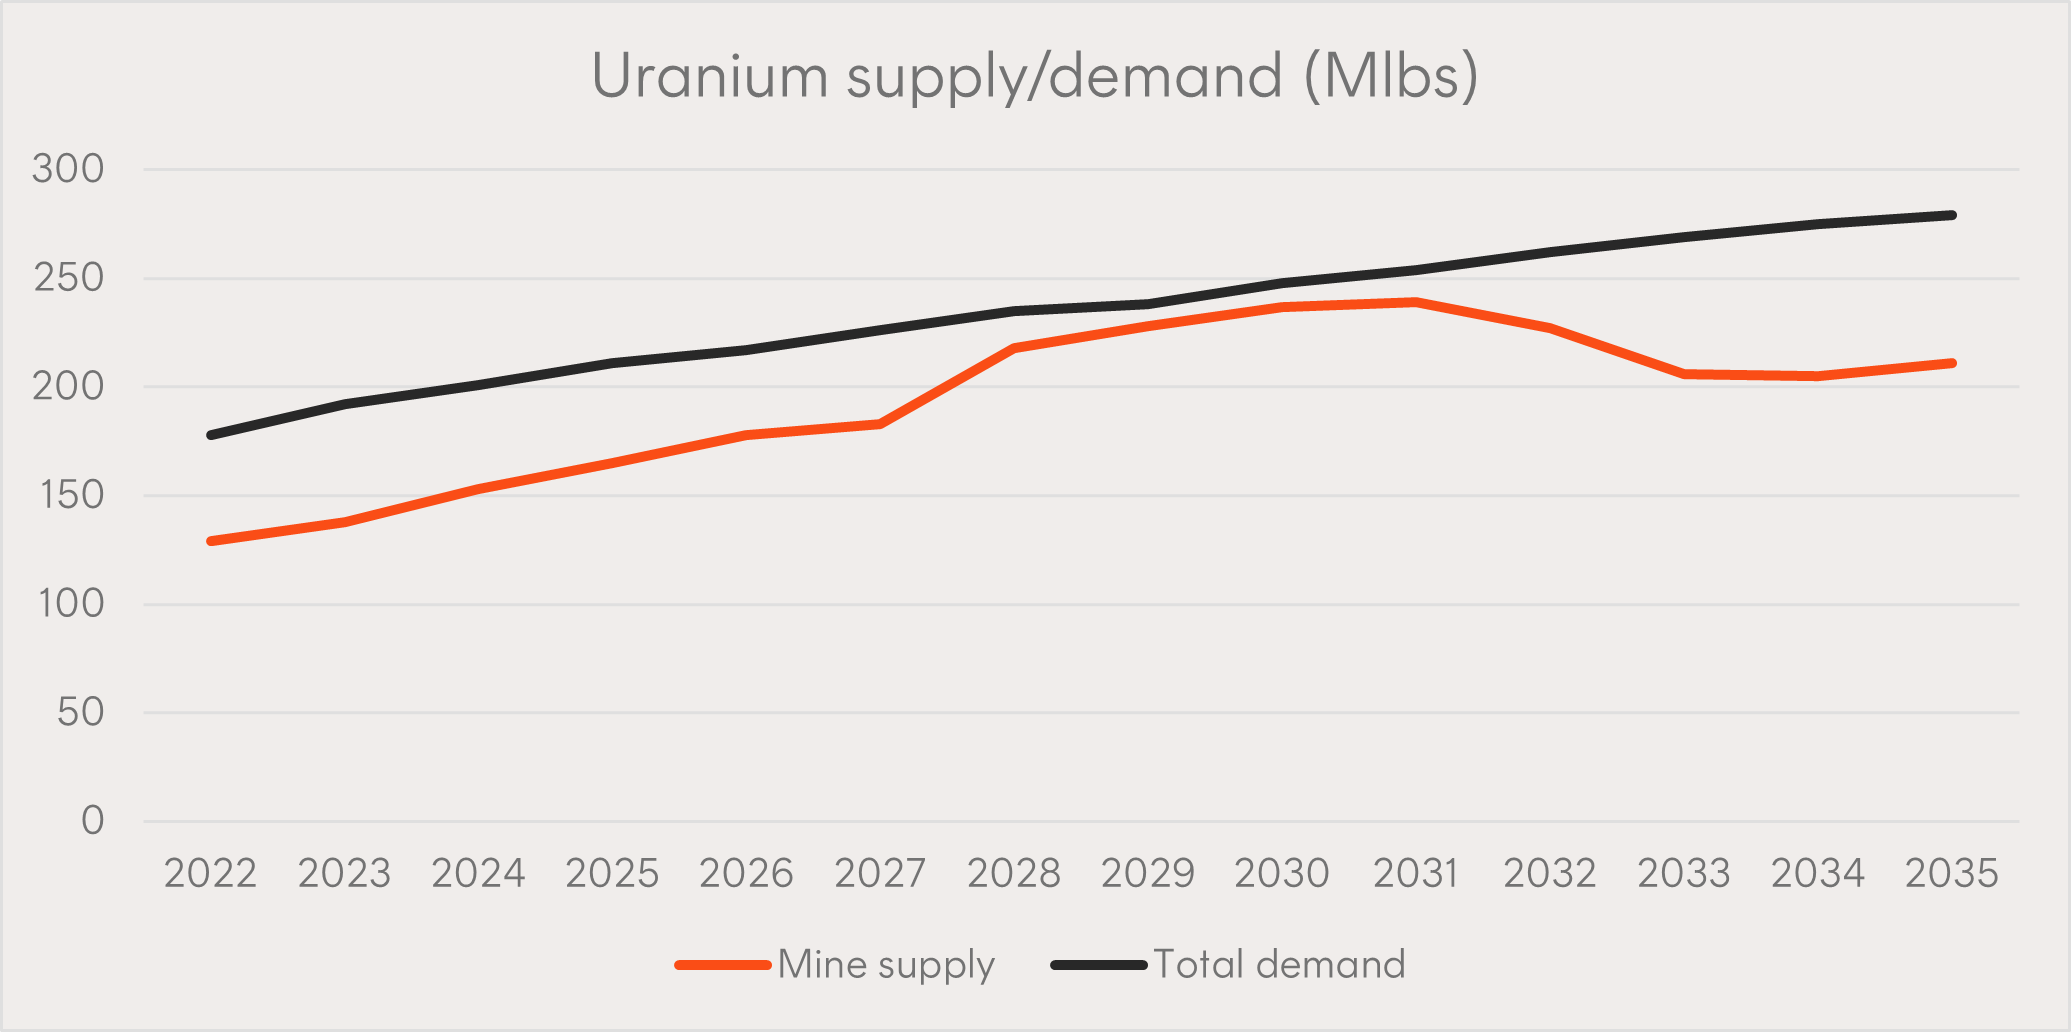
Source: Canaccord Genuity, World Nuclear Association, UxC LLC, Company Reports.
Why it’s important: Nuclear energy provided about 10% of global electricity production in 2022 and was the second biggest source of clean energy (behind hydroelectricity)[3]. At the risk of stating the obvious, without uranium, nuclear power plants cannot produce electricity. Following years of underinvestment in new uranium supply, the gap between production and demand has reached around 30,000 tons of uranium. Without significant investment in new uranium production, this gap is projected to expand over the coming decades.
Investing involves risk. The value of an investment and income distributions can go down as well as up. An investment in each fund should only be considered as part of a broader portfolio, taking into account your particular circumstances, including your tolerance for risk. For more information on the risks and other features of each fund, please see the relevant Product Disclosure Statement and Target Market Determination, available at www.betashares.com.au.
1. Future results are impossible to predict and inherently uncertain. Actual events or results may differ materially from those reflected or contemplated in the below statements. Betashares does not undertake any obligation to update forward-looking statements to reflect events or circumstances after the date such statements are made or to reflect the occurrence of unanticipated events.
2. Source: Nvidia Q3 FY24 Investor Presentation
3. Source: Our World in Data – Electricity Mix
10 comments on this
Hi Cameron.
So give some good tips to grab 10% profit for a pensioner to help pay the bills!
Cameron…the six charts are very much appreciated.
Is it your intention to update these during the course of 2024?
Are you guys going to o a FANG equivalent with lower costs
Uranium is the new lithium!
I have converted all my SMSF to Betashares ETF’s. Impressive returns.
Clear concise and to the point. Thanks. Very helpful. Gives charts to monitor for the year. Hope we get appropriate updates during the year instead year end reflection.
To David : Uranium is most definitely NOT ‘the new lithium’. Uranium has been around for 60+ years, is established and has regular users & producers and a far more stable & less speculative price. More correctly, you might have said that ‘Lithium is the new Uranium’ and is going through the teething process to become an embedded and reliable raw material that uranium is.
David: I hope not!
Great article – but I have some concerns regarding the graph on shortfall in uranium supply over the coming decade. As I read the graph it implies that currently some 40% of available nuclear electric power generation cannot occur because of uranium fuel shortage and that this is forecast to continue for most of the decade. I know that there is a spike in uranium pricing currently based on such graphs but that may not have a robust base. I suspect that the demand graph has been lifted via unrealistic predictions of new plant coming on-line earlier that has been achieved and this has been projected forward for future years. I studied the excellent supporting paper on sources of electricity supply for countries around the globe – but nothing was presented to support the usanium demand and supply graph.
Regards Rob
Hi Rob,
I thought I’d jump in here as I nominated the chart.
The chart shows mine supply (i.e. uranium that’s been mined and processed), and excludes secondary supply. Secondary supply includes civilian stockpiles, disarmament of nuclear weapons, recycling of uranium and plutonium, re-enrichment of depleted uranium, and underfeeding at enrichment plants.
Unfortunately, it’s very difficult to quantify secondary supply, hence the exclusion from the chart. For example, enrichment plants can switch between underfeeding and overfeeding, depending on the availability of UF6 feedstock and enrichment capacity. According to estimates by Canaccord Genuity, secondary supply accounted for 14-17% of annual demand over the last four years. According to UxC estimates, secondary supplies are expected to fall until 2031 (as shown in the chart in this article: https://www.betashares.com.au/insights/6-trends-driving-uranium/).
On the demand side, the assumptions for growth are relatively modest. Estimates for 2024 and 2025 (where visibility is fairly good) are for 5% demand growth per annum, and between 2026 and 2035, estimates are for between 1% and 4% annual demand growth, with most of this growth coming from China. You can see all China’s operable reactors, recent grid connections, and construction starts here: https://www.world-nuclear.org/country/default.aspx/China
Hope this addresses your queries.
Regards,
Patrick Poke