Betashares Australian ETF Review: May 2026

Ilan Israelstam
6 minutes reading time
Related articles

Better investing starts here
Get Betashares Direct
Betashares Direct is the new investing platform designed to help you build wealth, your way.
Scan the code to download.
Learn more
Learn more
End of 2023 Review: “Changing of the guard” – a record year for ETF growth as unlisted funds falter
• The Australian ETF industry recorded its highest annual funds under management (FUM) increase in 2023.
• In total, the Australian ETF industry received $15.0B of net inflows, in a year where the unlisted funds industry sustained net outflows of -$36.9B, marking the worst year on record for Australian managed funds1.
• As the chart below illustrates, with the exception of 2021, ETFs have received higher flows than unlisted funds in 4 of the last 5 years.
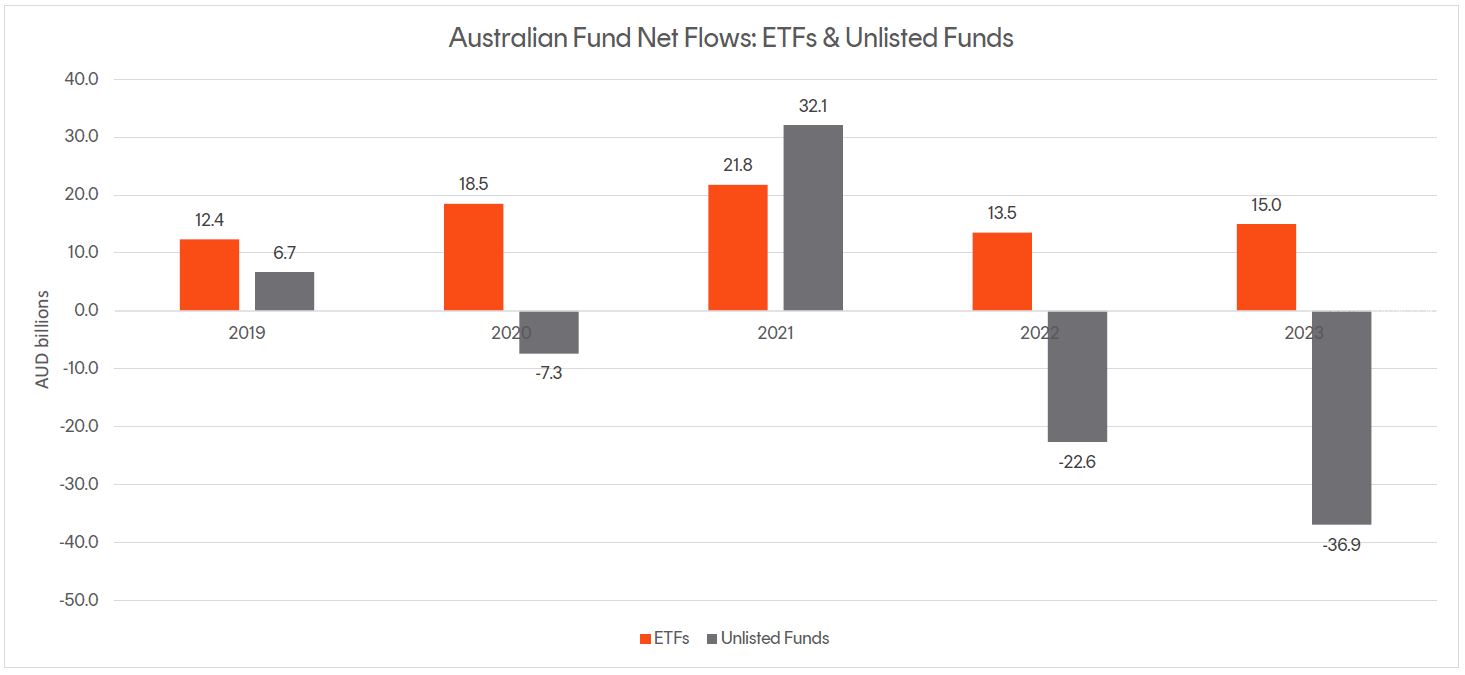 Source: Morningstar, Betashares
• Most strikingly of all, looking across a longer period – since the launch of the Australian ETF industry in 2001, cumulative net flows in the Australian unlisted managed funds industry are now negative2. This clear investor preference for ETFs, plus the increasing ‘conversion’ activity we’re seeing of unlisted managed funds into Active ETFs, represents a significant ‘changing of the guard’ in the Australian asset management industry.
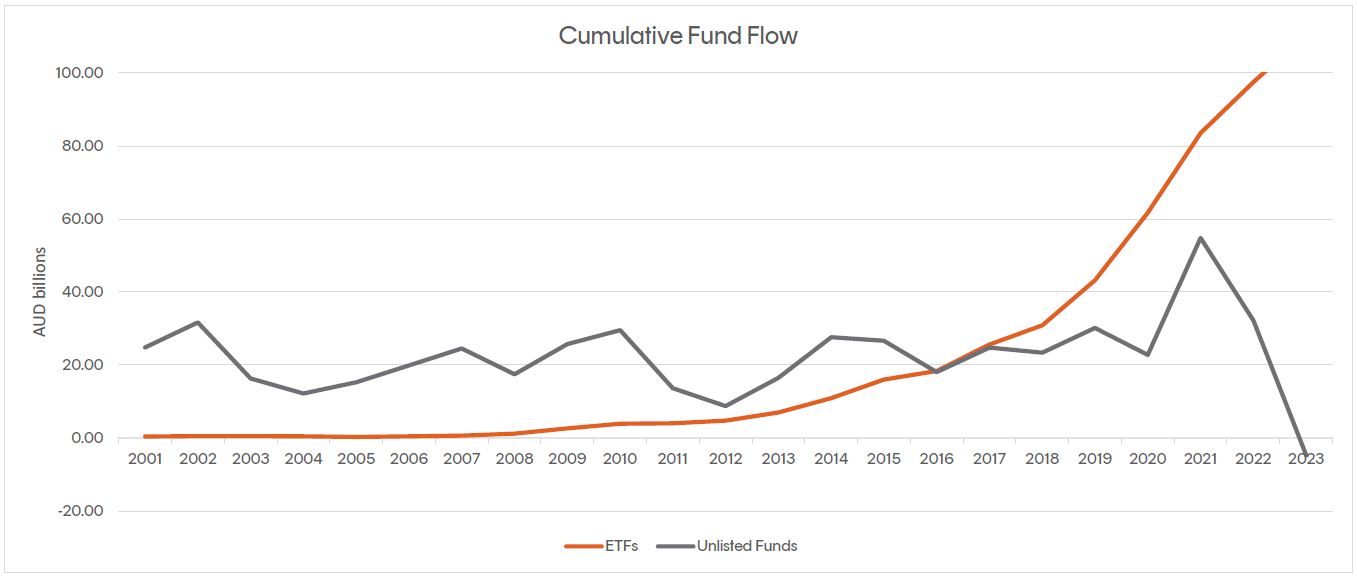 Source: Morningstar, Betashares
Exchanged Traded Funds Market cap
- Australian Exchange Traded Funds Market Cap (ASX + CBOE): $177.5B – new all time high
- ASX CHESS Market Cap: $151.1B3
- Market Cap increase for Year: 33%, $43.7B – industry record $ annual growth
Comment: The Australian ETF industry ended the year at an all time high, with total industry market capitalisation as at end 2023 of $177.5B, representing 33% year on year growth. The industry grew $43.7B in 2023 – an industry record in terms of $ annual growth. 2/3 of this growth came from market appreciation with the remainder deriving from investor inflows and unlisted fund conversion activity.
Net Flows
- Net flows for the year: $15.0B – 12% year on year increase v. 2022
New Products
- 367 Exchange Traded Products trading on the ASX & CBOE
- New/closed products: 56 new products launched in the half year (compared to 52 in 2022), 8 products closed (compared to 13 closures in 2022)
- 8 new issuers joined the market in 2023, all of which were Active Managers
- There are currently 47 issuers of ETFs in Australia
Comment: In terms of product launches, 2023 was the biggest year on record, with 56 new exchange traded funds launched on Australian exchanges in 2023 (v. 52 in 2022) and ‘net product growth’ of 48 funds. In what is certainly an accelerating trend, a large proportion of the new launches in 2023 were Active ETFs (46% or 26 funds), with the majority of these launches being via the creation of traded classes of existing unlisted funds (which we call “conversions”).
Trading value
- Annual ASX trading value remained broadly stable v 2022 (2% less compared to 2022) – with $115B of value traded on the ASX (v. $117B in 2022)
Performance
After a particularly strong second half it was growth exposures that topped the performance tables in the ETF industry in 2023. Betashares Crypto Innovators ETF (ASX: CRYP) took the number one slot for performance, with total return of ~215% for the year. This was followed by other crypto and technology exposures.
December 2023
Top 5 category inflows (by $) – December 2023
| Broad Category | Inflow Value |
| International Equities | $677,953,870 |
| Australian Equities | $444,135,751 |
| Fixed Income | $211,956,843 |
| Short | $62,343,729 |
| Listed Property | $55,777,994 |
Top category outflows (by $) – December 2023
| Broad Category | Inflow Value |
| Commodities | ($81,646,411) |
| Multi-Asset | ($61,967,659) |
| Currency | ($8,087,033) |
Top sub-category inflows (by $) – December 2023
| Sub-category | Inflow Value |
| International Equities – Developed World | $457,972,501 |
| Australian Equities – Broad | $315,497,714 |
| International Equities – US | $209,117,703 |
| Australian Bonds | $122,849,173 |
| Global Bonds | $78,277,929 |
Top sub-category outflows (by $) – December 2023
| Sub-category | Inflow Value |
| Gold | ($80,094,681) |
| International Equities – Sector | ($72,955,005) |
| Multi-Asset | ($64,556,110) |
| Australian Equities – Geared | ($52,087,700) |
| International Equities – Geared | ($11,608,549) |
Inflows 2023
Top 5 category inflows (by $) – 2023
| Category | Inflow Value | Rank Movement |
| Fixed Income | $5,317,048,063 | +1 |
| Australian Equities | $5,213,292,873 | -1 |
| International Equities | $2,981,229,993 | – |
| Cash | $1,039,285,859 | +2 |
| Listed Property | $314,524,642 | – |
Comment: With investors seeking out a more defensive stance in their asset allocations, together with elevated income/yield opportunities, Fixed Income ETFs were the number one broad category for inflows in 2023, marking the first time this has occurred over the course of a year since this report has been published. Australian Shares ETFs were the second most popular category. International Equities once again took 3rd place (as it did in 2022) – we expect this to change in 2024 as the rate environment changes, and we would fully expect investors to adopt more meaningfully growth oriented exposures typically found in global equities ETFs going forward:
- Fixed Income ETFs received the largest amount of net flows, with $5.3B received. (v. $3.6B in 2022)
- Australian Equities ETFs came in 2nd in 2023 with $5.2B in flows (v. $4.4B in 2022)
- International equities ETFs had a very quiet year receiving $2.9B of net inflows (v. $3.3B in 2022)
*Past performance is not an indicator of future performance.
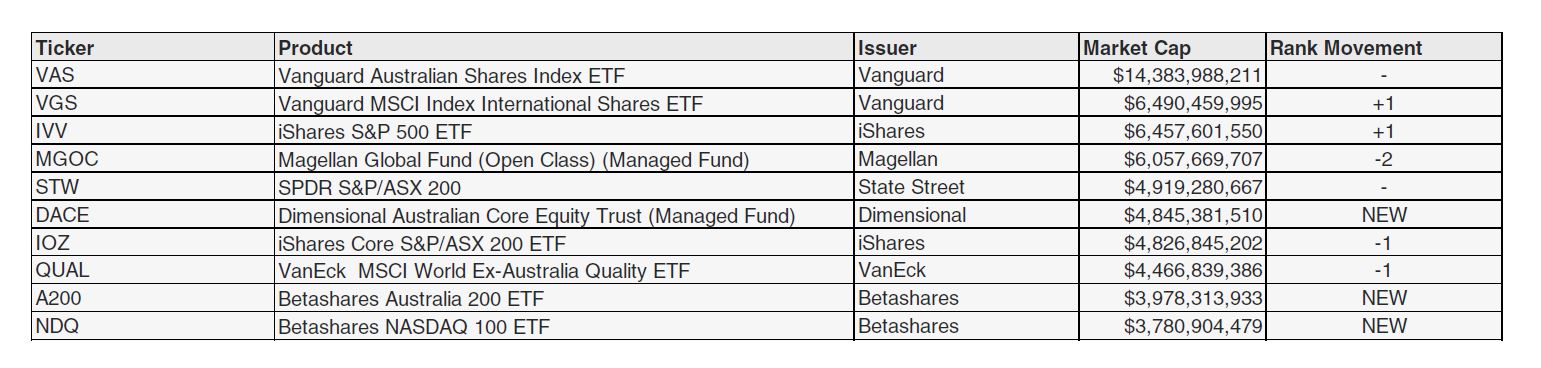
Top 10 Products: End of year 2023
Top Performing Products – 2023
| Ticker | Product Name | Performance |
| CRYP | Betashares Crypto Innovators ETF | 214.5% |
| EBTC | Global X 21Shares Bitcoin ETF | 150.9% |
| LNAS | Global X Ultra Long Nasdaq 100 Hedge Fund | 134.9% |
| FANG | Global X FANG+ ETF | 94.4% |
| EETH | Global X 21Shares Ethereum ETF | 91.0% |
Industry Forecast:
In our year-end report for 2022, following a year where industry market capitalisation fell, I wrote, regarding 2023: “we believe that market conditions will continue to act as a hinderance to industry growth but expect net inflows to remain consistently positive and ultimately that the industry will return to a growth footing. As such, we forecast total industry FuM at end 2023 to exceed $150B in assets”. While I was correct regarding positive inflows, I did not predict that ultimately market conditions would be nearly as positive as they were and thus under-estimated by quite some margin, total industry size.
In terms of 2024, we believe that the industry will continue to benefit from increased investor adoption and inflows combined with positive markets. As such, we forecast total industry FuM at end 2024 to exceed $200B and could reach as high as $220B depending on market conditions.
Footnotes:
1. Unlisted Fund data according to Morningstar, as at 31st December 2023. Where managers have not reported December figures, November 2023 figures are utilised. ETF flow data per BetaShares, as at 31st December 2023
2. Morningstar, as at 31st December 2023 – includes retail (unitised) managed funds – excludes institutional/non-unitised mandates3. Since February 2023, the ASX started reporting additional data on a CHESS-only basis. The primary use of such data is that it will exclude, amongst other things, the FuM and Flows in ‘dual class’ Active ETFs and potentially provide a more accurate picture of exchange traded activity.
Explore
ETF industry