
Betashares Australian ETF Review: May 2026

Ilan Israelstam
3 minutes reading time
Related articles


Better investing starts here
Get Betashares Direct
Betashares Direct is the new investing platform designed to help you build wealth, your way.
Scan the code to download.
Learn more
Learn more
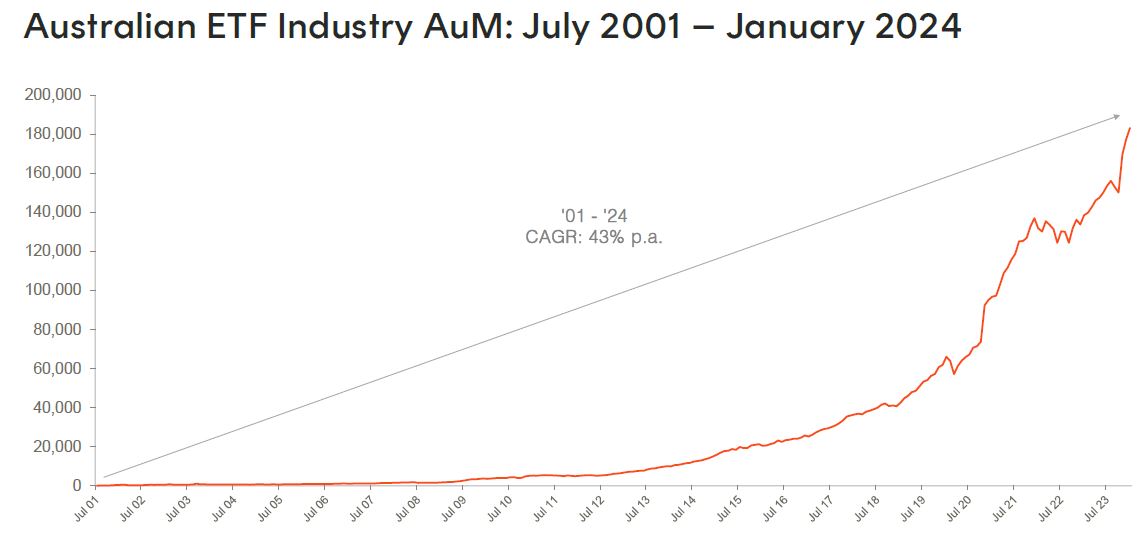
Industry exceeds $180B as investors move back into equities
- The Australian ETF industry hit a new all-time high in assets under management in January with the industry growth driven by a combination of asset value appreciation and investor net inflows.
- In the first month of 2024, assets grew 3.2% month-on-month, for a total monthly market cap increase of $5.6B, with the industry reaching a new all-time high of $183.1B.
- Net inflows represented ~30% of the industry’s growth in January, with net inflows of $1.7B, a robust result in what is typically the quietest month of the year.
Source: ASX, CBOE
Exchanged Traded Funds Market cap
- Australian Exchange Traded Funds Market Cap (ASX + CBOE): $183.1B – New all-time high
- ASX CHESS Market Cap: $156.1.2B1
- Market Cap increase for month: 3.2%, $5.6B
- Market cap growth for last 12 months: 32.2%, $44.6B
Net Flows
- Net flows for the month: $1.7B
New Products
- 367 Exchange Traded Products trading on the ASX & CBOE
- No new or closed products in January
Trading value
- Trading value rose by -20% in January, with ASX trading value of ~$8B for the month
Performance
- The best performing ETF in January was our Global Uranium ETF (ASX: URNM) which recorded performance of 16.4% for the month. Other than Uranium exposures, we saw strong performance in our Currency Hedged Japanese Equities ETF (ASX: HJPN), which rose ~9% in the month.
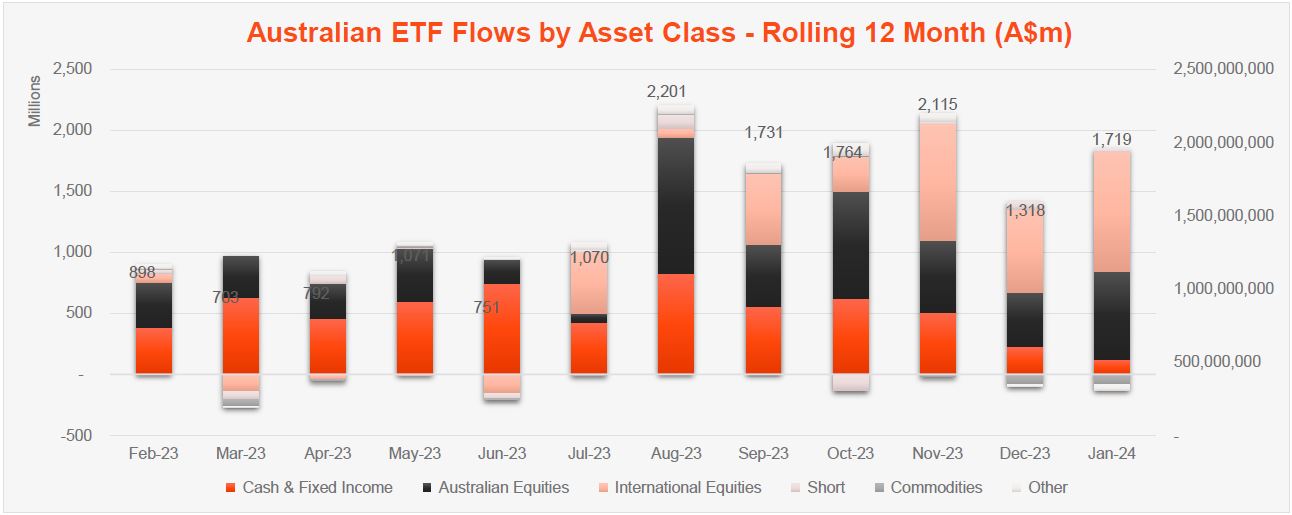
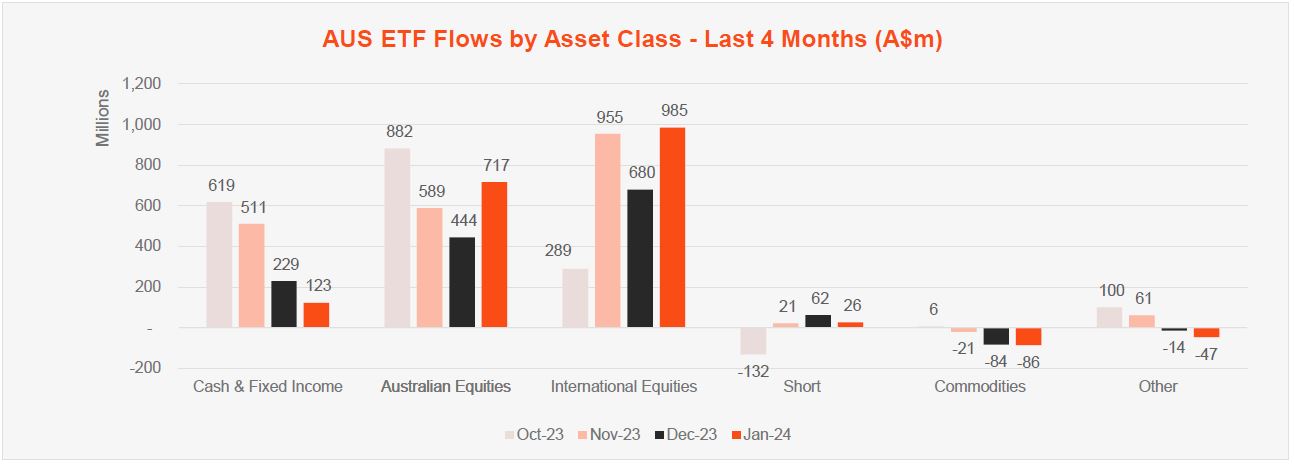
Top 5 category inflows (by $)
| Broad Category | Inflow Value |
| International Equities | $985,376,256 |
| Australian Equities | $717,465,478 |
| Fixed Income | $67,033,367 |
| Cash | $55,963,646 |
| Short | $26,177,886 |
Top category outflows (by $)
| Broad Category | Inflow Value |
| Commodities | ($86,076,776) |
| Listed Property | ($71,495,150) |
Top sub-category inflows (by $)
| Sub-category | Inflow Value |
| Australian Equities – Broad | $790,375,256 |
| International Equities – Developed World | $575,839,972 |
| International Equities – US | $187,530,812 |
| International Equities – Sector | $125,193,066 |
| Australian Bonds | $104,006,727 |
Top sub-category outflows (by $)
| Sub-category | Inflow Value |
| Australian Equities – Sector | ($83,291,028) |
| Gold | ($82,610,832) |
| Australian Listed Property | ($81,428,324) |
| Global Bonds | ($47,010,028) |
| International Equities – E&R – Impact | ($33,647,014) |
Top Performing Products – 2023
| Ticker | Product Name | Performance |
| URNM | Betashares Global Uranium ETF | 16.4% |
| ATOM | Global X Uranium ETF | 13.3% |
| HJPN | Betashares Japan ETF – Currency Hedged | 9.3% |
| MKAV | Montaka Global Extension Fund | 8.9% |
| YANK | Betashares Strong US Dollar Fund (Hedge Fund) | 8.8% |
Footnotes:
1. Since February 2023, the ASX started reporting additional data on a CHESS-only basis. The primary use of such data is that it will exclude, amongst other things, the FuM and Flows in ‘dual class’ Active ETFs and potentially provide a more accurate picture of exchange traded activity.
Explore
ETF industry