Southern route

Tom Wickenden
7 minutes reading time
Related articles

This information is for wholesale client use only.
Bond routs have historically not lasted long
2022 was the worst year on record for fixed rate bond returns1. But bond market routs have historically not lasted long.
Since its inception, the AusBond Composite (Composite) has only recorded two years of negative returns prior to 2021. Encouragingly, these two years, 1994 (-4.7%) and 1999 (-1.27%), were followed by two of the Composite’s better years for returns; 1995 (18.6%) and 2000 (12.1%).
Continuing this trend, the Composite has started off well in 2023. Meanwhile, inflation is moderating, and central banks look likely to end their most aggressive rate hiking campaign since 1980 this year. If this narrative continues to play out, bond markets may have already felt most of the price pain of rising yields, with the associated income and defensive opportunities now presenting themselves.
 Source: Bloomberg, Betashares. Annual returns of the AusBond Composite 0+ yr Index since inception in 1989. Past performance is not an indicator of future performance. You cannot invest directly in an index.
Higher yields are bringing investor confidence and an income buffer
The 10-year Australian Government bond yield (Australian 10-yr) crossed 4% for the fourth time over the past 12 months on 15 June 2023. 4% has represented a key level in fixed income markets this year, with some investors using this mark as a buying point for fixed rate bonds – similar to how we often see the AUD falling below USD0.65 acting as a trigger for Australian investors to switch to currency hedged global equity exposures. At the 4% level, investors are seemingly comfortable that yields will not need to rise materially before the end of this rate hiking cycle.
Higher yields can also provide a meaningful income buffer to bond investors’ total returns. In 2022, with a low starting point for yields of 1.7% (as at 1 January 2023) the coupons received from bonds did little to offset their capital decline as yields rose (as yields rise bond prices, by definition, fall).
Today, the Betashares Australian Composite Bond ETF (ASX: OZBD) has a yield to maturity of 4.8% and modified duration of 6.1 years2. Using this fund as a simple example, the annualised income provided by this diversified ETF of Australian bonds would offset the capital decline from a ~75bps to 80bps move higher in yields over one year.
Rather than moving higher, the Australian 10-yr has traded in a range between ~3% and 4% over the past 12-months. While this has meant the price of these bonds have also traded sideways, higher starting yields have generally provided investors with positive total returns.
Again, using OZBD as an example, from 17 June 2022 when the Australian 10-yr crossed 4%, to 15 June 2023, when it once again reached this 4% mark, the diversified portfolio of Australian corporate and government bonds returned 5%. Highlighting the positive returns achieved predominantly from coupon payments over this period.

Source: Bloomberg, Betashares. Past performance is not an indicator of future performance. You cannot invest directly in an index.
Bonds are once again playing their traditional role in diversifying portfolios
Uncorrelated assets allow investors to construct portfolios offering lower risk for a given level of investment returns. Promisingly, stock and bond correlations have turned negative. This traditional relationship broke down in 2022 as both asset classes sold off in unison as markets reacted to surging inflation and rising interest rate expectations. Under these circumstances multi-asset portfolios did not benefit from bonds as a defensive allocation. In fact, the opposite was true, leading to the worst year for the 60/40 portfolio since 19313.
In 2023, the focus has begun to shift to the potential for economic deterioration as a result of tighter financial conditions. Historically, bonds – particularly longer duration, high quality bonds, such as long maturity government bonds – have tended to provide strong defensive benefits in such environments. It is for this reason that investors seeking the benefits of diversification have been able to rely on bonds again in 2023. Falling as low as -0.5 in March, the correlation between Australian stocks and bonds remains well below 0 at -0.24.
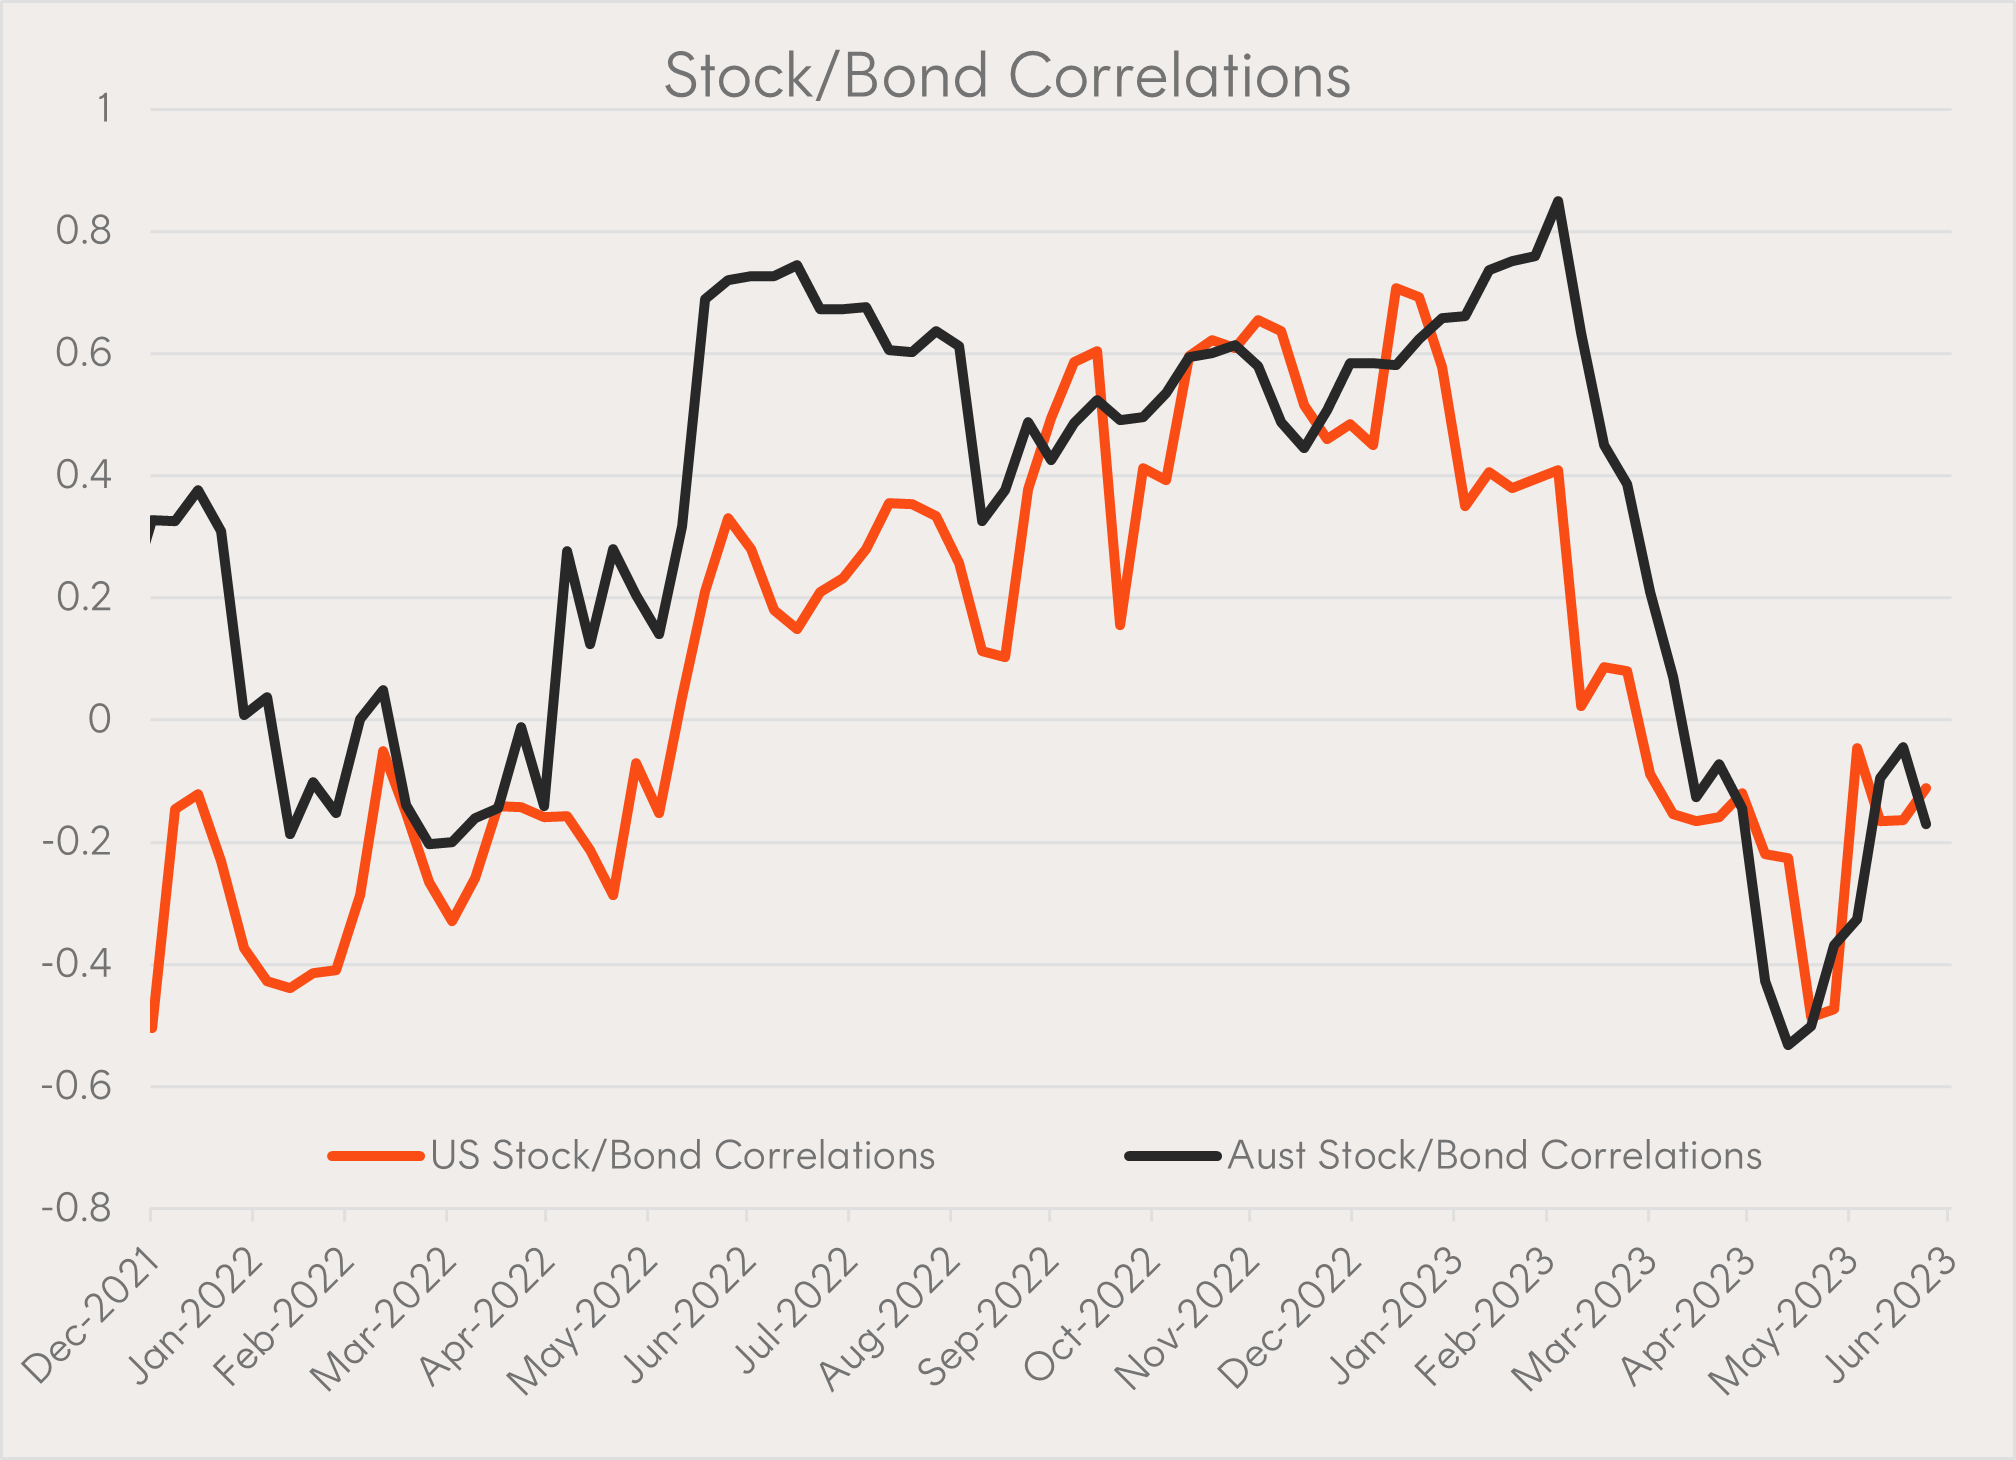
Source: Bloomberg; Betashares. As at 26 June 2023. 3-month rolling (weekly return), US Stock/Bond Correlations; S&P 500 Index vs Bloomberg US Treasury TR Index; Australian Stock/Bond Correlations; S&P/ASX 200 Index vs Bloomberg AusBond Govt 0+ Yr Index. You cannot invest directly in an index. Does not take into account ETF fees and costs. Past performance is not an indicator of future performance of any index or ETF.
Implementation
OZBD Australian Composite Bond ETF is designed as a core bond portfolio allocation, comprised of high-quality Australian corporate and government bonds selected on the basis of risk-adjusted income potential, while controlling for overall interest rate and credit risk.
AGVT Australian Government Bond ETF and GGOV US Treasury Bond 20+ Year Currency Hedged ETF offer investors exposure to longer dated government bonds, providing potential diversification and defensive benefits. Historically, they have been among the better performing assets during US recessions and periods of global economic weakness.
OZBD, AGVT, and GGOV are all rated ‘Recommended’ by Lonsec. You can request the research reports from your BDM or by filling in the form under the following link.
For more information on Betashares ETF platform availability please use the following link.
OZBD
Australian Composite Bond ETF
keyboard_arrow_down
Attractive income from diversified Australian bonds
GGOV
US Treasury Bond 20+ Year Currency Hedged ETF
keyboard_arrow_down
Generate income and defend your portfolio with long-dated US Treasury bonds
AGVT
Australian Government Bond ETF
keyboard_arrow_down
Earn attractive income from Australian government bonds
The Lonsec Ratings (assigned 20 March 2023) presented in this document is published by Lonsec Research Pty Ltd ABN 11 151 658 561 AFSL 421 445. The Rating is limited to “general advice” (as defined in the Corporations Act 2001) and based solely on consideration of the investment merits of the financial product. Past performance information is for illustrative purposes only and is not indicative of future performance. It is not a recommendation to purchase, sell or hold any Betashares fund, and you should seek independent financial advice before investing in this product. The Rating is subject to change without notice and Lonsec assumes no obligation to update the relevant document following publication. Lonsec receives a fee from the Betashares for researching the product using comprehensive and objective criteria. For further information regarding Lonsec’s Ratings methodology, please go to http://www.lonsecresearch.com.au/research-solutions/our-ratings
There are risks associated with an investment in the Funds and the value of units may go up and down. An investment in the Funds should only be made after considering your particular circumstances, including your tolerance for risk. For more information on risks and other features of the Funds, please see the Target Market Determination (TMD) and Product Disclosure Statement (PDS) for the relevant Funds, available at www.betashares.com.au.
This is not a recommendation to buy units or adopt any particular strategy. You should make your own assessment of the suitability of this information. Past performance is not an indication of future performance. No assurance is given regarding the future performance of the Funds or the payment of any distributions. Betashares Capital Ltd (ACN 139 566 868 AFS Licence 341181) (“Betashares”) is the issuer of the Funds. This is general information only and does not take into account any person’s particular circumstances. Investors should read the relevant PDS (at www.betashares.com.au) before deciding to buy or hold units. Investors may buy units on ASX through a broker or financial adviser. To the extent permitted by law Betashares accepts no liability for any loss from reliance on this information. Future outcomes are inherently uncertain. Actual outcomes may differ materially from those contemplated in any opinions, estimates or other forward-looking statements given in this information.
1. As measured by the Bloomberg AusBond Composite 0+ yr Index [AusBond Composite]
2. As at 28 June 2023. Modified duration is a measure of sensitivity of the portfolio’s price to changes in yields.
3. Source: Ibbotson and New Frontier Advisors LLC
4. As at 26 June 2023.
2. As at 28 June 2023. Modified duration is a measure of sensitivity of the portfolio’s price to changes in yields.
3. Source: Ibbotson and New Frontier Advisors LLC
4. As at 26 June 2023.
Explore
Macro & markets