

All in on AI? 3 ways to reduce concentration risk

Tom Wickenden
4 minutes reading time
Related articles
Better investing starts here
Get Betashares Direct
Betashares Direct is the new investing platform designed to help you build wealth, your way.
Scan the code to download.
Learn more
Learn more
A wrap up of the charts catching our eye over the past month.
As the first month of 2024 comes to an end, we take a look at some of the biggest topics for the year ahead. Will ‘unloved’ regions like China be able to stage a comeback? Will the oil price remain resilient in the face of geopolitical tensions? And how are central banks’ higher interest rates impacting companies?
1 – Will the jaws close in 2024?
The divergence in performance between the US’ largest technology names and Chinese companies listed in the US – represented by the Nasdaq Golden Dragon China Index, which is dominated by China’s largest technology names – grew to 220% over the 12 months to 31 December 2023. Many investors are pondering what the next 12 months will hold and whether the US’ technology companies can continue to outperform, or if market breadth will improve and currently ‘unloved’ sectors and regions, like Chinese technology companies, can start to close this gap.
Chart 1: Total return of the US’ ‘Magnificent 7’ versus the Nasdaq Golden Dragon China Index
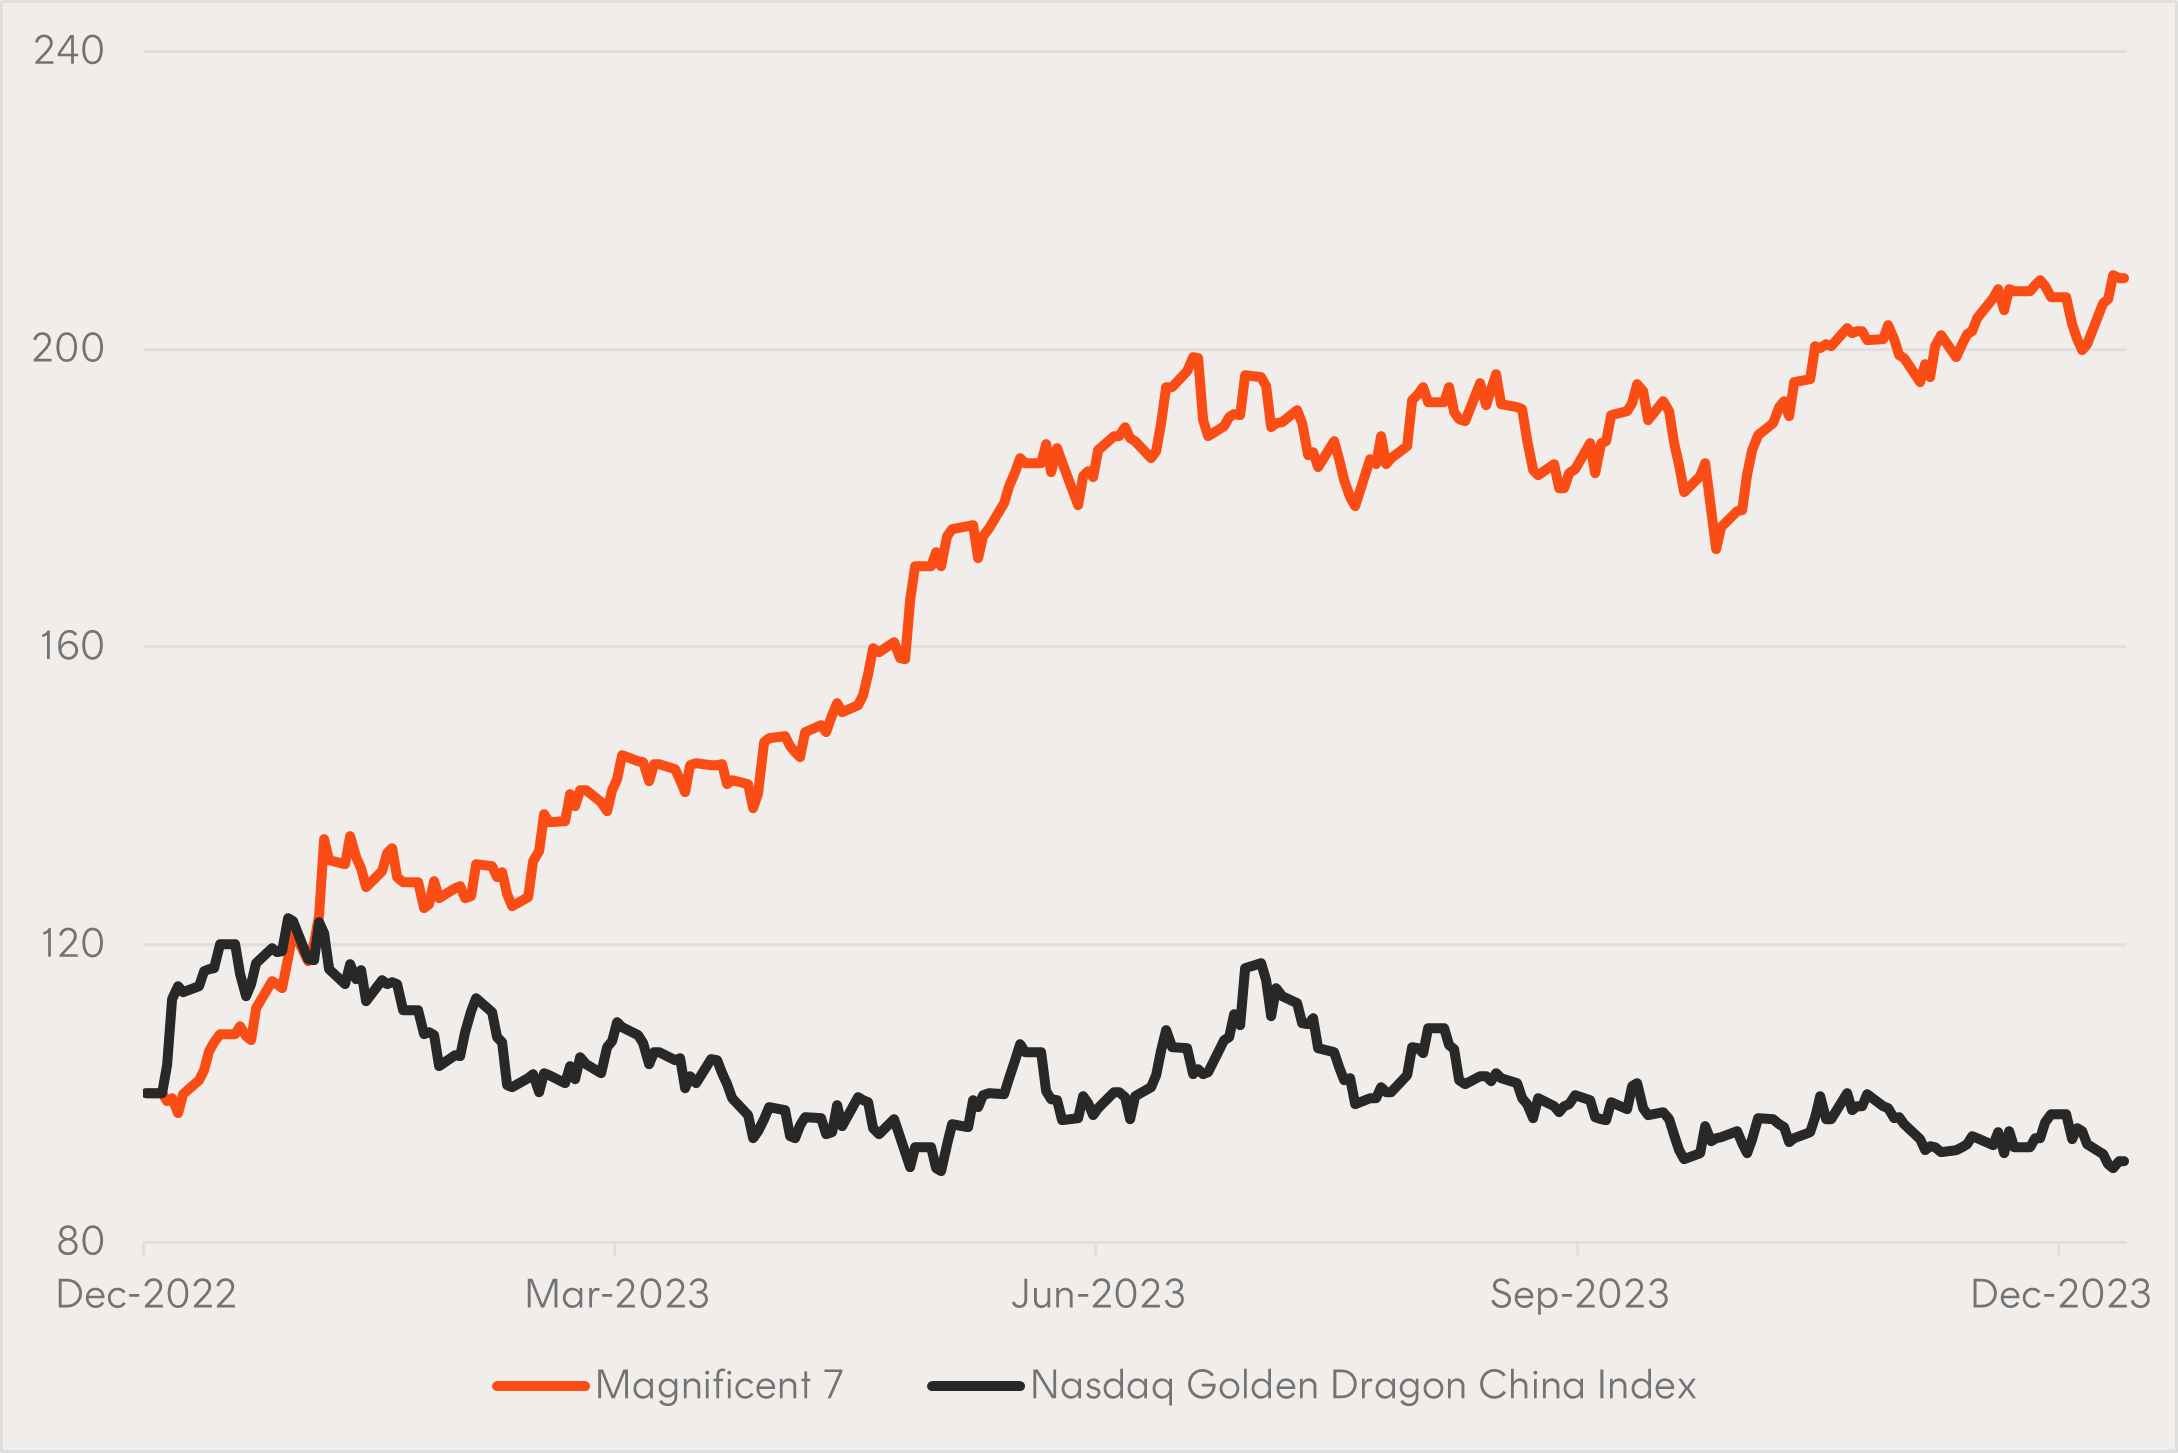
Source: Bloomberg. 31 December 2022 to 12 January 2024. You cannot invest directly in an index. Past performance is not an indicator of future performance.
Chart 2 – The US oil buffer
Incredible growth in petroleum production in the States has lessened pressure on global oil prices despite tensions in the Middle East. As of November 2023, US was producing one in five barrels of petroleum-related product globally.
Chart 2: US total consumption and production of petroleum
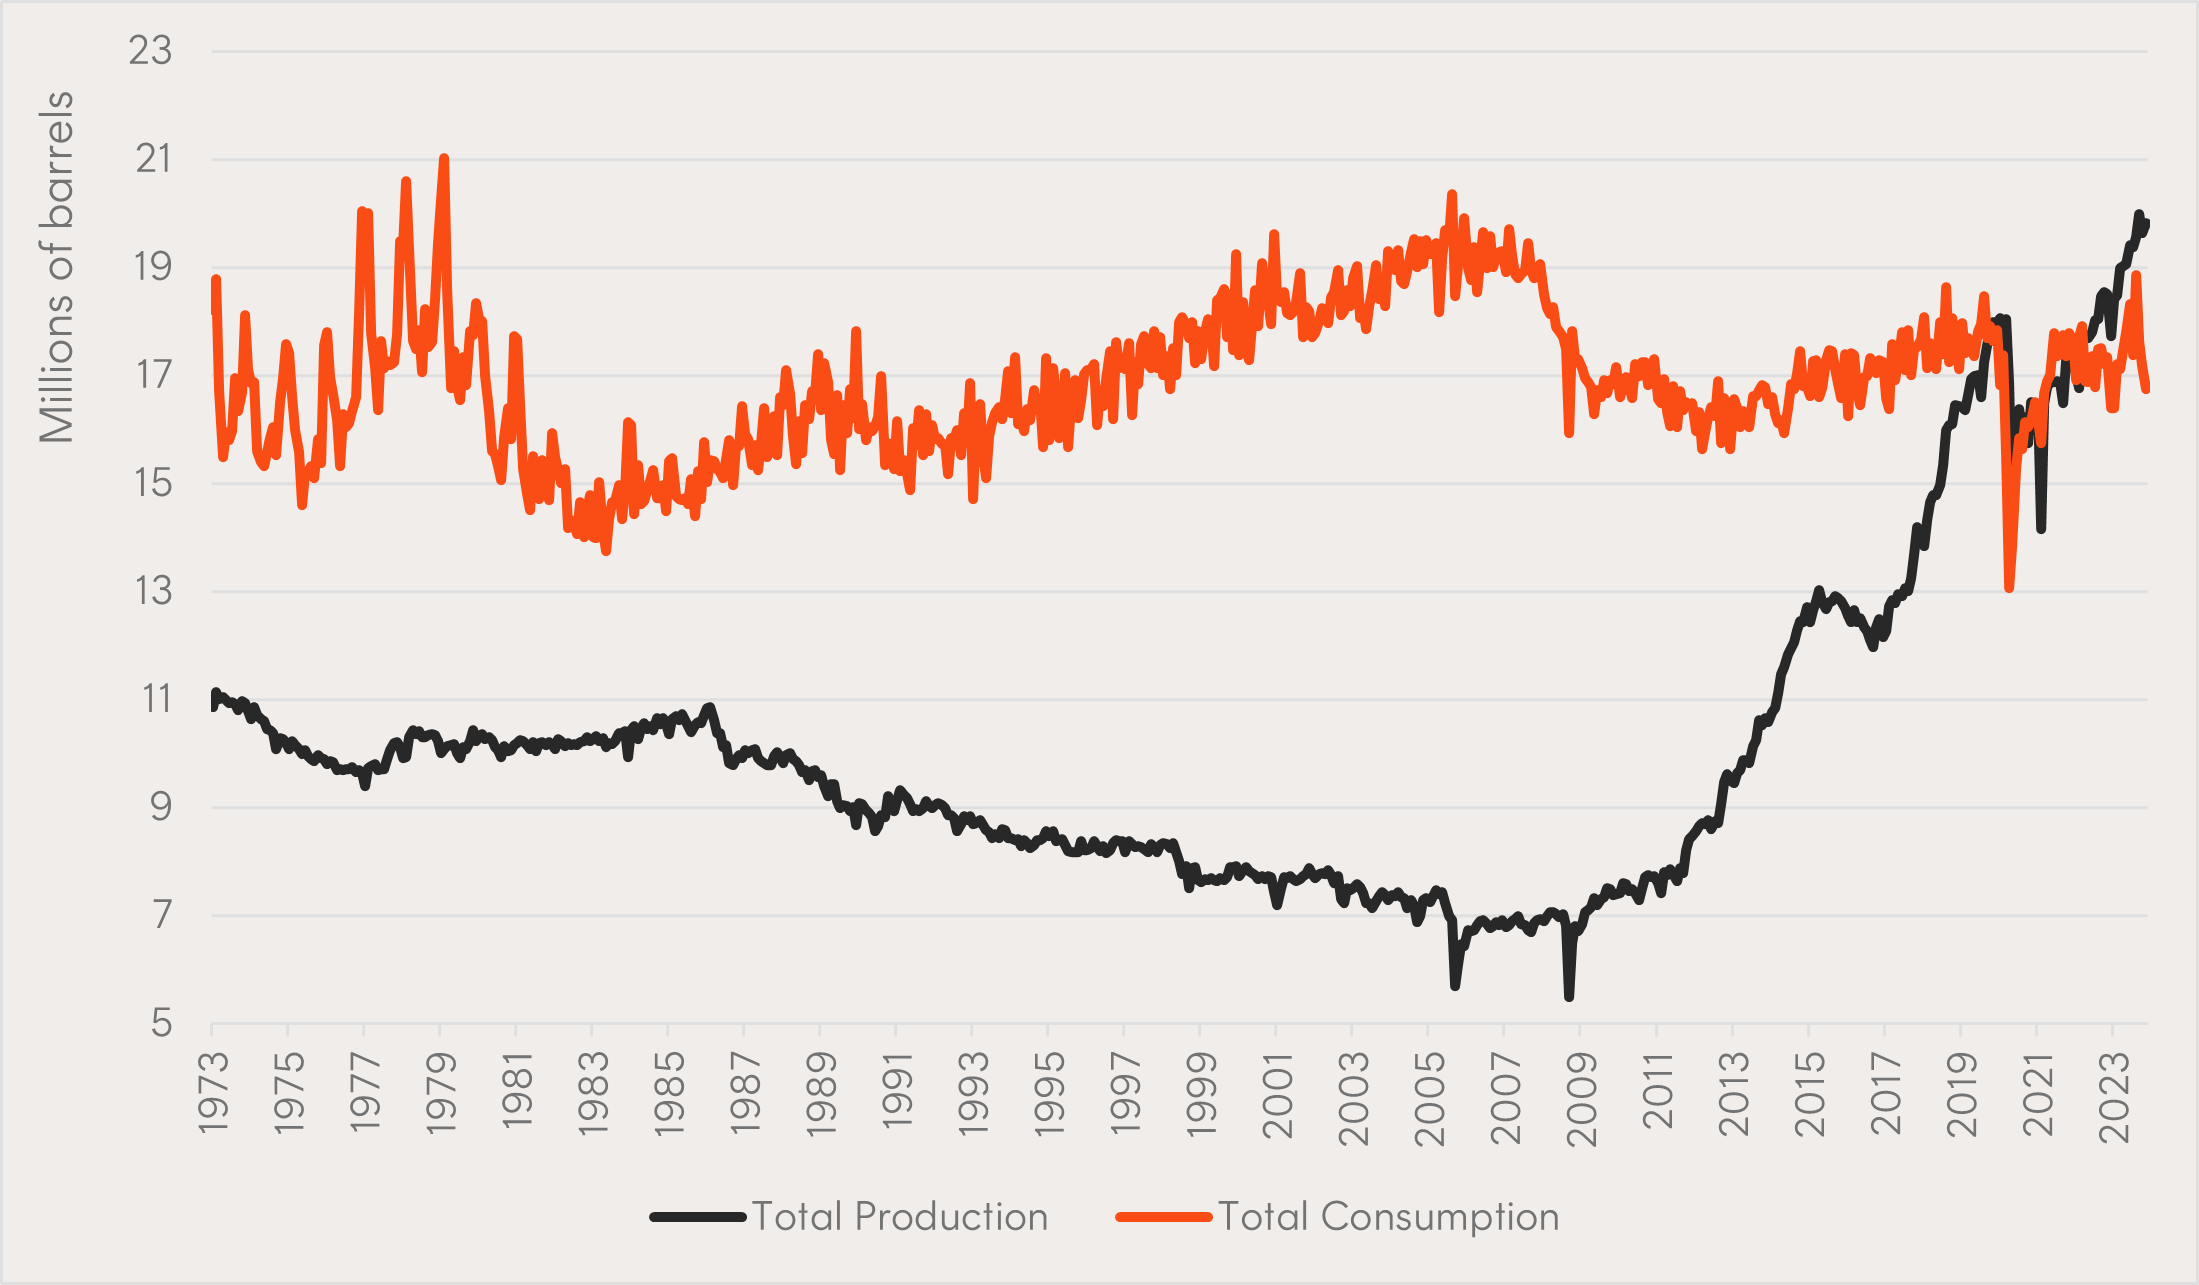
Source: US Energy Information Administration. November 2023. Including Biofuel and Processing Gains.
Chart 3 – India overtakes Hong Kong
For the first time, India’s stock market capitalisation has overtaken Hong Kong’s. The timing of this changing of the guard is appropriate in a year where much is being discussed about the future growth prospects of both India and China.
Chart 3: Market capitalisation of Indian and Hong Kong stock exchanges
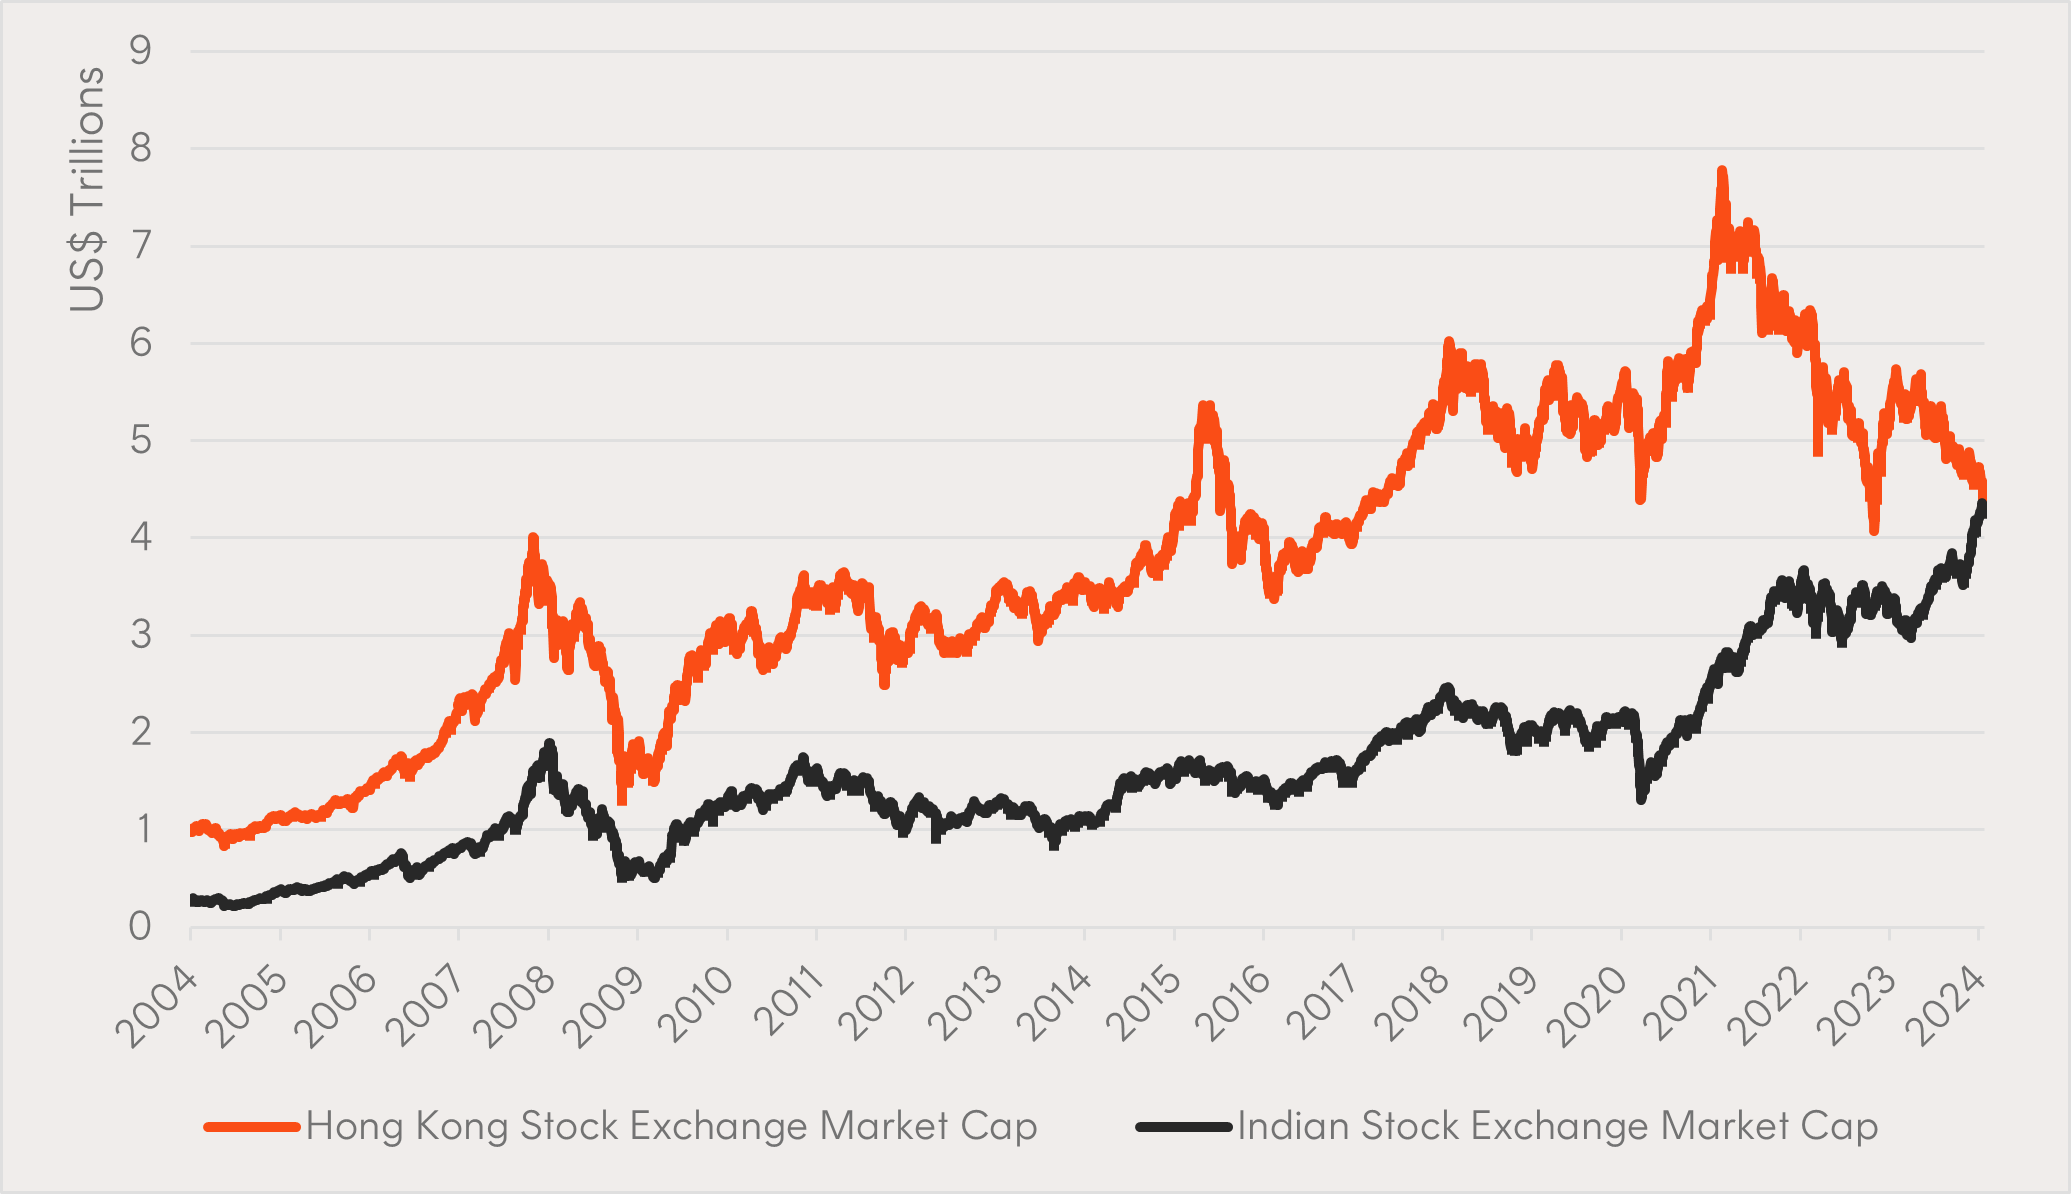
Source: Bloomberg. From 1 January 2004 to 22 January 2024.
Chart 4 – The reaction function
The outcome of the fastest rate hiking cycle in US history has surprised many, particularly the resilience the largest growth stocks have shown in a higher rate environment. At least one interesting factor in favour of these companies has been the minimal impact on borrowing costs, as many took out longer term loans when rates were low, dampening the effects of the Fed’s reaction function. Many of these companies also carry large amounts of cash, with the higher rates paid on this cash offsetting the higher interest expense.
Chart 4: Microsoft’s quarterly interest expense and the Fed Funds rate
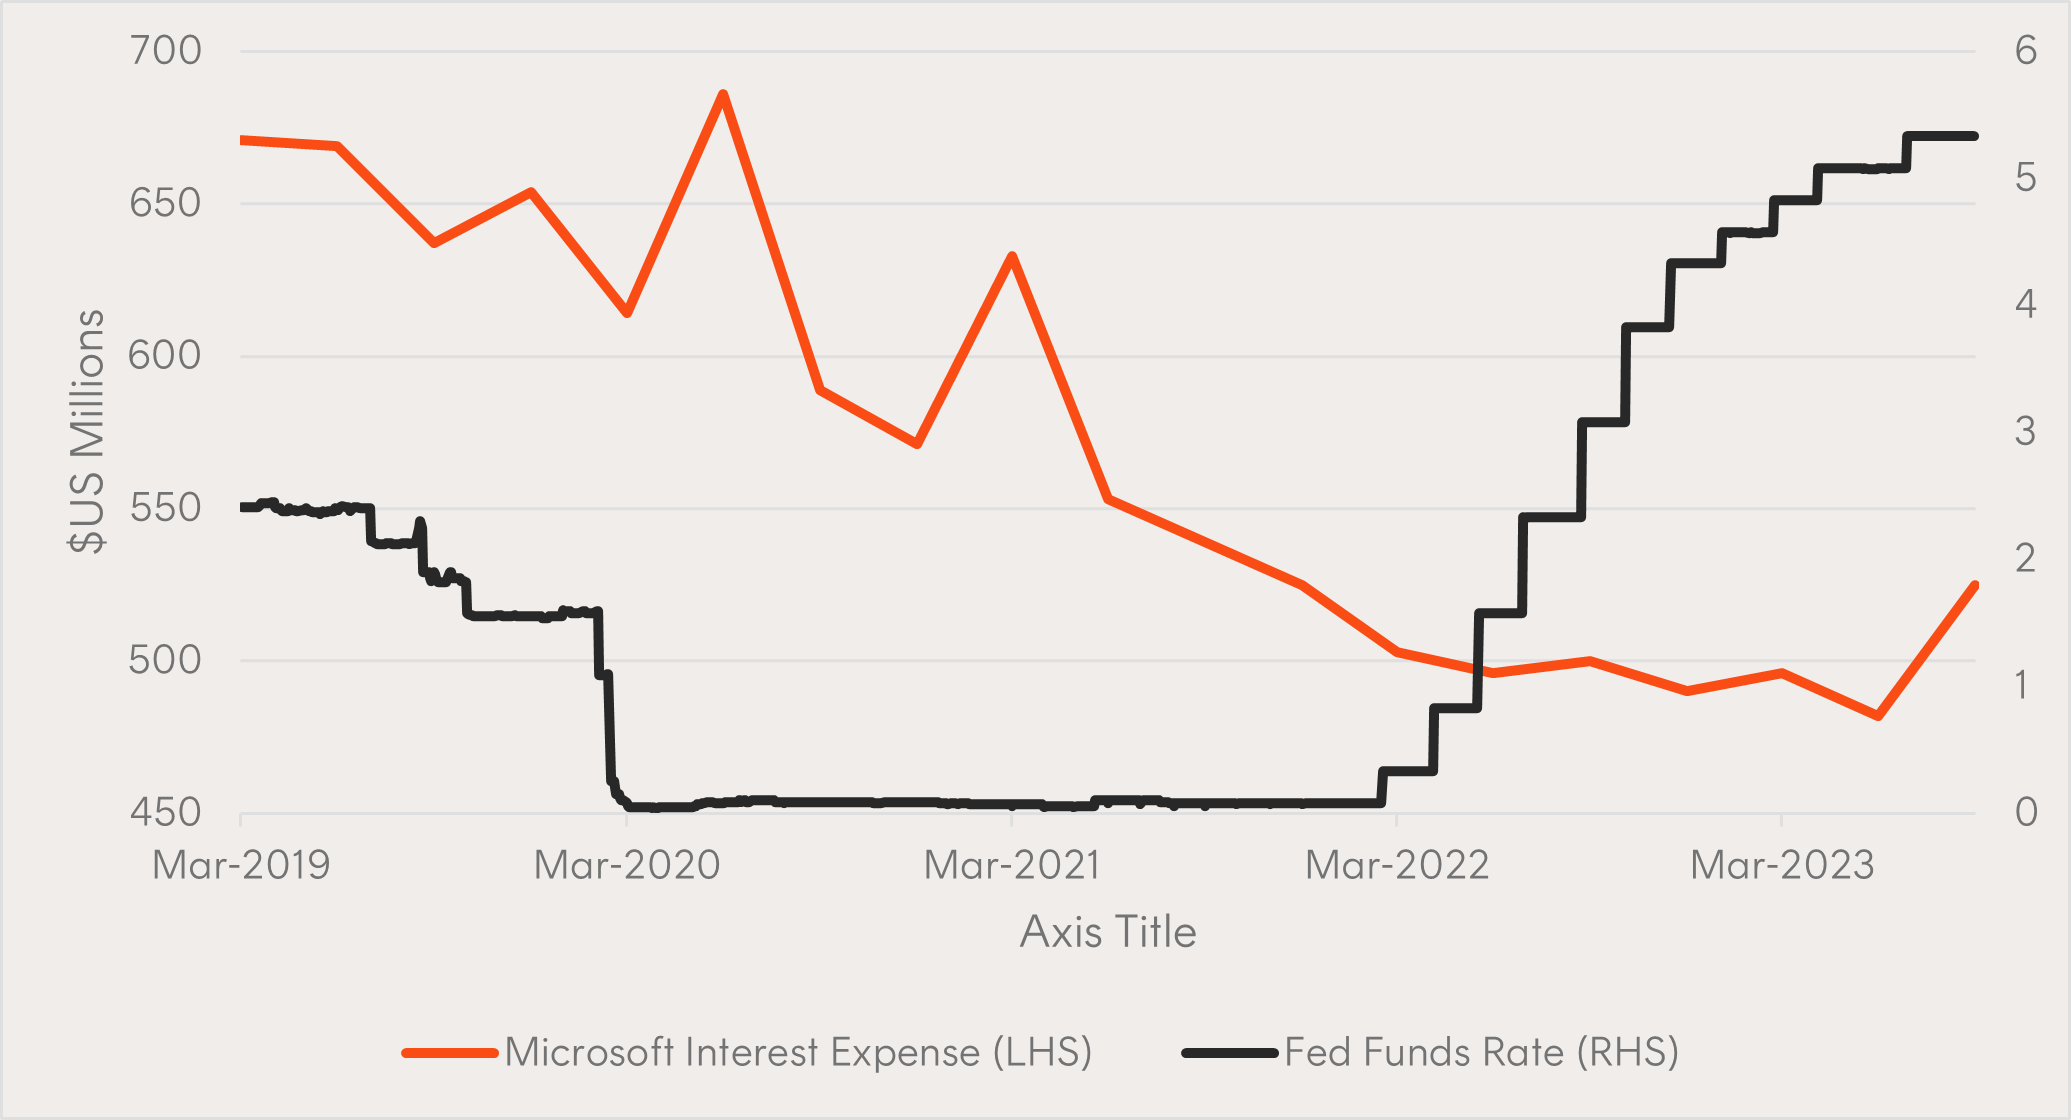
Source: Bloomberg
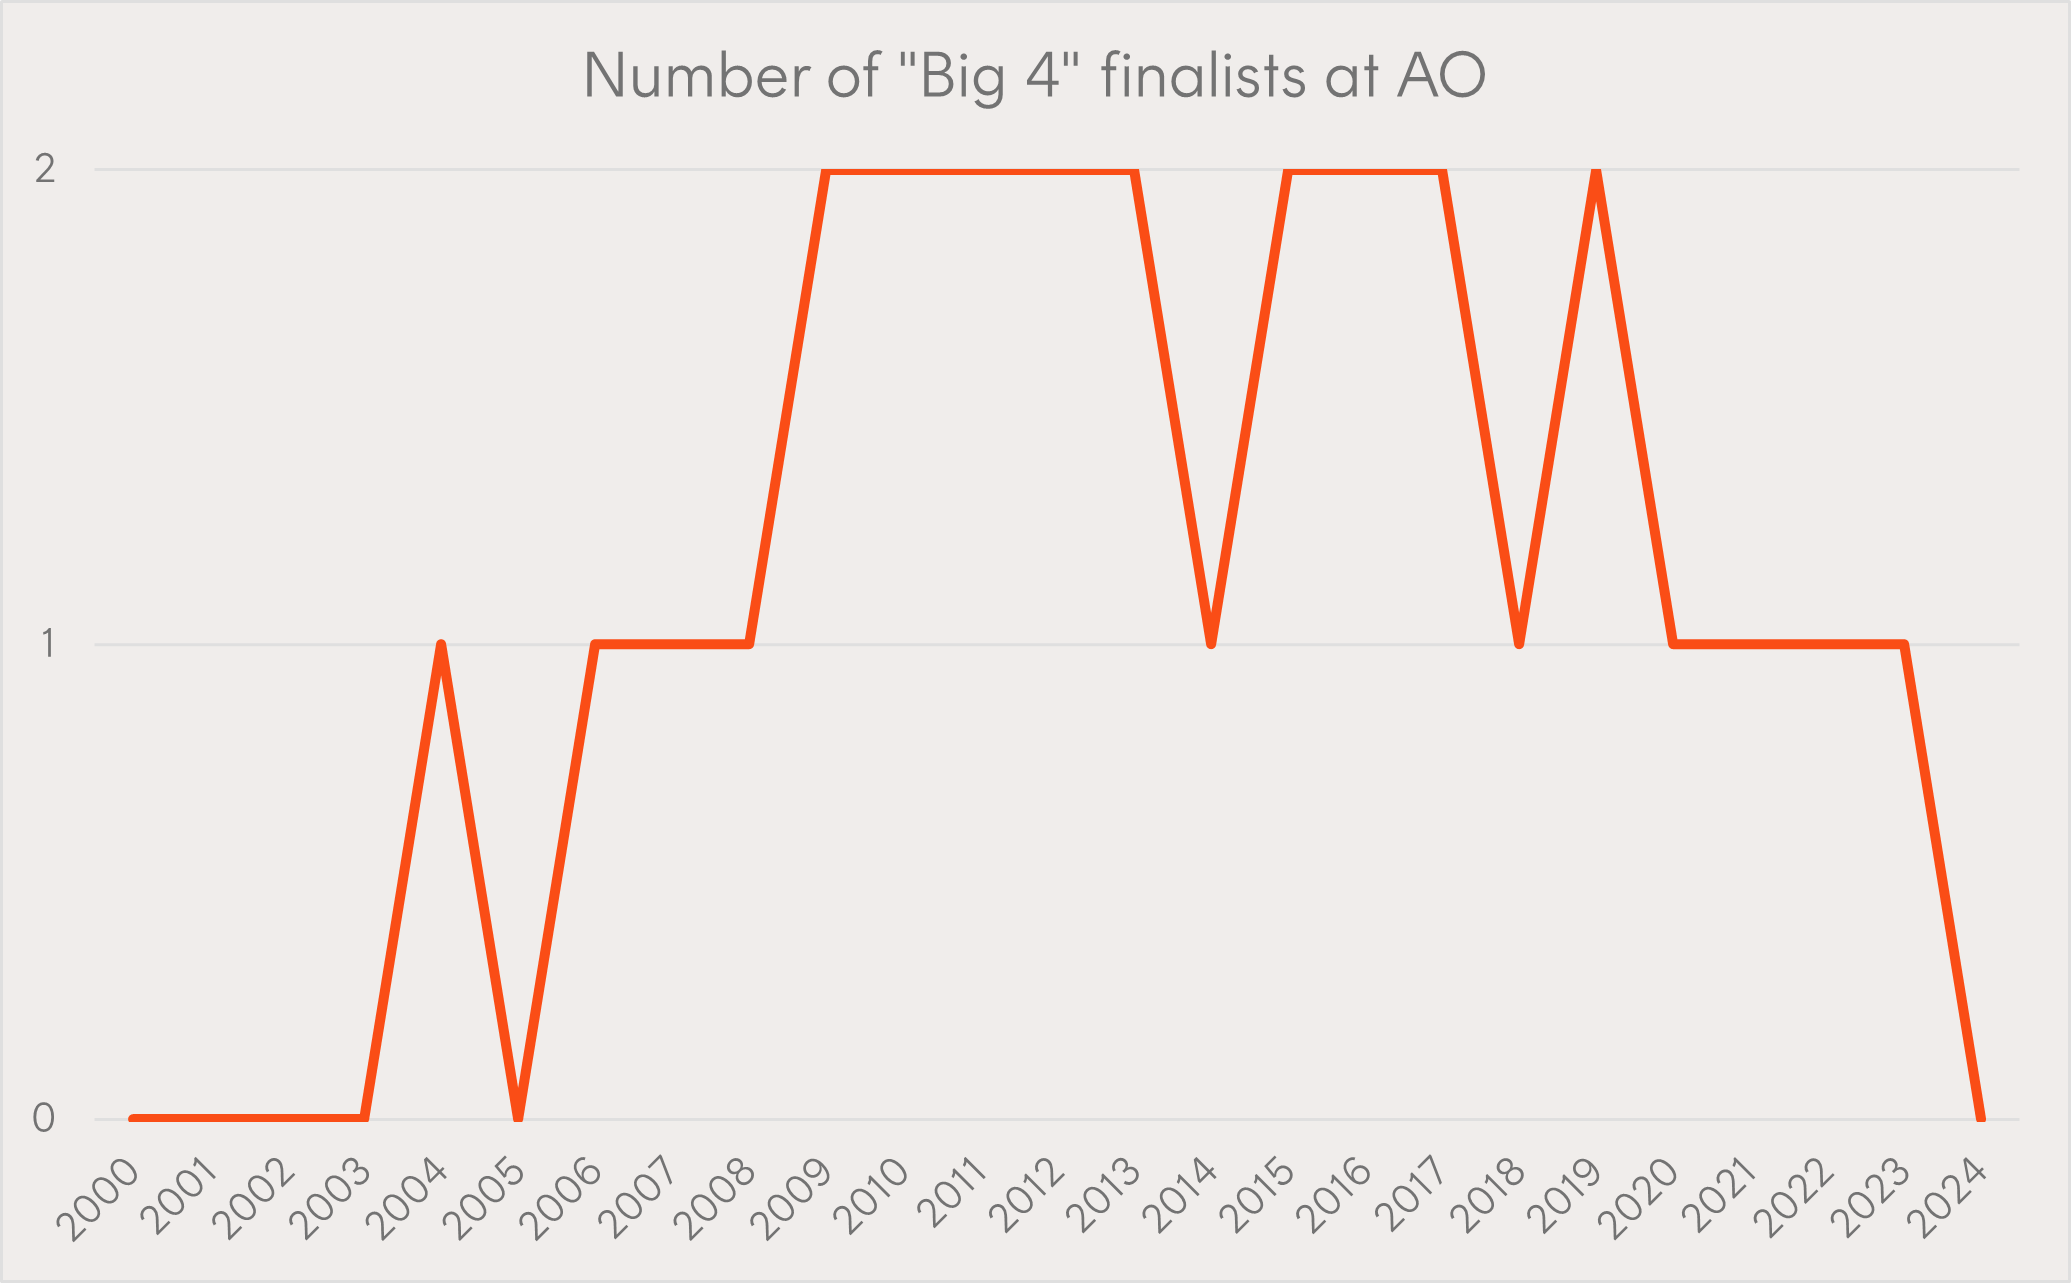
Chart 5 – A different kind of concentration
On the lighter side of charts we have enjoyed over the past month, this Australian Open final marked the first since 2005 that did not involve one of tennis’ ‘Big 4’ (for the non-tennis fans, that’s Federer, Nadal, Djokovic, and Murray). This got us thinking about market concentration and the tendancy for the largest companies in an index to change over time. Luckily these thoughts didn’t persist as long as the five-set match.
Chart 5: Number of “Big 4” finalists at the Australian Open
Betashares Direct
Invest in all ASX ETFs, and 500+ ASX-traded shares brokerage free. Automated investing. Low-cost managed portfolios. Create your account in minutes.

Explore
Markets