
Half Year Review 2022: NET INFLOWS REMAIN POSITIVE BUT MARKET FALLS CAUSE INDUSTRY DECLINE
Given market declines and overall investor caution we saw a far less buoyant Australian ETF industry in the first half of this year compared to the same time last year. Industry flows remained positive, albeit at lower levels than the first half of 2021, but were not sufficient to combat the market falls, leading the ETF industry’s FuM to decline. Read on for details, including best performers, asset flow categories and more.

CAGR: Compound Annual Growth Rate
Market cap
- Australian Exchange Traded Funds Market Cap: $124.3B
- Market cap change for month: -9%, -$12.6B
- Market cap growth for the last 12 months: 7%, + $8.6B
Comment: With falling sharemarkets acting as a head-wind, we saw industry funds under management decrease this half. The Australian ETF industry declined in size by 9% for the half, to end the financial year at $124.3B. Industry FuM declined ~$12.5B, all of which was attributable to market declines (given positive net flows).
New money
- Net new money for half year: +$6.2B
Comment: Given the market conditions, and negative investor sentiment, industry flows were respectable, with net new money for the half year of $6.2B. This was some 30% less when compared to the $8.8B of net flows received in the first half of 2021.
Products
- 299 Exchange Traded Products trading on the ASX.
- New/closed products: 23 new products launched in the half year (compared to 15 in first half 2021), 2 products matured, 2 products closed.
- 9 new issuers joined the market, 7 of which were Active Managers, 2 specialist crypto ETF issuers. There are currently 40 issuers of ETPs in Australia.
- The first cryptocurrency ETFs came onto the market this half (in May), albeit to muted inflows – it will be fascinating to see whether this category becomes meaningful over time.
Trading value
- Trading value for this half was a full 45% higher than the first half of 2021, illustrating the extent to which ETFs are increasingly being used to express investor views, particularly during periods of extended market volatility.
Performance
- Best performing exposures for the half year came, unsurprisingly given the market falls, from geared short U.S. equity exposures, including the geared short Nasdaq fund, and the Strong US Bear Fund (BBUS), which returned ~55% for the half. Next best performers were exposures to energy, including Crude Oil (OOO) and Global Energy Companies (FUEL), returning ~52% and 22% respectively.
Top 5 Category inflows (by $) – First half of 2022
| Category | Inflow Value |
| Australian Equities | $2,947,255,965 |
| International Equities | $1,659,356,059 |
| Fixed Income | $1,397,931,334 |
| Multi-Asset | $517,073,008 |
| Listed Property | $288,528,428 |
Comment: The first half of 2022 saw a notable reduction in flows into International Equities products, which typically have been the largest contributor to industry flows, with investors seemingly cautious to allocate heavily to overseas sharemarkets.
Top Category outflows (by $) – First half of 2022
| Category | Inflow Value |
| Cash | ($867,890,985) |
| Short | ($29,548,110) |
Top Sub-Category inflows (by $) – First half of 2022
| Sub-Category | Inflow Value |
| Australian Equities – Broad | $2,219,255,653 |
| Australian Bonds | $1,157,498,871 |
| Multi-Asset | $517,073,008 |
| International Equities – US | $481,999,160 |
| International Equities – Ethical | $378,977,897 |
Top Sub-Category outflows (by $) – First half of 2022
| Category | Inflow Value |
| Cash | ($867,890,985) |
| Oil | ($55,005,798) |
| Australian Equities – Short | ($17,594,855) |
| US Equities – Short | ($11,953,254) |
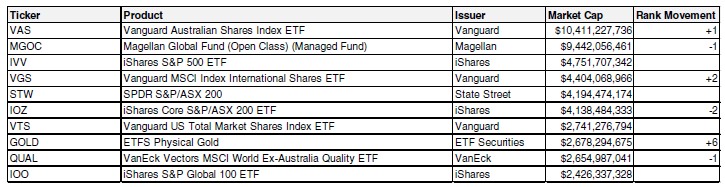
Top 10 Products – First half of 2022
Top Performing Products – First half of 2022
| Product Name | Performance |
| ETFS Ultra Short Nasdaq 100 Hedge Fund (SNAS) | 78.2% |
| BetaShares US Equities Strong Bear Currency Hedged (Hedge Fund) (BBUS) |
55.3% |
| BetaShares Crude Oil Index ETF-Currency (OOO) | 52.4% |
| BetaShares Global Energy Companies ETF (FUEL) | 21.8% |
| BetaShares Australian Strong Bear (Hedge Fund) (BBOZ) | 18.2% |
Industry Forecast: At the end of 2021 (when the industry was $137B), we forecast the industry to end 2022 at $180-$190B. Given the changed economic conditions and overall market sentiment, we revise our forecasts significantly downward and now expect total industry FuM at end 2022 to be in the range of $135-$140B, noting of course this result is highly dependent on price levels in the global and Australian sharemarkets.
Investor & founder with a Financial Services & Fintech focus. Co-founder of Betashares. Passionate about entrepreneurship and startups.
Read more from Ilan.