
Tom Wickenden
9 minutes reading time
For convenience, in this article “ETFs” refers collectively to all exchange tradeable funds available in the market, whether passively or actively managed, including products labelled “ETF”, “Managed Fund” and “Active ETF”.
2023 marked 22 years since the first two exchange traded funds (ETFs), tracking the S&P/ASX 50 and S&P/ASX 200 indexes, were incepted in Australia.
The industry has experienced remarkable growth since. From $100,000 of assets under management (AUM) in the first month, to $5B in the first 10 years, and standing at over $150B today. With more than 350 ETFs now available in Australia covering all major asset classes many might be wondering how the ETF we got here?
In this time Betashares has become a market leader currently serving over 1 million or 10% of all Australian investors. As we celebrate a milestone of $30B in AUM we look back at what has driven growth in Australia’s ETF industry over the past two decades.
Chart 1: Australian ETF industry AUM ($B): Jul 01 – Aug 23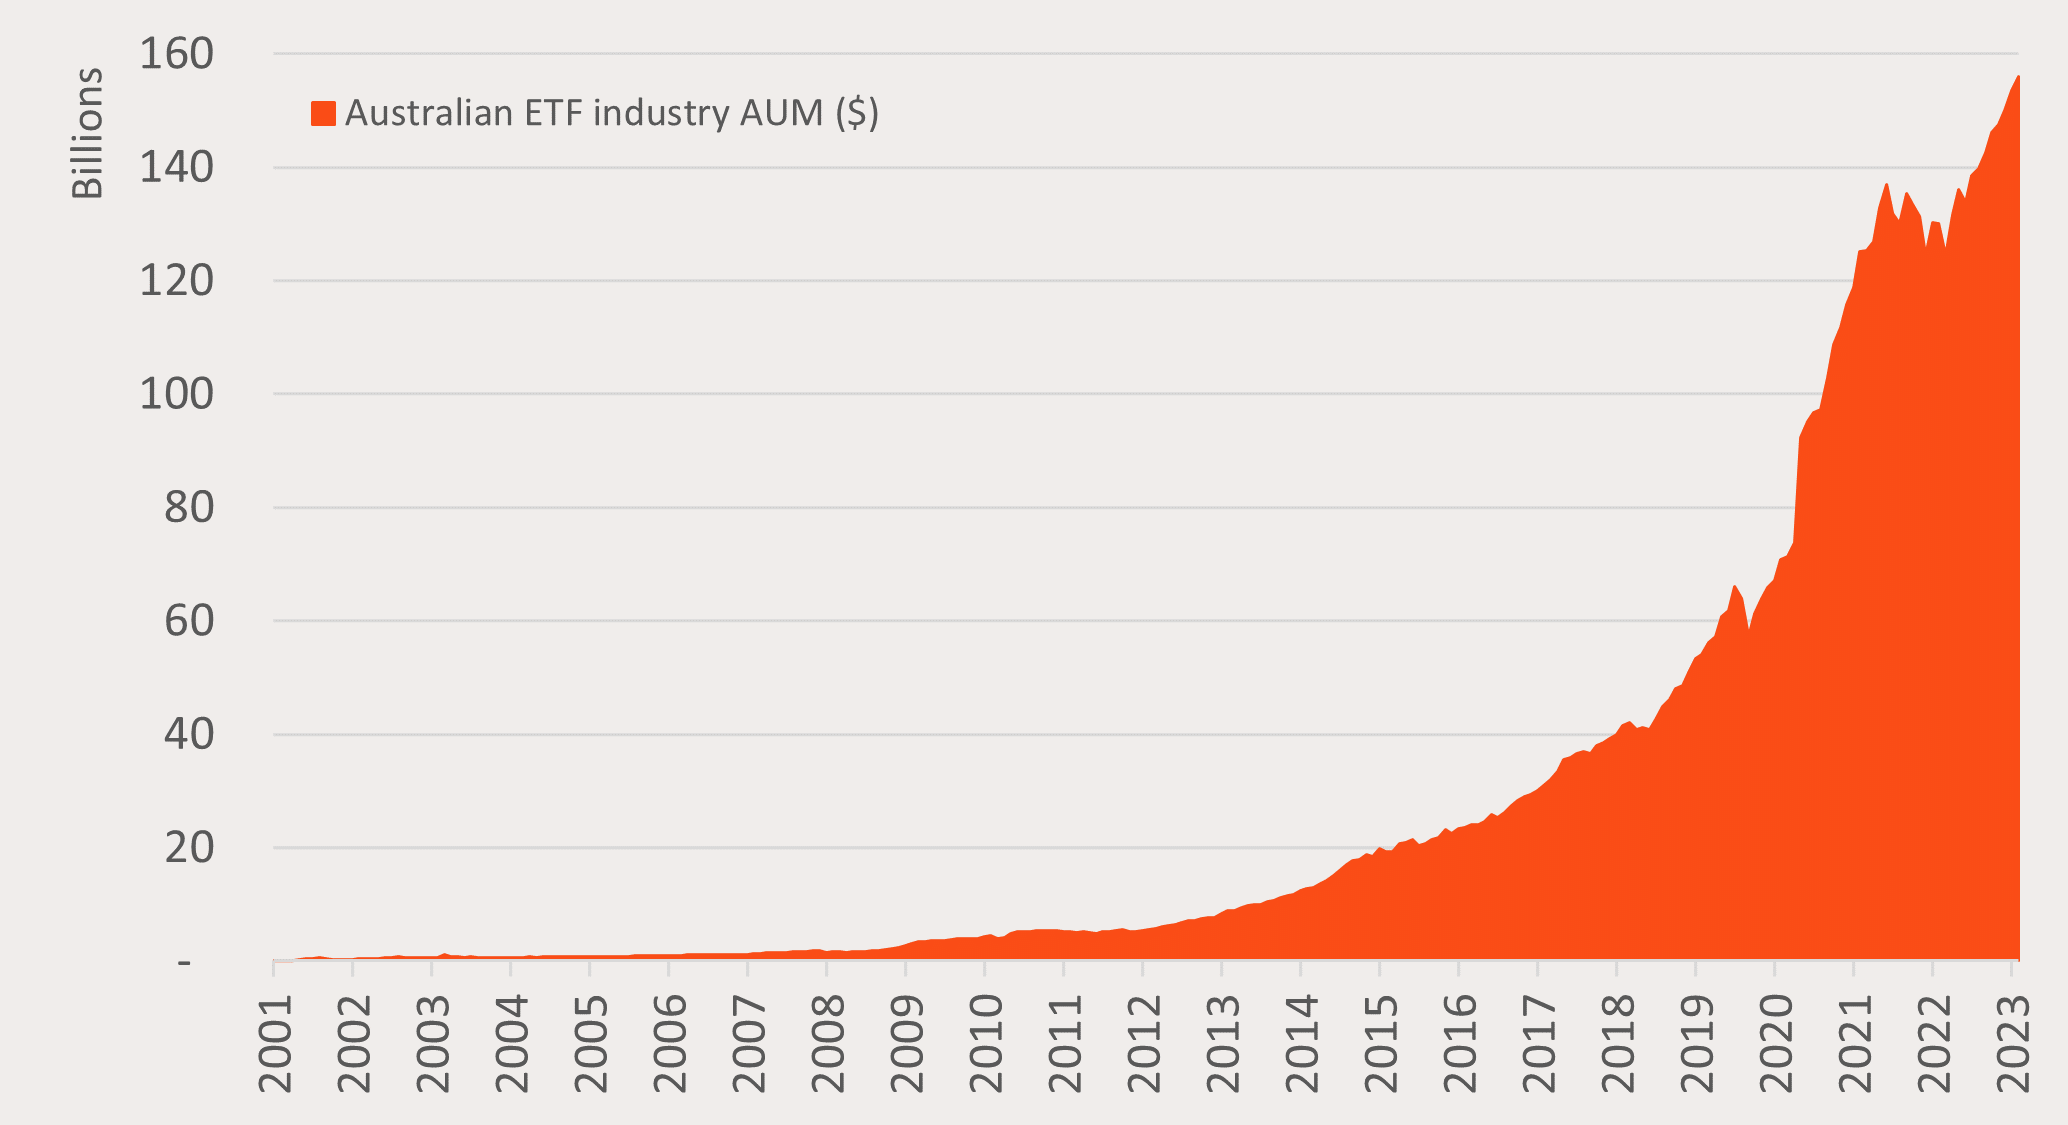
Source: ASX, CBOE, Betashares.
The bedrock of Australia’s ETF industry – Core equity index ETFs
The growth of ETFs globally has been synonymous with the popularisation of low-cost, broad benchmark equity index investing. Australia’s story has been no different.
A greater understanding of the benefits of broad market benchmark index investing through research and education, such as S&P’s SPIVA reports, came at a similar time to the creation of ETFs. The marrying of these investing advancements provided investors with easy-to-transact, low-cost access to diversified portfolios. This style of ETF, tracking broad equity market benchmarks, remains the most popular today.
Of the 10 largest ETFs in Australia today eight could be classified as ‘core equity index funds’1. These eight alone account for $45B or 30% of the total AUM in Australian ETFs. Funds like Betashares A200 Australia 200 ETF and NDQ Nasdaq 100 ETF feature in this list.
In total there are 24 core equity index ETFs in the Australian market accounting for $60B or 40% of total industry AUM. While this is still by far the largest category, that number was closer to 60% in 2011 as other types of ETFs have helped to drive industry growth since2.
Chart 2: Core equity index ETF AUM and Australian ETF industry AUM: Oct 2011 to Aug 23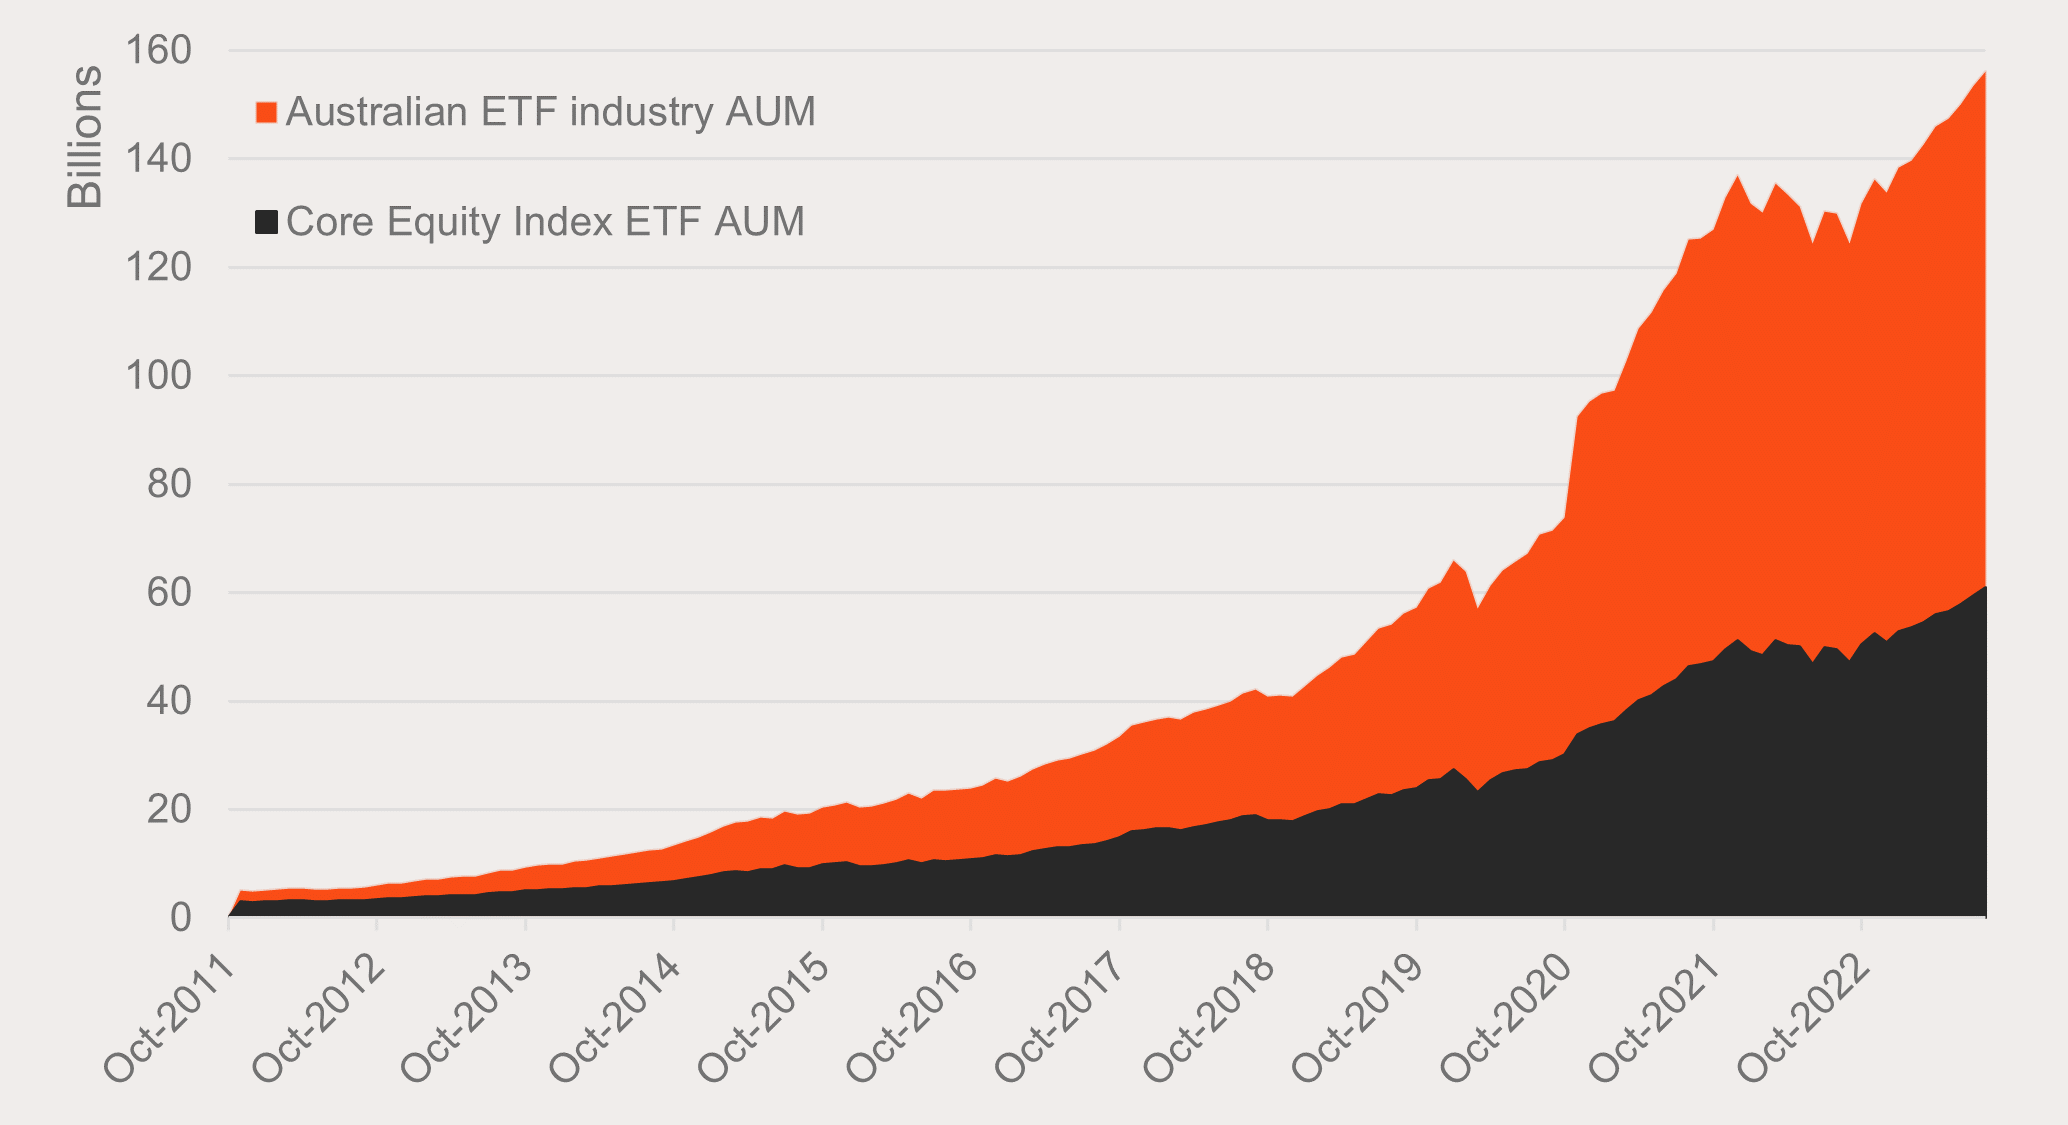
Source: ASX, CBOE, Betashares.
A new era – Fixed income ETFs
The last time the Australian 10-year government bond yield was 4.5% p.a. there were no cash or fixed income ETFs listed in Australia. Today there are 53.
As fixed income markets enter this new era the availability of fixed income ETFs for Australian investors has seen a noticeable trend in investor preferences. Over the 18 months to August 2023, cash and fixed income ETFs saw $8B in inflows while unlisted fixed income funds saw $12B in outflows3.
Chart 3: ETF and unlisted fixed income monthly net flows: Mar 22 to Aug 23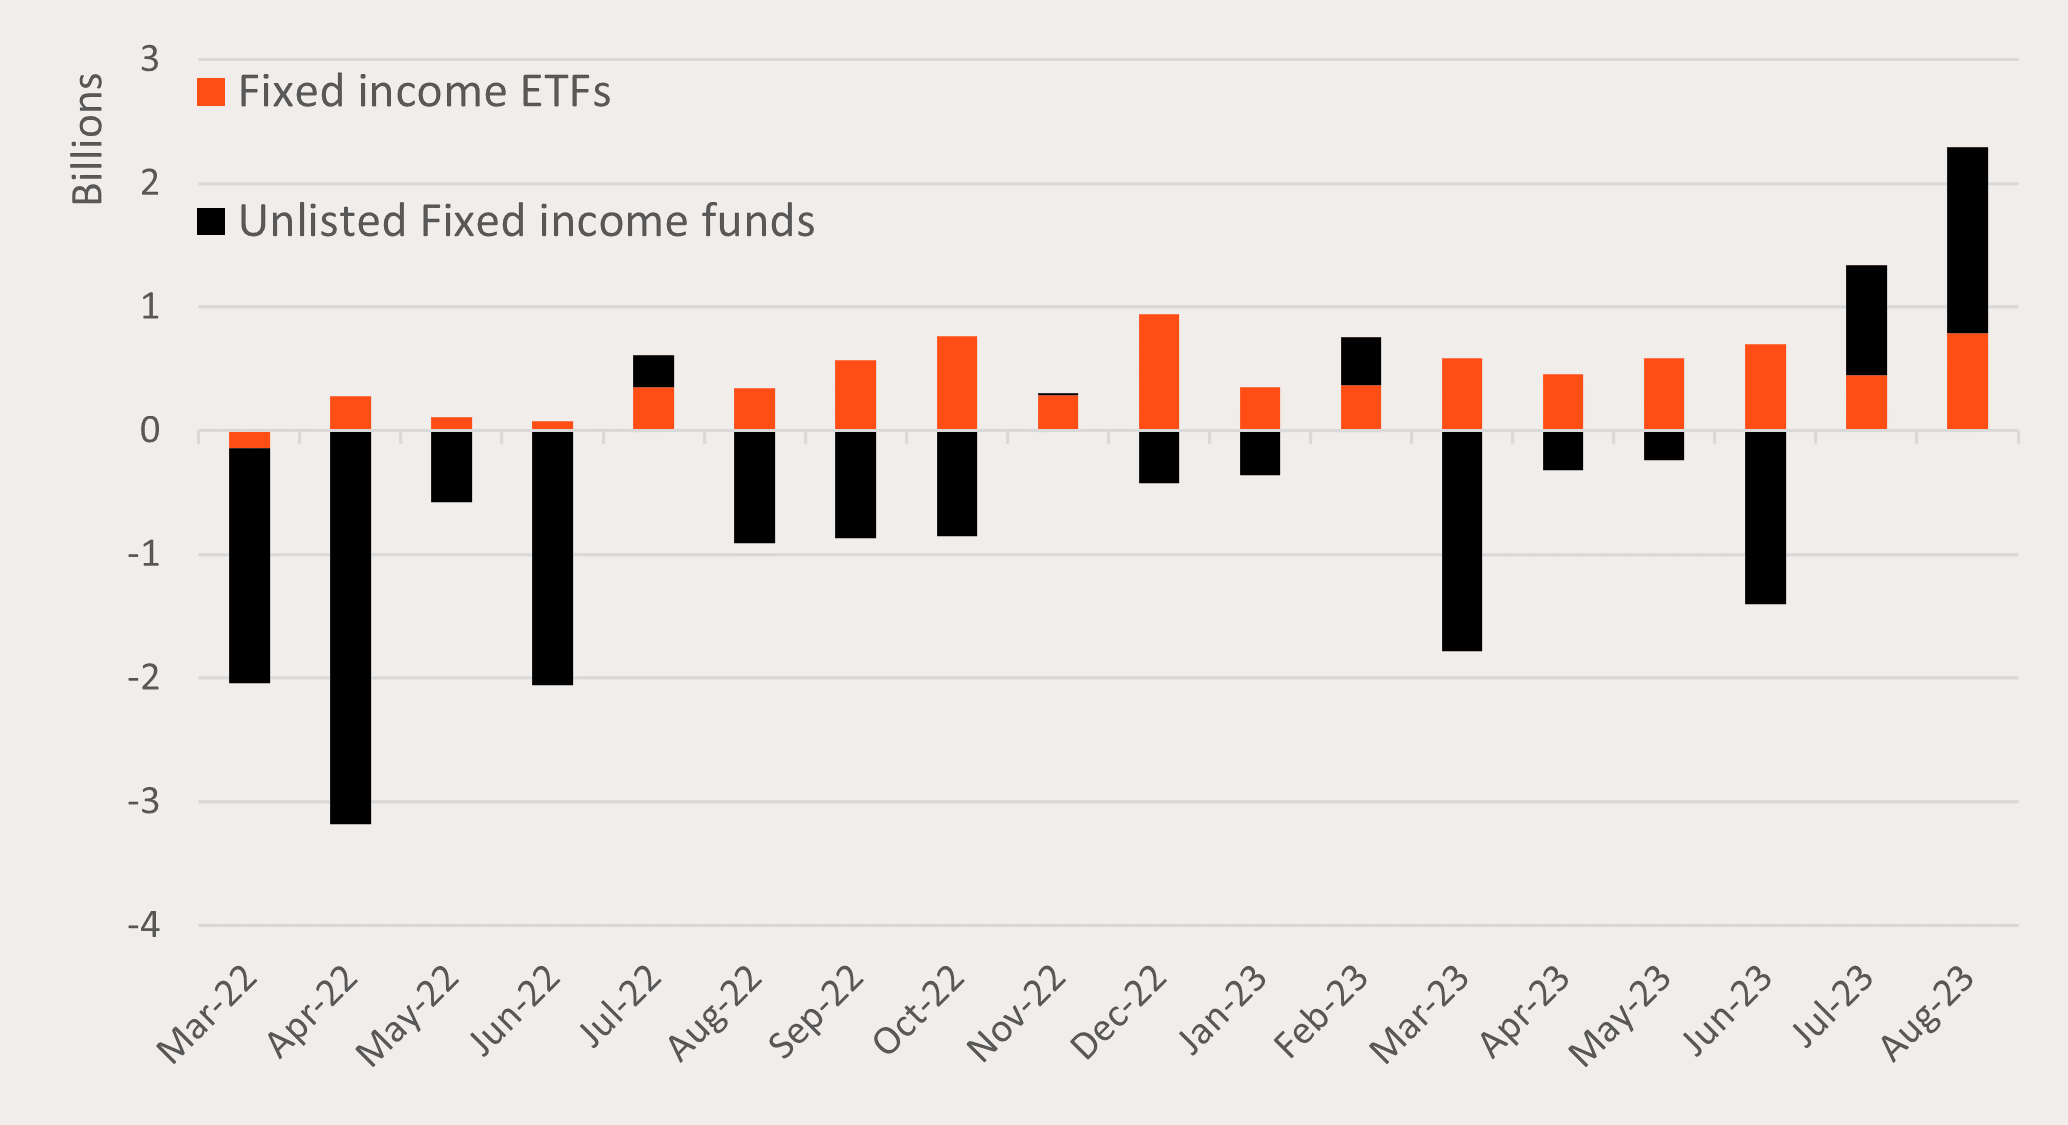
Source: Morningstar. Defined by Morningstar universe of listed and open-ended funds defined as ‘money market’ and ‘fixed income’. March 2022 to August 2023.
These flows have driven growth in Australia’s ETF industry over the past 12 months as cash and fixed income ETFs accounted for 56% of industry net flows4.
Fixed income is an asset class that has also been central to Betashares’ growth. Our suite of cash, fixed income and hybrid ETFs is market leading in number (13 funds) and AUM (39% of Australia’s fixed income ETF AUM), leading all ETF providers in fixed income net flows over this same 12 month time period5.
Teaching an old dog new tricks – Active ETFs
Active ETFs account for 15% of Australia’s ETF AUM making them the second largest category behind core equity index ETFs.
The growth behind active ETF AUM has been unique in that 90% of this amount has come on conversion of existing unlisted active funds to the ETF structure. The remaining 10% coming from net flows.
It appears active managers with unlisted funds are noticing the efficiencies the ETF structure offers and seeing the significant inflows into the industry. However, an active fund converting from unlisted to the ETF structure has not alone been enough to drive inflows.
In fact, despite the number of active ETFs more than doubling over the past three years from 35 to 82, this category has actually seen net outflows over this period of $2b (excluding conversion AUM).
There are still active funds that have seen success in the ETF structure. For example, Betashares HBRD Australian Credit Income Active ETF has grown to be one of our largest funds at over $2B.
Chart 4: Growth of active ETFs in Australia: Nov 2011 to Aug 2023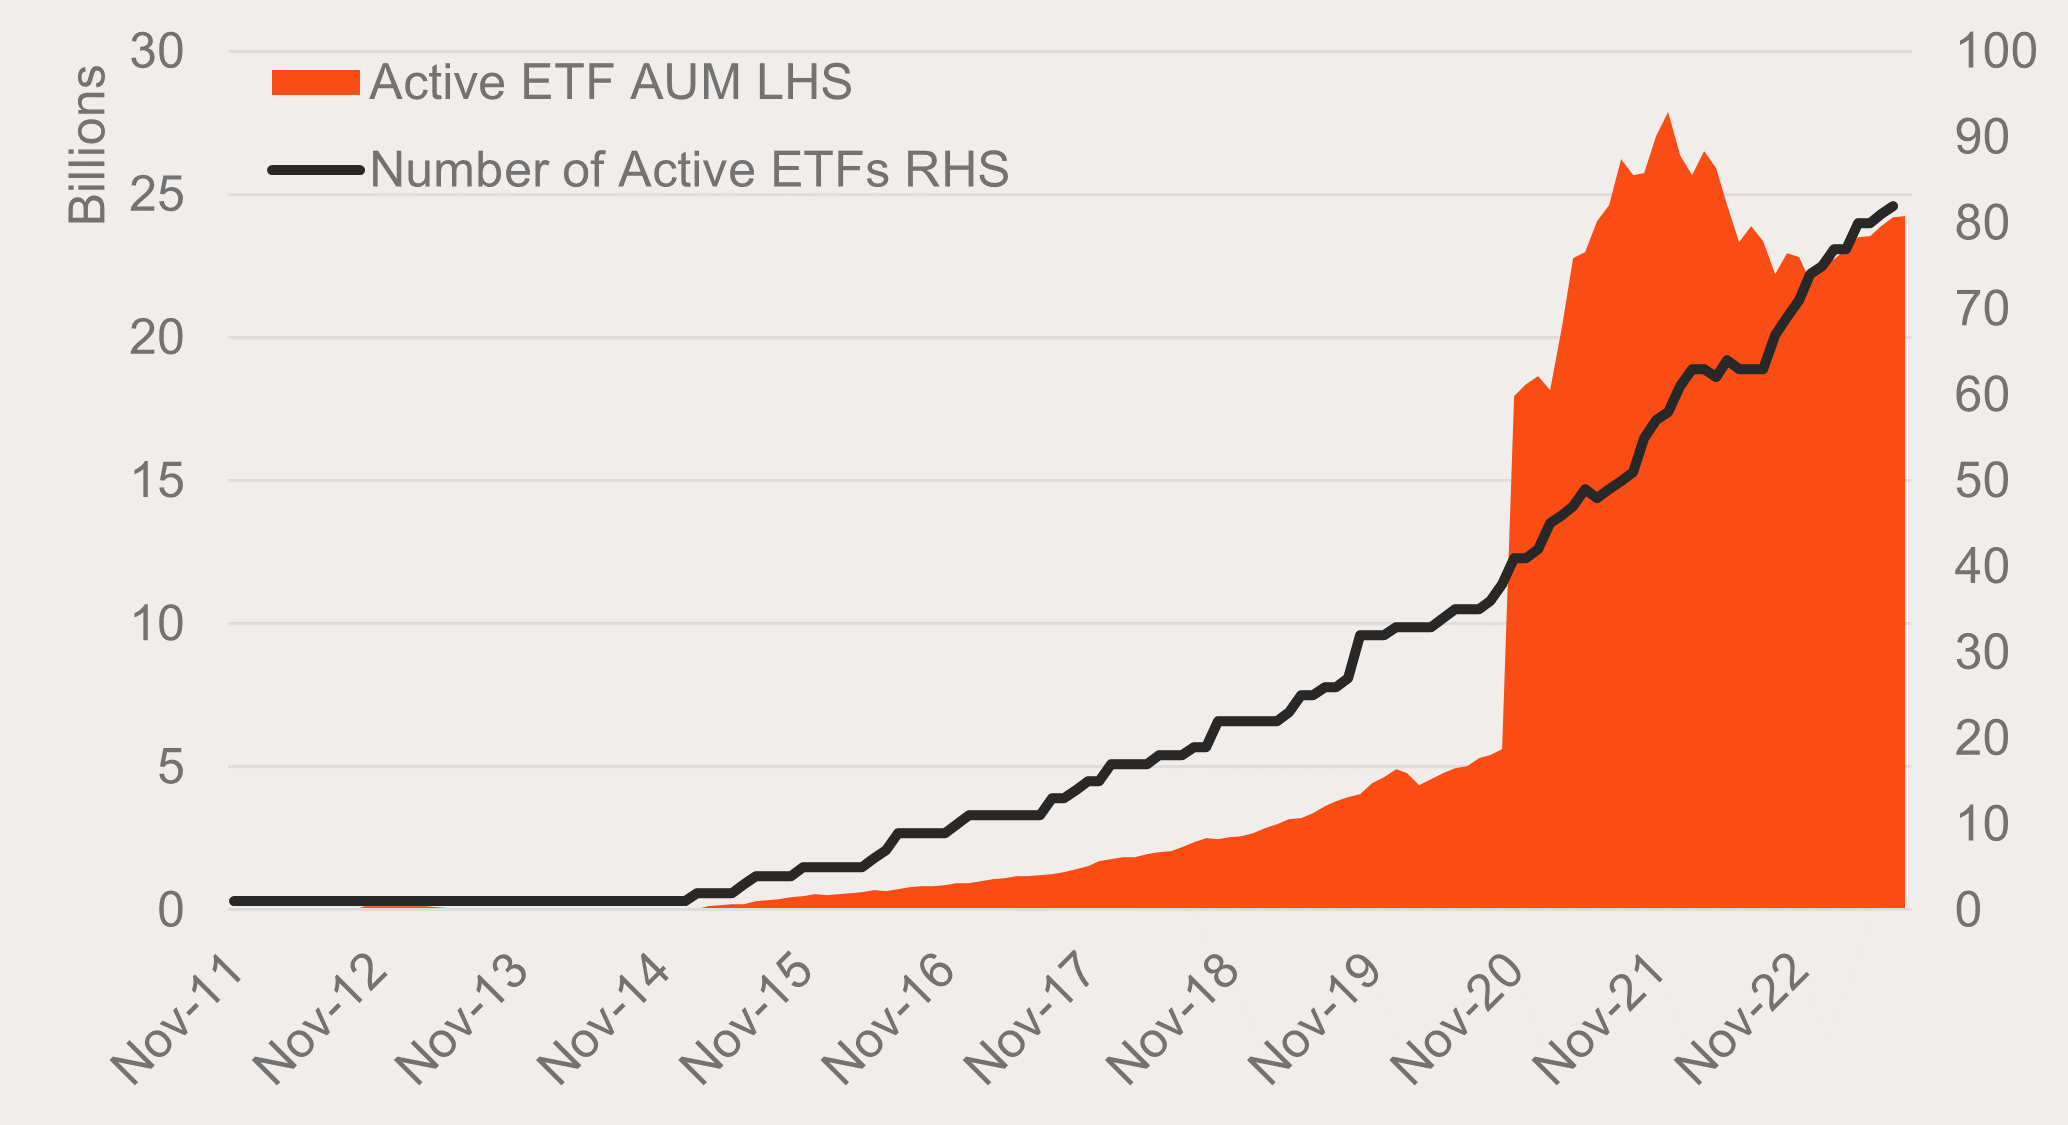
Source: ASX, CBOE, Betashares.
Australian ETFs’ green shoots – ESG ETFs
One of the biggest trends in the investment landscape over the past five years has been the focus on environmental, social and governance (ESG) aligned investing.
While there are many ways to quantify this trend, the growth in the number of ESG ETFs in Australia is very telling. Over the past four years, the number of ESG-related ETFs, including passive and active funds with ESG screens, climate impact funds, and ESG-related thematic exposures, has grown from 16 to 576.
Over the same period, ESG ETFs have more than tripled their share of Australia’s total ETF AUM (from 2% in 2019 to 7% in August 2023)7.
Chart 5: Growth of Australian ESG ETF AUM: Jan 2015 to Aug 2023
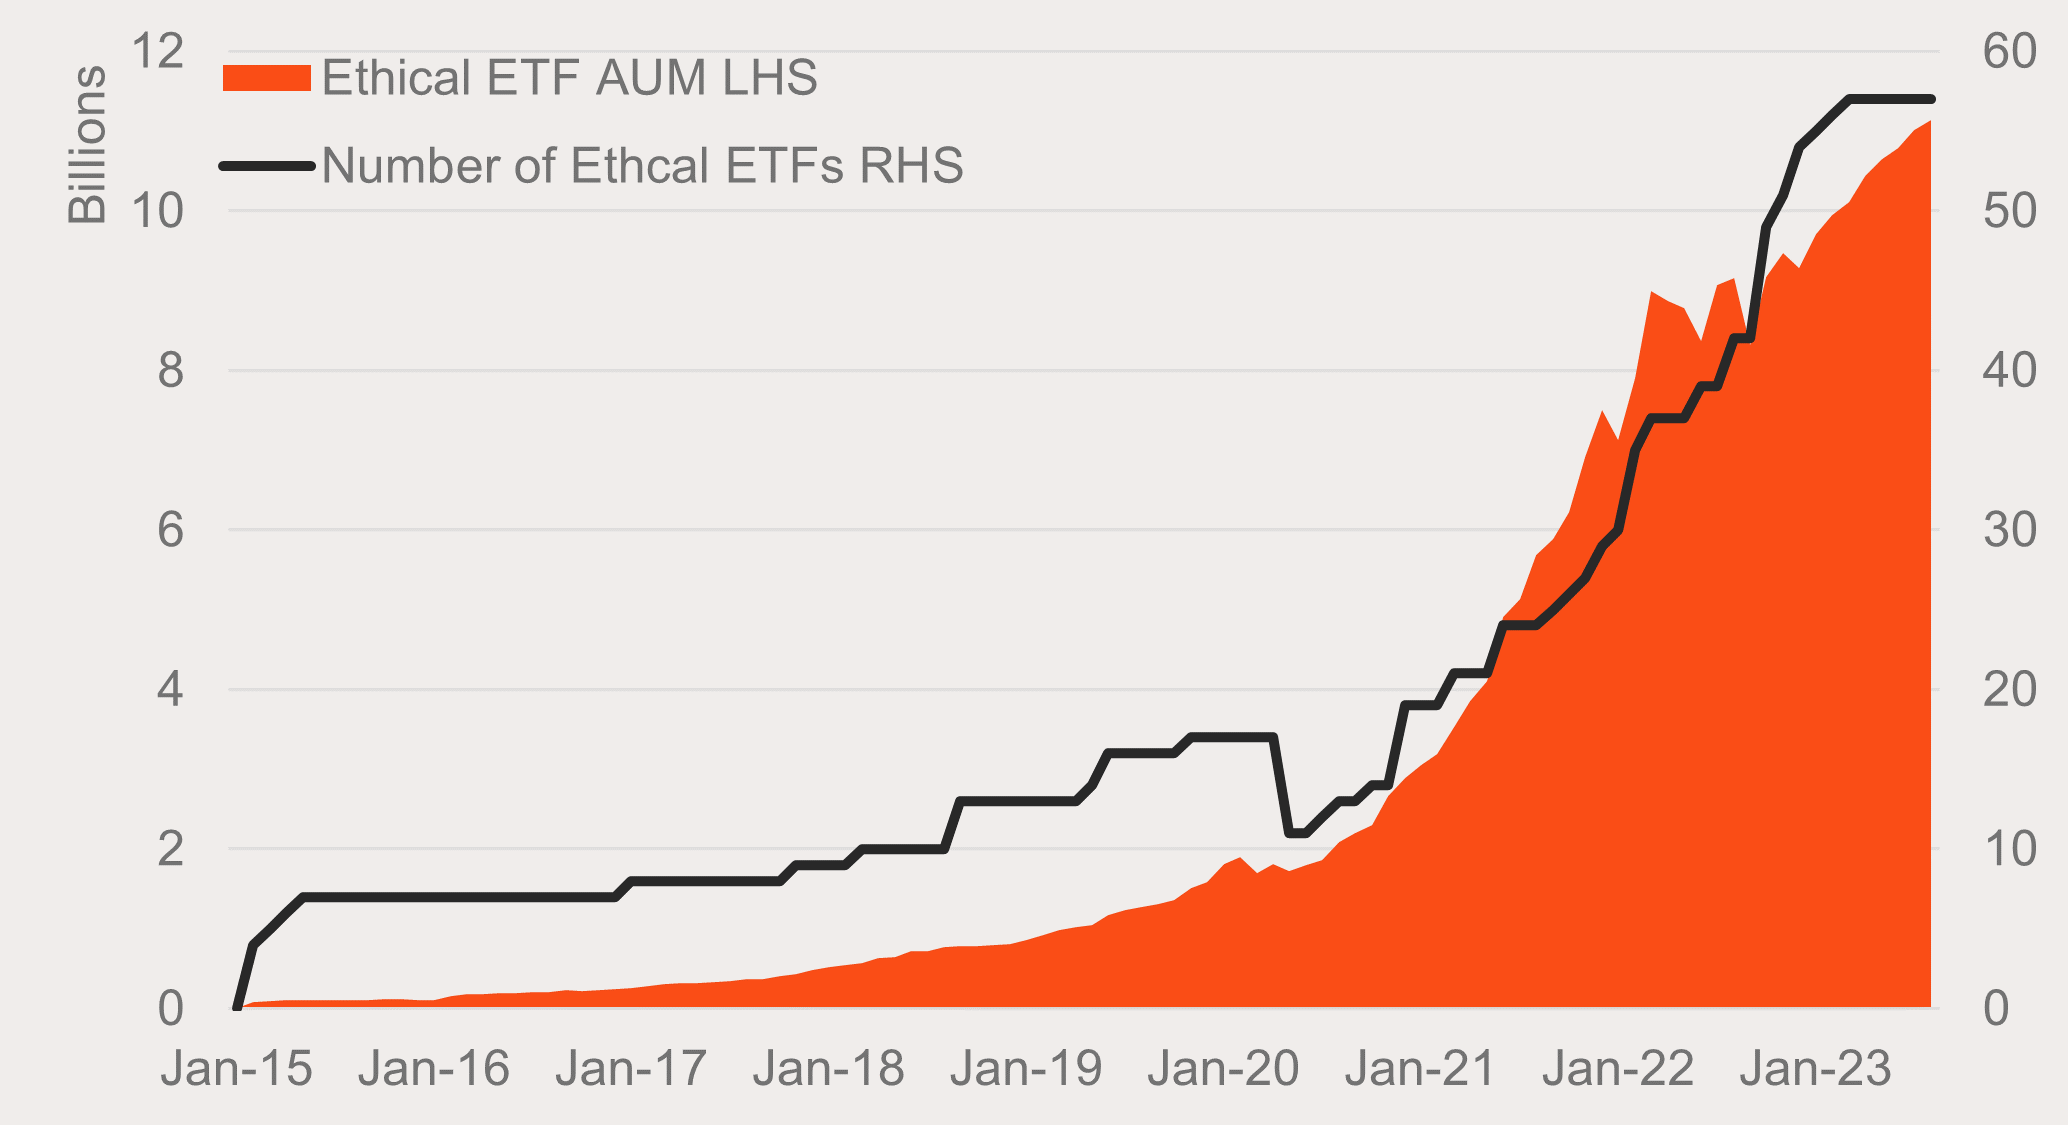
Source: ASX, CBOE, Betashares
While some of these ‘new’ ESG ETFs and their AUM has come from existing ETFs updating to include ESG screens, the bulk of assets and asset growth still sits with ETFs originally designed for ESG investors.
Betashares proudly offers what is currently the largest suite of ESG ETFs in the Australian market in terms of funds and AUM. Our core suite of ethical ETFs (ASX: FAIR, ETHI, HETH and GBND) account for over 40% of the entire ESG ETF AUM in Australia8.
The surprise – Thematic ETFs
Based on market noise around ETFs, you might be forgiven for mistaking thematic ETFs as one of the largest contributors to industry AUM.
Thematic ETFs’ benefits in offering investors low-cost access to focused investment strategies, the potential for long-term above-market growth opportunities, and diversification into areas under-represented in core holdings should not be understated. These allow investors access to growing trends like cybersecurity, AI, and the energy transition that have a low degree of representation in Australian equities.
However, their actual AUM as a portion of the Australian ETF industry sits around 3%. This is the smallest of the analysed categories9.
While a small percentage, this should not be too surprising when investors consider the typical place of thematic ETFs in a well-diversified portfolio. Our view is that thematic ETFs are best used as smaller satellite exposures, alongside a portfolio core or low-cost broad market and smart beta exposures.
Chart 6: Thematic ETF AUM and Australian ETF industry AUM: Oct 2011 to Aug 23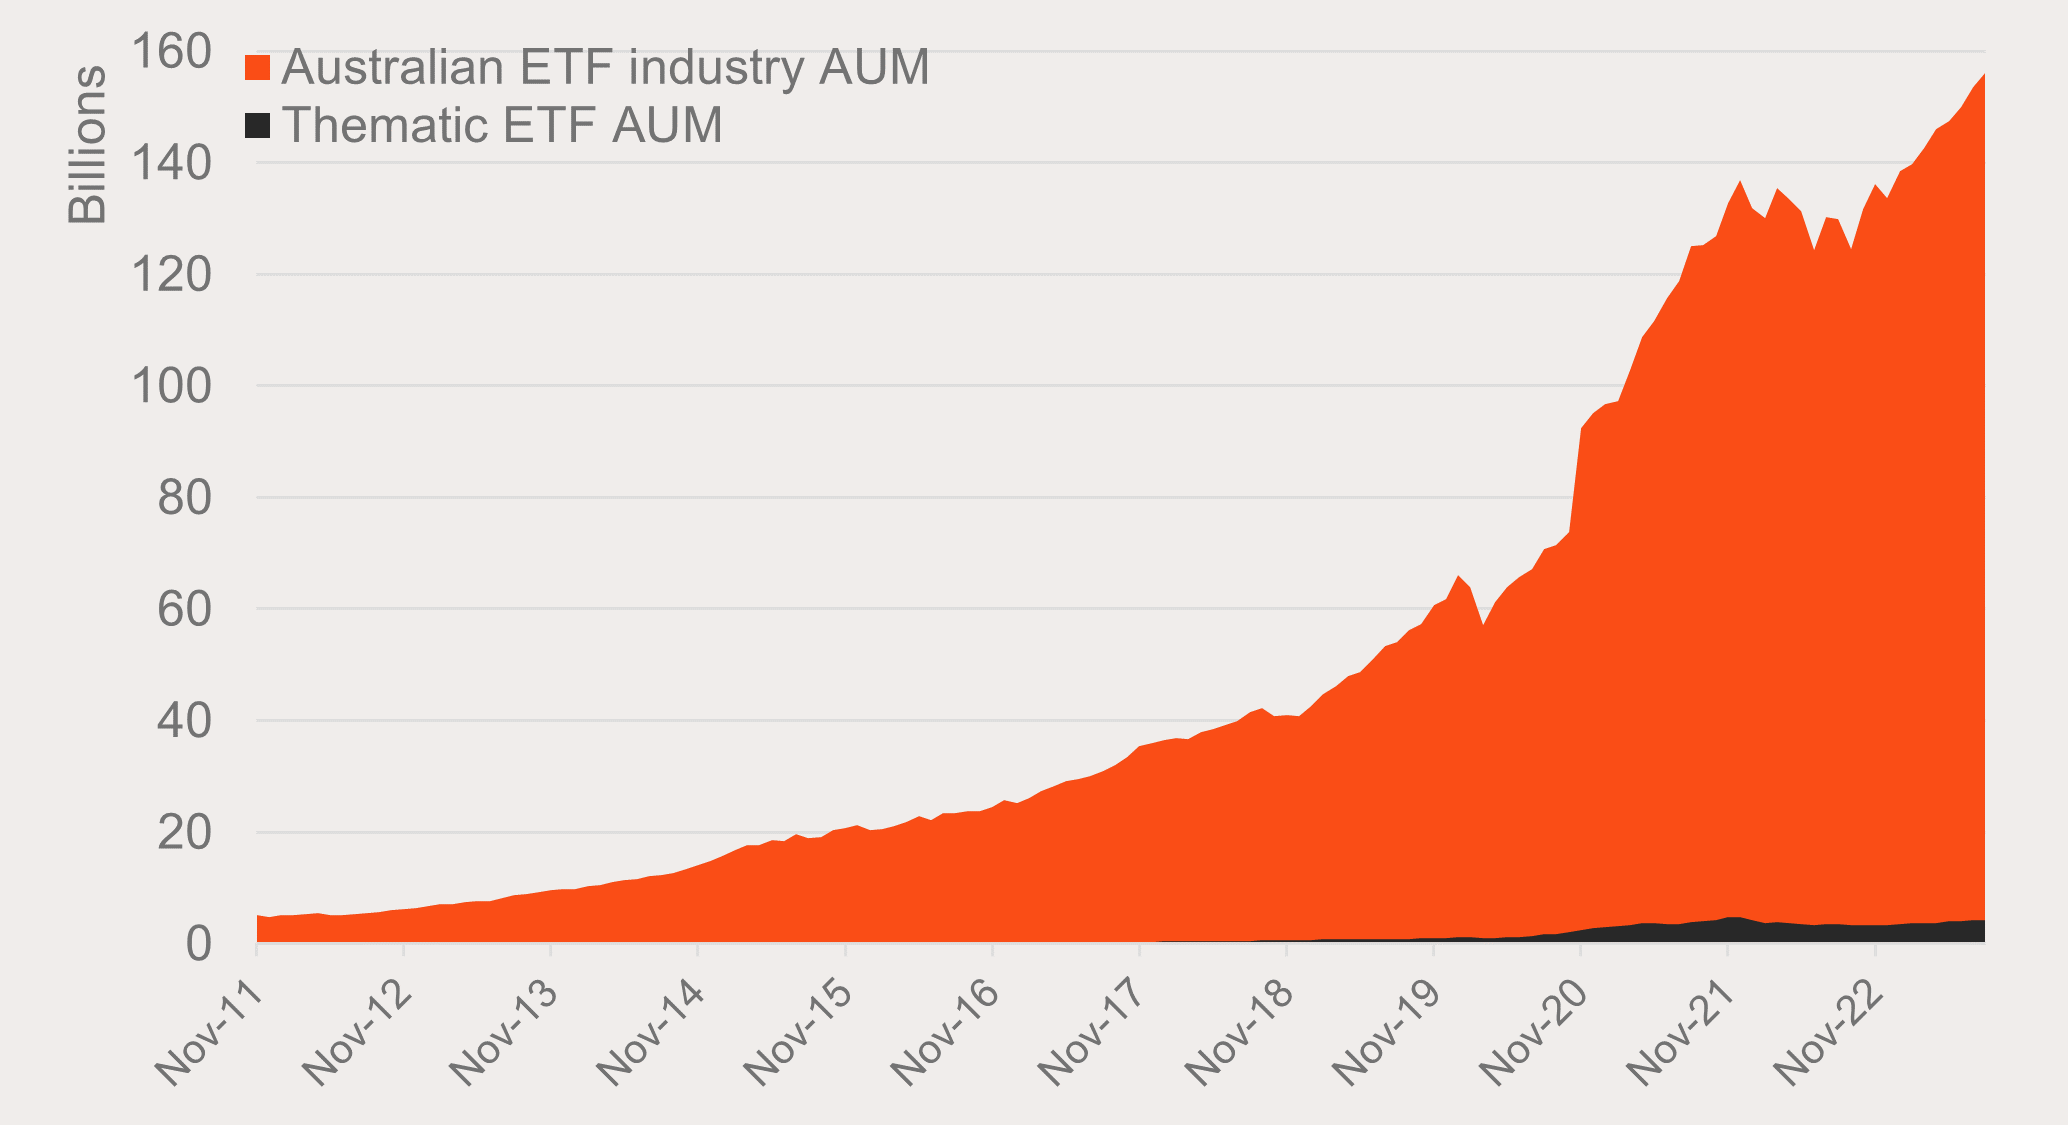
Source: ASX, CBOE, Betashares
The future? – Smart beta ETFs
When looking for future areas that could be key to the growth of Australia’s ETF industry, smart beta ETFs stand out. Although investors are generally familiar with the benefits of low-cost passive benchmark indices, there is still the inherent desire to generate outperformance over the market when investing.
With active managers under pressure due to typically charging higher fees and a majority of active funds not outperforming benchmarks over the long term10, investors are increasingly turning to smart beta ETFs.
Smart beta ETFs are still passive index tracking funds, however their indices differ from traditional benchmarks in the ways they select and weight their underlying holdings. Take Betashares AQLT Australian Quality ETF for example. Unlike traditional Australian broad market equity ETFs that would select and weight the largest 200 companies on the ASX based on their market capitalisation, AQLT selects Australian companies based on ‘quality’ metrics such as high return on equity, low leverage and relative earnings stability. AQLT’s focus on quality aims to produce long-term performance superior to that of the benchmark S&P/ASX 200 Index.
The number (45) and percentage of total industry AUM (11%) of smart beta ETFs has been steadily growing over the past decade.
Chart 7: Growth of smart beta ETFs in Australia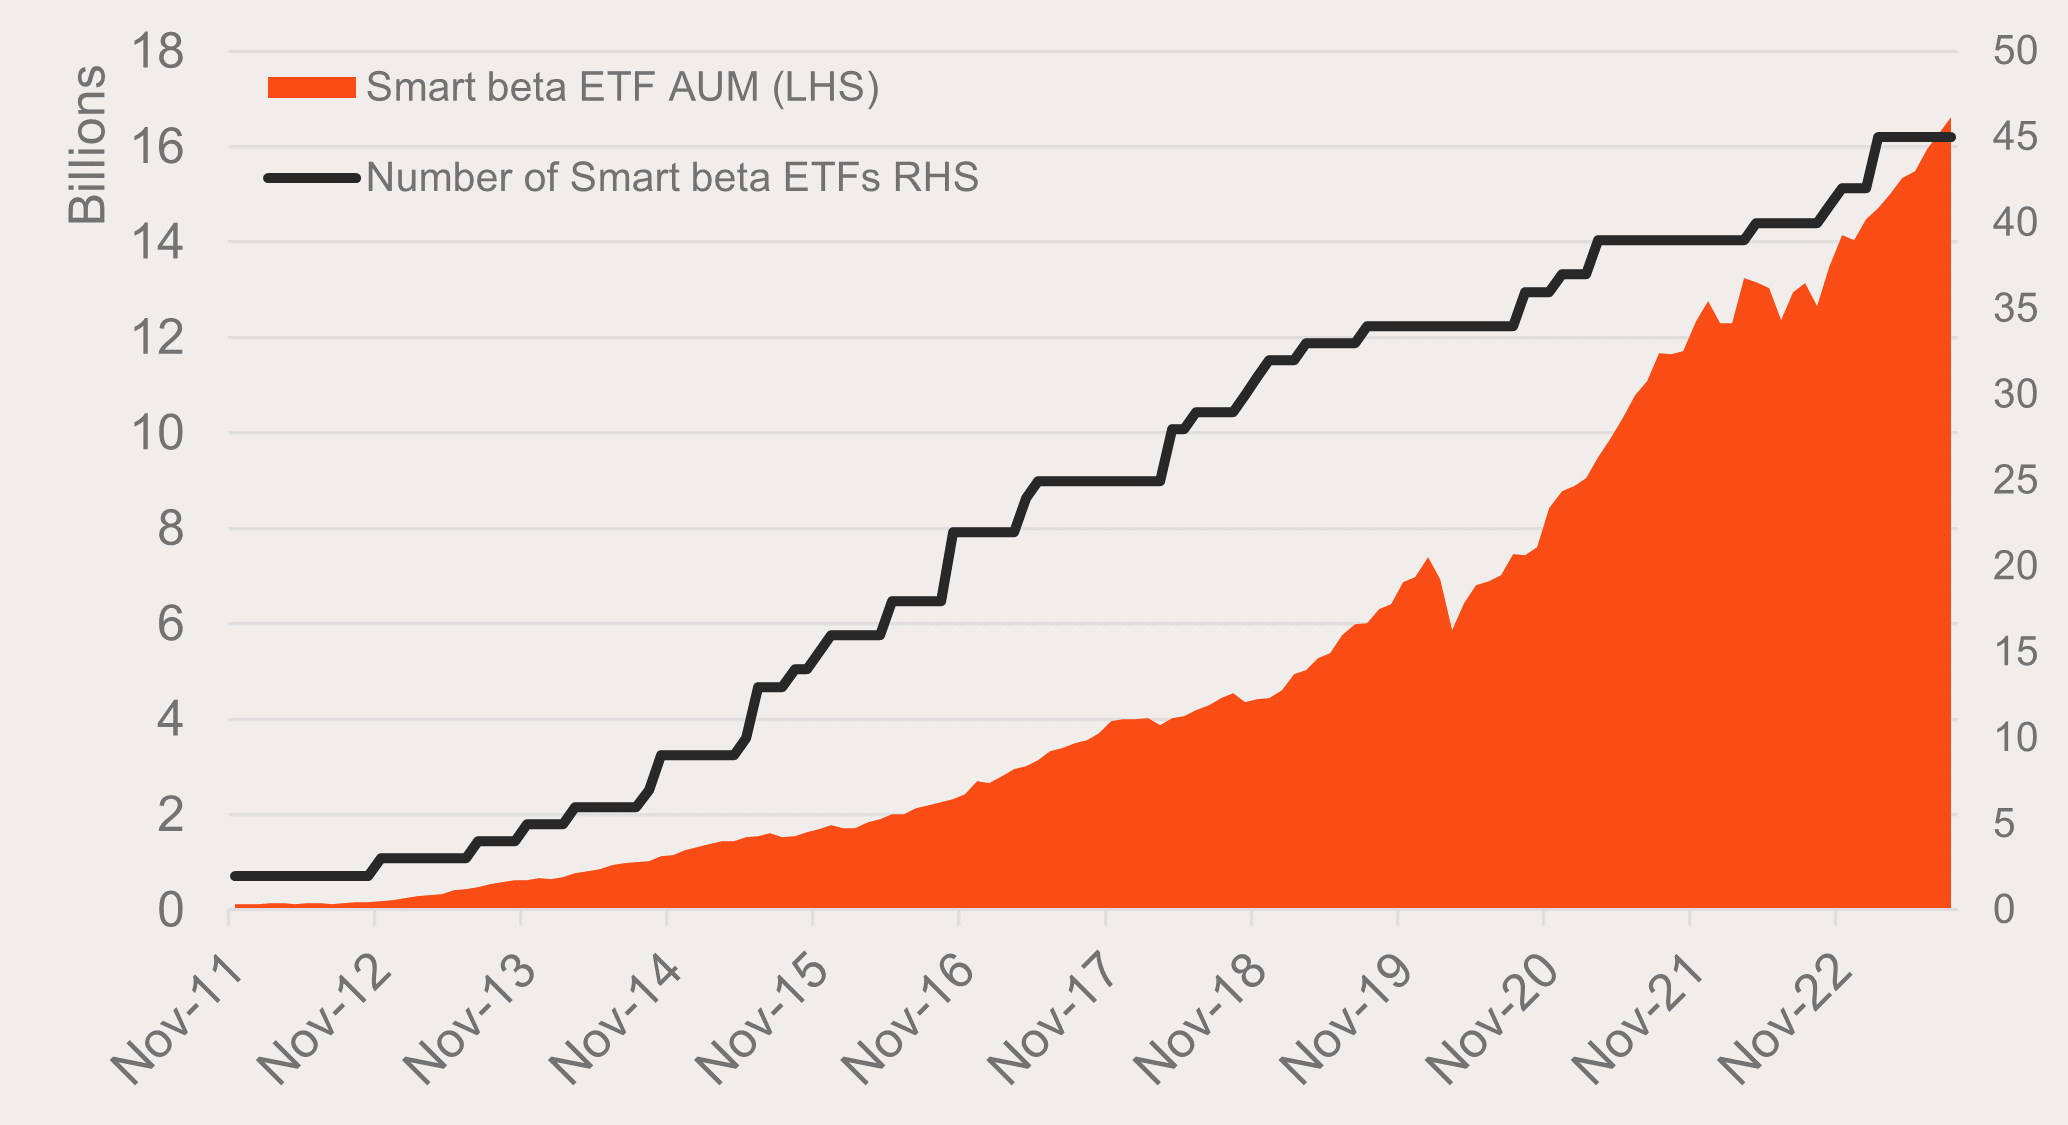
Source: ASX, CBOE, Betashares
The Australian ETF industry has seen impressive growth over the past two decades. Investors can now access over 350 investment strategies as ETFs on the ASX covering all major asset classes from a range of passive and active investment managers. There is the potential for the industry to grow to a trillion dollars, perhaps even within the next 10 years if this rate of growth continues and the industry achieves the same level of penetration as the US ETF industry.
2 – ASX, CBOE, Betashares.
3 – Defined by Morningstar universe of listed and open-ended funds defined as ‘money market’ and ‘fixed income’
4 – Source: ASX, CBOE, Betashares. 12 months to August 2023.
5 – Source: ASX, CBOE, Betashares. 12 months to August 2023.
6 – ESG-related ETFs as classified by Betashares. Includes index funds with ESG screens, index funds relating to an ESG thematic, Active funds with specific ESG screens.
7 – ASX, CBOE, Betashares.
8 – ASX, CBOE, Betashares. ESG-related ETFs as classified by Betashares. Includes index funds with ESG screens, index funds relating to an ESG thematic, Active funds with specific ESG screens.
9 – ASX, CBOE, Betashares
10 – S&P SPIVA mid-year 2023 report.