
Reading time: 2 minutes
Over the long term, ‘high-quality’ companies have tended to outperform the more cyclically exposed areas of the market as investors have searched for companies with lower debt, more consistent earnings and stronger profitability, offering dependable, secular growth in a low-growth world.
This is visible when comparing historical returns of an index of high-quality global companies to the broad global market over the past decade.
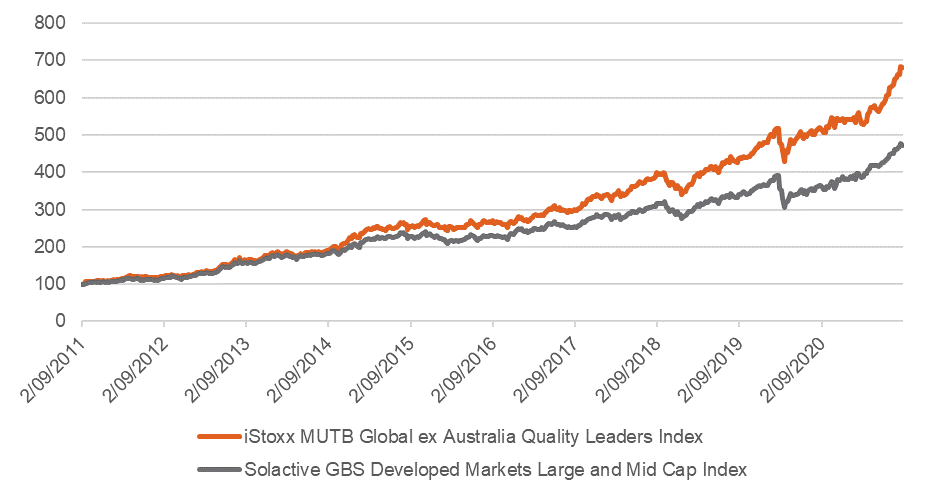
Source: Bloomberg. Data as at 31 August 2021. Performance shown of QLTY’s Index is the iSTOXX MUTB Global Ex-Australia Quality Leaders Index which QLTY aims to track and does not take into account QLTY’s 0.35% fees and costs. You cannot invest directly in an index. Past performance is not an indicator of future performance of the index or the ETF.
The metrics typically used to identify a company’s quality style factor score include:
- High and sustainable return on equity
- Profitability
- Earnings stability
- Financial health
Many of these quality metrics have been used by active managers as part of their investment process, when looking to provide alpha over their respective benchmarks. In fact, there has been a historic trend between higher tilts to the quality factor and increased performance over the medium to long-term for global equity managers here in Australia[1].
However, active management has often come at a hefty price, with the average cost of Australian domiciled global equity funds around 1.38% p.a.[2]
Additionally, it is unclear whether this higher performance can be attributed to manager skill or simply the benefits of an inherent tilt to the quality factor itself.
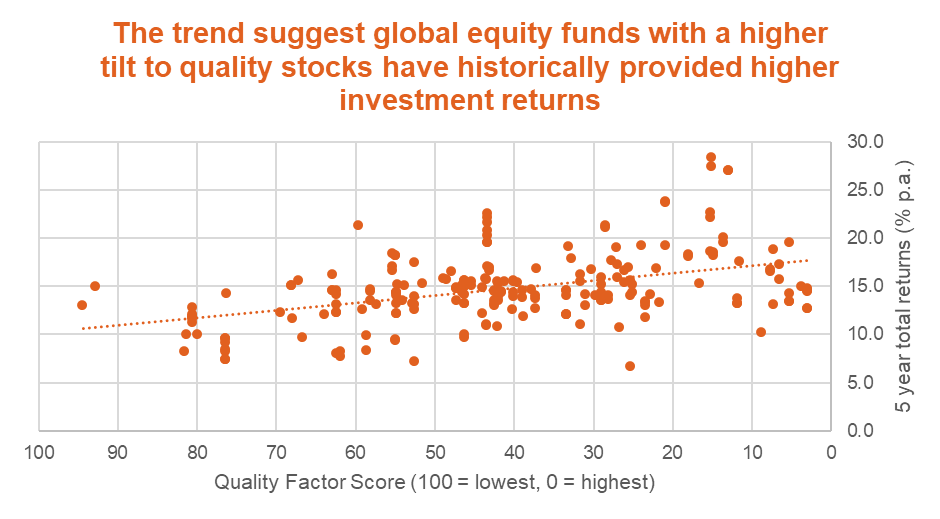
Source: Morningstar Direct, BetaShares. Data as at 31 August 2021. Universe defined as Australian Global Equity Funds Large Blend and Large Growth. Past performance is not indicative of future returns.
The broad range of Australian ETFs means there are now cost-effective exposures specifically targeting the world’s highest quality companies, without high active management fees.
By adopting a smart beta index approach, a ‘Quality’ ETF may give investors a more targeted exposure to the quality style factor versus actively managed funds by specifically focusing on companies with high quality metrics.
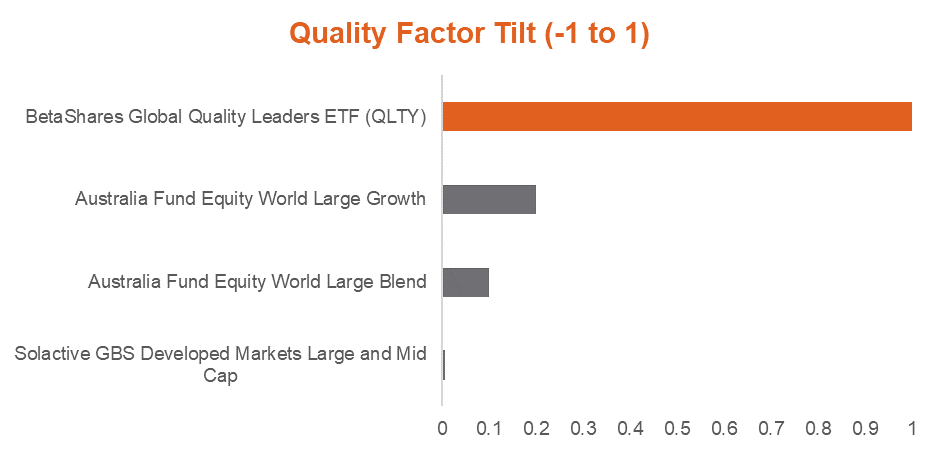
Source: Morningstar Direct, BetaShares. Data as at 31 August 2021. Past performance is not indicative of future returns.
This tilt to quality historically has provided long-term outperformance versus the global market.
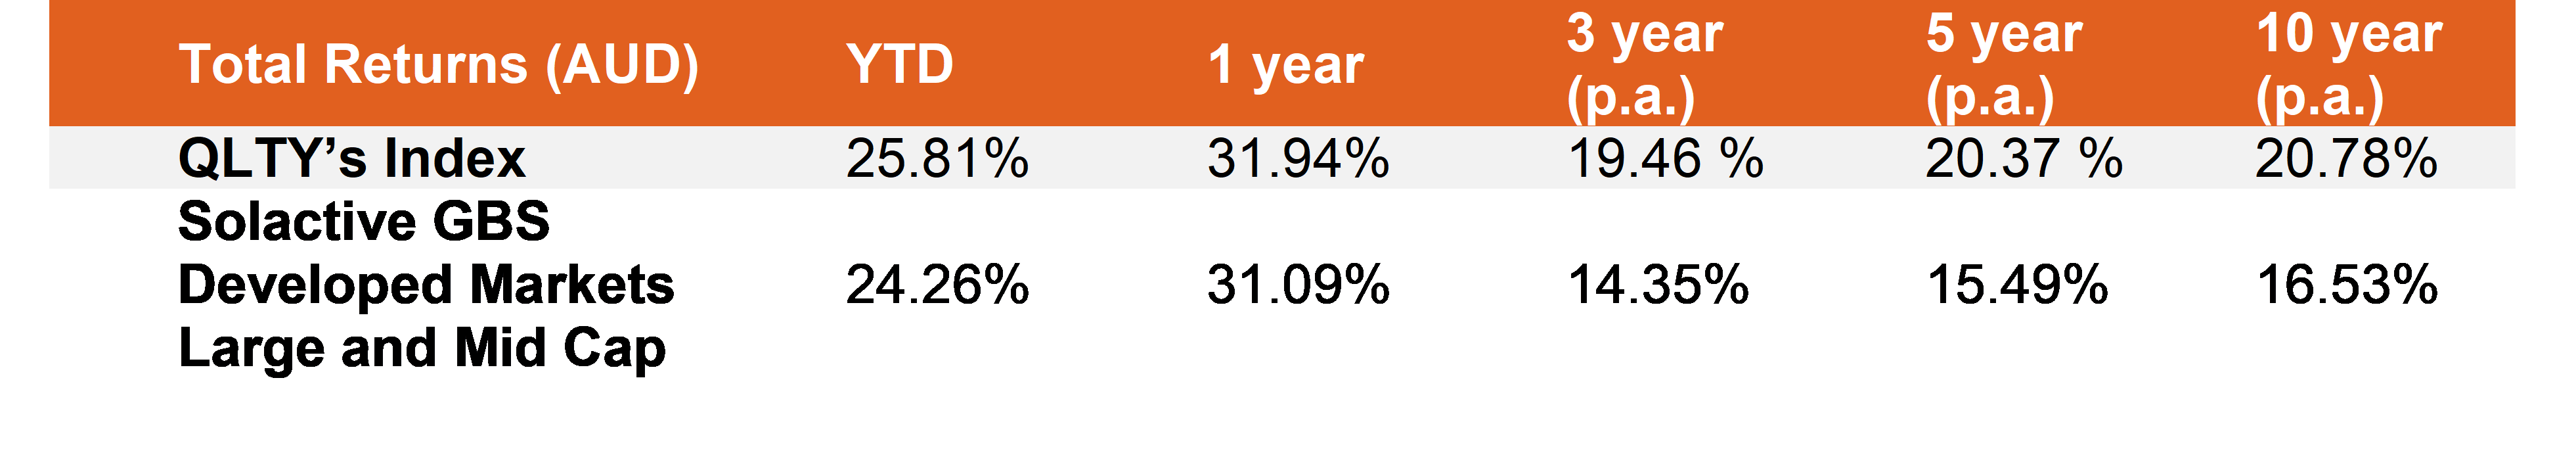 Source: Bloomberg. Data as at 31 August 2021. Performance shown of QLTY’s Index is the iSTOXX MUTB Global Ex-Australia Quality Leaders Index which QLTY aims to track and does not take into account QLTY’s 0.35% fees and costs. You cannot invest directly in an index. Past performance is not an indicator of future performance of the index or the ETF.
Investors looking for a portfolio of high-quality companies or looking to tilt portfolios towards the quality style factor can consider QLTY Global Quality Leaders ETF .
QLTY has been specifically designed to provide investors with exposure to a diversified portfolio of global companies (ex-Australia) that demonstrate ‘quality’ characteristics with the potential to deliver relatively high and sustainable returns on equity over time.
From a universe of 1800 stocks across global markets, the index which QLTY aims to track identifies the top 150 that each year pass a series of financial screens which include return on equity, financial health, profitability and business stability measures.
QLTY:
- aims to produce superior long-term performance to traditional benchmark global equities indices
- is the cheapest ‘quality’ factor global equity ETF currently traded on the ASX at 35bps p.a.
- due to its rigorous index methodology, has the highest tilt to the quality factor of any global equity fund or ETF available in Australia* [Source: Morningstar Direct, BetaShares. Data as at 31st August 2021].
| There are risks associated with investment in the Fund, including market risk, index methodology risk, international investment risk, concentration risk and currency risk. For more information on risks and other features of the Fund, please see the Product Disclosure Statement, available at www.betashares.com.au. |
1. Source: Morningstar Direct, BetaShares. Data as at 31 August 2021. Comparing Quality scores to 5 year and 10 year annualised total returns of Australian Global Equity Funds Large Blend and Large Growth. Past performance is not indicative of future returns.
2. Source: Morningstar Direct. Indirect Cost Ratio (I.C.R) data as at 31 August 2021. Universe defined as Australian Global Equity Funds Large Blend and Large Growth.