CPI to pressure rates

Luke Sheather
8 minutes reading time
Related articles

Better investing starts here
Get Betashares Direct
Betashares Direct is the new investing platform designed to help you build wealth, your way.
Scan the code to download.
Learn more
Learn more
While its long-term outperformance has been well documented, Quality investing has also garnered attention due to its defensive attributes during time of market weakness. However, during last year’s sharemarket drawdown, instead of providing its usual ‘cushion for the fall’, quality companies fell even further than the global benchmark.
We dissect the key drivers behind last year’s market fall and identify two key reasons which explain Quality’s relative underperformance, as well as two reasons why 2023 might just present a favourable landscape for Quality portfolios.
What is Quality?
Quality is a factor or style of investing that has rapidly grown in popularity since the turn of the millennium, attracting attention from investment professionals and everyday investors alike. Relatively high and sustainable profitability, capital efficiency and low leverage are just a few characteristics that help us define and construct Quality portfolios today.
How has Quality performed historically?
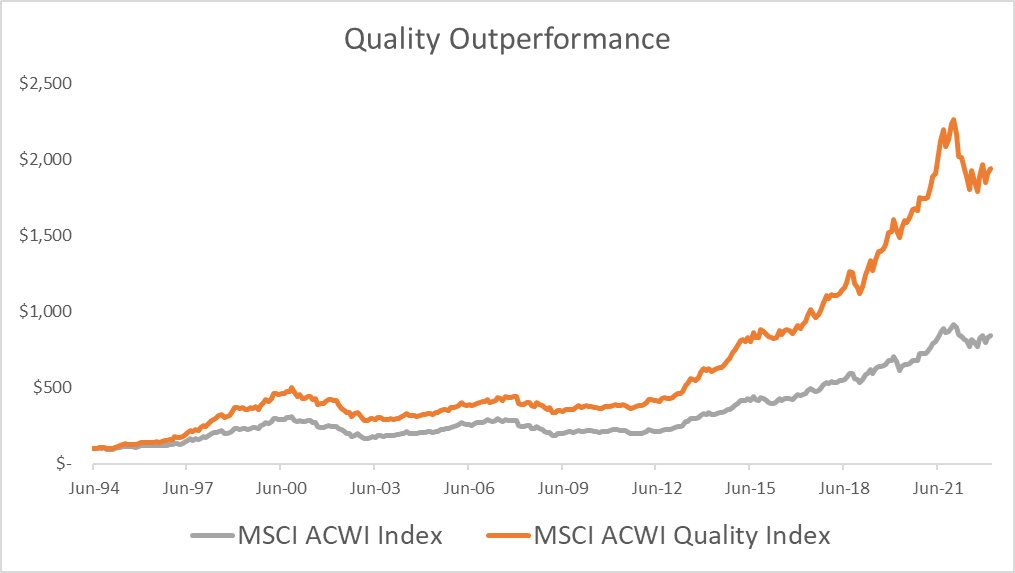
Source: Bloomberg. Graph shows performance of MSCI ACWI Total Return Index v MSCI ACWI Quality Total Return Index, not ETF performance and does not take into account ETF management costs. You cannot invest directly in an index. Past performance is not an indicator of future performance of an index or ETF.
While its long-term outperformance has been well documented by numerous academics and Nobel Prize laureates1, arguably the bigger drawcard of Quality investing in recent years has been its ability to withstand periods of market weakness better than both the broader sharemarket and other well-known factors such as Value, Growth and Size.
The downside capture ratio is a statistical measure regularly used by analysts to determine how a particular style of investing has performed during down-markets, relative to the broader sharemarket. A capture ratio less than 100 indicates outperformance during down-markets. In Quality’s case below, a ratio of 87 would imply that for a given 1% market fall, a Quality portfolio might fall approximately 0.87% on average, over that same period.
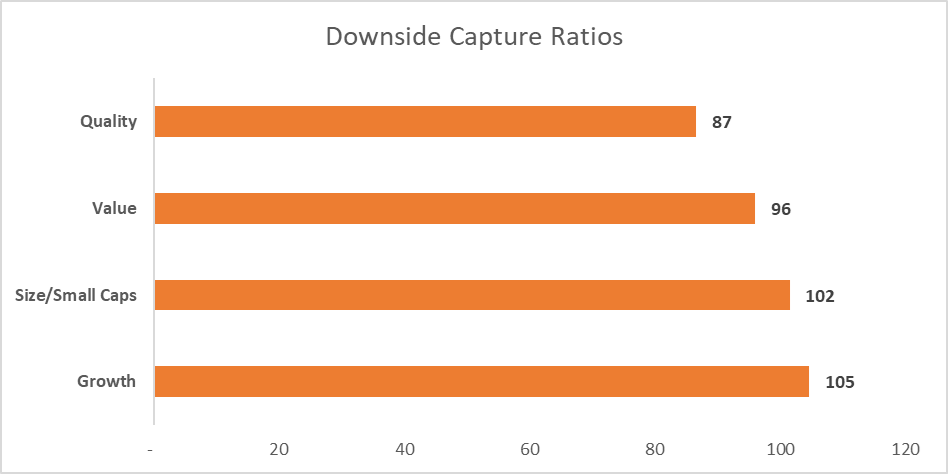
Source: Bloomberg. Downside Capture Ratio uses a monthly period data, between 31/12/98 – 31/1/23. Quality = MSCI ACWI Quality Gross Total Return Index. Value = MSCI ACWI Value Gross Total Return Index. Size/Small Caps = MSCI ACWI Small Caps Gross Total Return Index. Growth = MSCI ACWI Growth Gross Total Return Index. Historical data is not indicative of future outcomes.
With earnings stability a key focus in its construction, Quality portfolios implicitly target companies with resilient business models and market positions that have the potential to withstand periods of slower economic growth, or even recessionary environments. Additionally, the emphasis on capital efficiency and low leverage means that Quality portfolios will favour companies that are more able to endure and swiftly pivot when unforeseeable risks present themselves.
It is therefore intuitive that investors will be attracted to companies that present these characteristics when the sharemarket experiences a pullback, in what financial commentators often label the ‘flight to quality’. However, as we saw during the market drawdown last year, markets don’t aways stick to the playbook.
In 2022, we saw the MSCI All Country World (ACWI) Index2 – a barometer of the performance of the global sharemarket – decline 12.9 %, while the MSCI ACWI Quality Index3, instead of providing its usual ‘cushion for the fall’, fell even further, by 18.6%.
Reflecting on performance alone, one might be forgiven for casting doubts over the defensive characteristics embedded in quality investing. However, after dissecting the key drivers of this drawdown we can identify two key reasons which explain Quality’s relative underperformance, as well as two reasons why 2023 might just present a favourable landscape for Quality portfolios.
2022 – a Quality anomaly?
Firstly, what was atypical about the 2022 market decline was that rather than being led by a slowdown in economic indicators or corporate profits, much the opposite was in fact the case.
We had a white-hot economy spurring on the dogged inflation we are still seeing today, which eventually forced global central banks to commence the most aggressive rate hiking cycle seen in decades. For the large part, many companies (and not just Quality companies) were able to take advantage of the excess consumer demand still present within markets following COVID-19 stimulus measures, and utilise their pricing power. Higher input costs could be passed through to maintain profits and margin levels. Such business conditions are a boon for cyclical companies, however, they tend to erode the relative attractiveness of Quality companies.
The second reason behind Quality’s underperformance related to the compression of company valuations, which is a mechanical repricing that occurs when risk-free interest rates increase.
Put simply, when central banks increase interest rates, or even when the market expects rates will increase, the valuation of a company and its share price are revised downwards. Ultimately, this can happen via several avenues. Firstly, rising interest rates adversely affect a company’s earnings as borrowing costs and the costs of raising new capital increases. Also, in determining a company’s value, its expected future cash flows and earnings are now discounted at a higher rate, which reduces its valuation and effectively its share price.
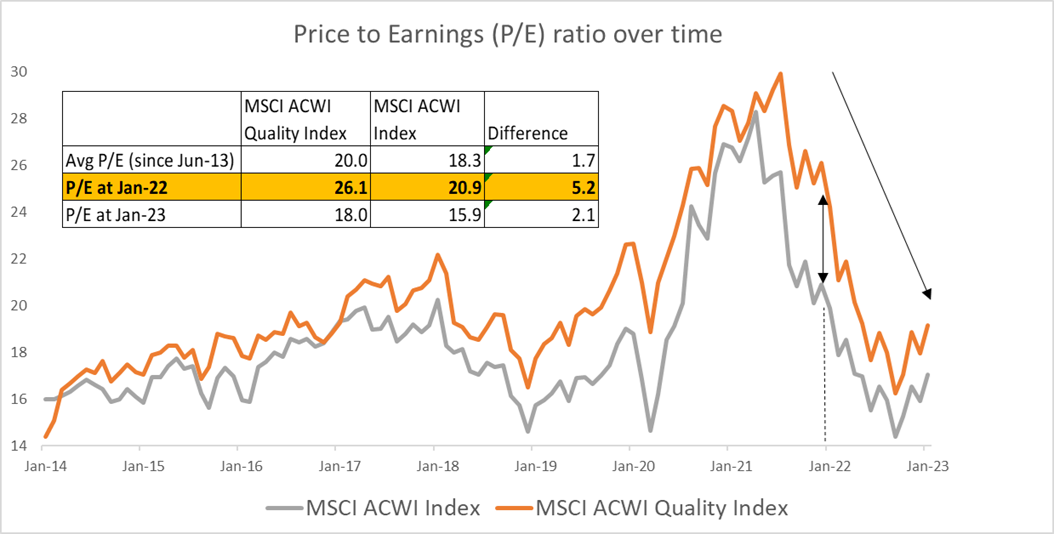
Source: Bloomberg. Past performance is not an indicator of future performance. You cannot invest directly in an Index.
The chart above illustrates the sharpness of this valuation re-rating we saw, once it became highly likely that central banks would need to combat inflation with higher interest rates. Also, and more specifically to Quality, the chart and table identify the lofty premium (being the difference in P/E ratios between Quality and the broader sharemarket) that investors were paying for Quality at the turn of 2022.
Unfortunately, when the market began penalising companies for being too expensive, Quality companies were trading at some of their highest prices, on a relative basis, of the past 10 years, and therefore were vulnerable to a larger price adjustment.
2023 – why Quality now?
Although monetary policy can be implemented quickly, it can take 18 months, or even longer, for the policy objective to be reflected in the market. And with what looks to be the best part of global rate hiking campaigns now priced into the market, the more prominent downside risk facing sharemarkets today would appear to be the adverse impact of an economic slowdown or potential recession on corporate earnings. It is within these types of environments that you would expect cyclical activity to slow significantly and Quality portfolios, being less reliant on a fast-growing economy, to come to the fore.
Furthermore, we can see in the chart and table above, that the premium for Quality companies has now moderated much closer to its historical average. History informs us that some of the biggest market drawdowns to date have been earnings-led or related to periods of recession, and with Quality companies having repriced back to more normal levels, now might be an opportune time for an investor to consider adding some Quality exposure to their overall portfolio.
How can Australian investors invest in Quality?
Betashares offers four ETFs that provide exposure to the Quality factor. Each fund aims to track select companies based on ‘quality’ metrics, such as high return on equity, low leverage, and earnings stability.
AQLT Australian Quality ETF was recently launched in April 2022 and aims to track the performance of 40 high-quality Australian companies that are weighted according to their quality score.
QLTY Global Quality Leaders ETF aims to track the performance of 150 global companies (ex-Australia) ranked by highest quality score.
HQLT Global Quality Leaders Currency Hedged ETF aims to track the performance of 150 global companies (ex-Australia) ranked by highest quality score, hedged into Australian dollars.
IIND India Quality ETF aims to track the performance of the 30 highest-quality Indian companies, providing a convenient access point to one of the fastest growing economies in the world.
There are risks associated with an investment in the Funds, including market risk, currency risk, sector risk, concentration risk and index methodology risk. Investment value can go up and down. An investment in the Funds should only be made after considering your particular circumstances, including your tolerance for risk. For more information on risks and other features of the Funds, please see the relevant Product Disclosure Statement (PDS) and Target Market Determination (TMD).
Betashares Capital Ltd (ABN 78 139 566 868 AFS Licence 341181) is the issuer of the Betashares Funds. This information is general in nature and doesn’t take into account any person’s financial objectives, situation or needs. You should consider its appropriateness taking into account such factors and seek professional financial advice. Read the TMD and PDS at www.betashares.com.au and consider with your financial adviser whether the product is appropriate for your circumstances.
Resources:
1. Novy-Marx, R. (2012). The other side of value: The gross profitability premium. Fama, E. F., & French, K. R. (2015). A five-factor asset pricing model.
2. MSCI ACWI Index = MSCI All Country World Net Total Return (AUD)
3. MSCI ACWI Quality Index = MSCI All Country World Quality Net Total Return (AUD)
Explore
Markets