Reading time: 3 minutes
If you have looked at recent financial headlines, there’s a high chance the rotation of assets into value exposures has been mentioned. This has largely been a result of a plethora of positive vaccine rollout updates, the reopening of the global economy and expectations of rising inflation. I wrote a blog back in January looking at value and growth portfolio positioning ideas and how to take advantages of both style factors. It’s interesting to reflect on how the growth/value rotation has played out and in particular how U.S. growth stocks have performed.

Source Bloomberg. As at 14 June 2021. Index performance does not take into account ETF fees and costs. You cannot invest directly in an index. Past performance is not indicative of future performance.
Tech performance vs value
The Financials, Materials and Energy sectors have performed well in 2021 as investors have shifted focus to perceived undervalued areas of the market, however at the time of writing, the Nasdaq-100 Index has just registered a new record high. As you can see in the above table, the Nasdaq-100 (helped recently by a strong earnings season in Q1) is up 10% year to date. If we stretch the time period to five years, the Nasdaq-100 shows significant outperformance against the broad U.S. market (S&P 500) and value-tilted exposures (S&P Equal Weight).
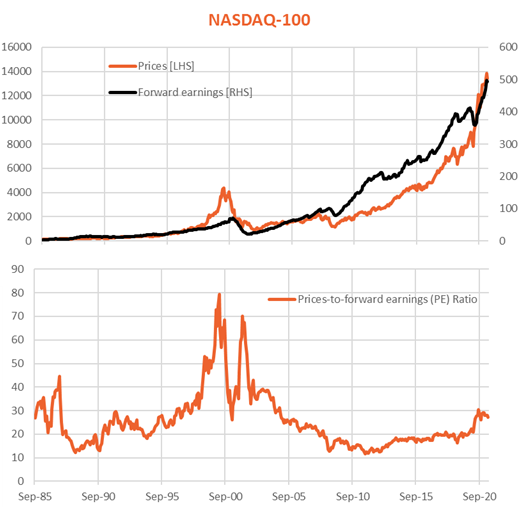
Indeed, high-quality tech names are trading at decreased multiples – with the Nasdaq-100 Index trading at a forward price to earnings (PE) ratio of 28 in May 2021, compared to a forward PE ratio of 32 in September 20201 – which may merit looking at more closely. A lot of the recent underperformance in tech has been led by unprofitable tech companies, not the high-quality, cash-rich household names that are already in many investors’ portfolios, such as Apple, Alphabet and Facebook.
It is also worth noting that the current forward PE ratio of the Nasdaq-100 Index is above recent average levels, but still well below the peaks during the DOTCOM bubble, where the forward PE ratio peaked at 79.4 in March 2000. In the chart below, unlike during the DOTCOM bubble, much of the recent price appreciation has been supported by rising forward earnings.

Source Bloomberg, BetaShares. Index performance does not take into account ETF fees and costs. You cannot invest directly in an index. Past performance is not indicative of future performance of any index or ETF.
Shift to high-quality tech stocks
High-quality tech stocks performed extremely well through 2020 and recently had a bumper earnings season in the U.S. If investors decide to turn more cautious in the second half of 2021 it could also support a shift towards the quality style factor. The Nasdaq-100 contains many of these high-quality mega cap tech stocks.
High-quality tech companies are likely to remain a central part of our world, and in fact it can be argued that the pandemic has only increased their influence on daily life, from increased use of mobile apps, to the use of streaming (cloud) services and further integration of technology into our daily lives.
Tech performance when rising inflation is expected
It is important to consider the effect inflation expectations have previously had on tech, particularly U.S. tech performance.
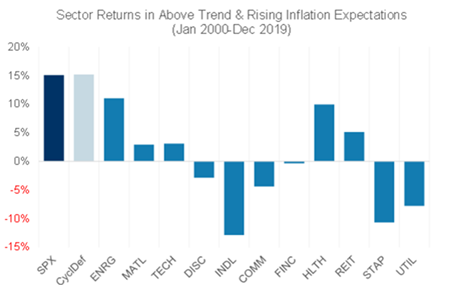
As you can see from the chart below, large-cap tech tends to perform positively when there are expectations of rising inflation and does not seem to be fundamentally dependent on low inflation.
The chart illustrates sector returns when inflation expectations are above trend and rising.

Source: GIR (Arjun Menon). As at 17 May 2021. Past performance is not indicative of future performance.
How to gain U.S. tech exposure
You can gain exposure to U.S. tech companies through:
From inception in May 2015 to 31 May 2021, NDQ has returned 20.9% p.a.2
| There are risks associated with an investment in NDQ or HNDQ, including market risk, country risk and sector risk, as well as currency risk (for NDQ) and currency hedging risk (for HNDQ). NDQ’s and HNDQ’s returns can be expected to be more volatile (i.e. vary up and down) than a broad global shares exposure, given their concentrated sector exposure. NDQ and HNDQ should only be considered as a component of a diversified portfolio. For more information on risks and other features of NDQ and HNDQ, please see the relevant Product Disclosure Statement, available at www.betashares.com.au. |
1. Source: Bloomberg.
2. Past performance is not indicative of future performance.
Written by
Alex Holmes