Reading time: 2 minutes
Over the past decade, a seismic shift has occurred across the global investment landscape – the shift of assets from active investment managers towards passive, or index, strategies. This shift has been of such magnitude that in the U.S. market the total assets invested in passive strategies eclipsed the total invested with active managers in April 20191. This trend, as can be seen below, has been replicated in the Australian market.
Cumulative flows from U.S. active to passive funds, 2008 to 2019
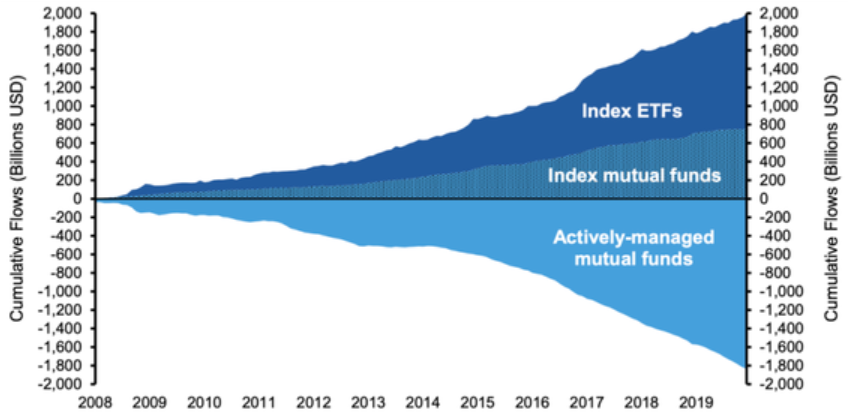
Source: Investment Company Institute.
Note: U.S. domestic equity funds; Mutual fund data is net new cash flow plus re-invested dividends; ETF data is net share issuance and includes re-invested dividends.
The move to passive investing has accelerated over the past decade, with two main drivers commonly cited:
- The lower cost associated with passive investments, often less than 10% of the cost of an active fund providing similar exposure, and
- Loss of faith by investors in the ability of active managers to consistently beat their respective benchmarks, particularly after fees are accounted for.
While a passive or index strategy is clearly cheaper, no active investment insight is applied to the stocks selected for the portfolio – the portfolio comes ‘warts and all’, so to speak, by mirroring the relevant index.
If an investor believes the market is efficient, this approach makes perfect sense. However, if an investor is seeking to profit from possible mispricings in the market, the question then arises, is there a manager or process that can potentially identify such mispricings, and offer the possibility of broad market outperformance?
Fundamental indexing
In 2002, a firm in the United States, Research Affiliates (RA), was formed with this aim in mind. This was at a time not long after the tech bubble, when many stocks in traditional indices were trading at clearly inflated values, and investors suffered accordingly as these stocks reversed to reflect their true or ‘fundamental’ value. Out of RA’s research, fundamental indexing was born.
Traditional indices are created by ranking companies based on their market capitalisation, and their composition is therefore determined primarily by the movement in share prices. If, as stated above, an investor believes the market is always perfectly efficient, this should accurately reflect a company’s ‘true value’ at all times. However, as investors we know market bubbles and sell-offs occur, quite violently at times, and a share price may not always reflect true value.
Fundamental indexing, rather than using share price to size and rank companies, uses the following accounting measures:
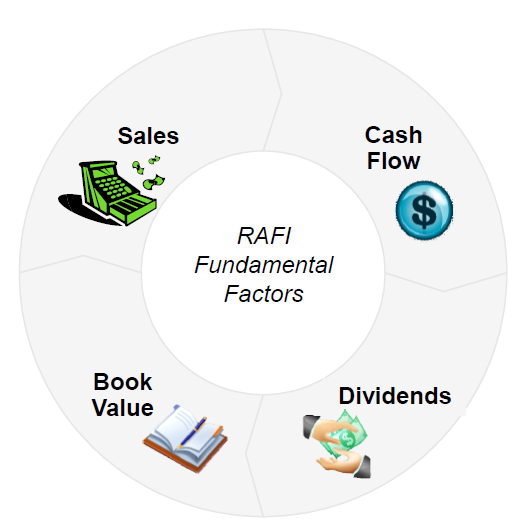
Compared to market-cap weighting strategies, the fundamental-indexing strategy seeks to overweight relatively cheap stocks (such as those trading at price-to-book and price-to-earnings valuations below their respective long-run averages) while underweighting relatively expensive stocks (such as those trading at price-to-book or price-to-earnings valuations above their respective long-run averages).
Does fundamental indexing work?
Over a period of almost 30 years, the Research Affiliates Fundamental Index (RAFI) methodology has, on average, added around 1.8% p.a. over and above the returns from the S&P/ASX 200 Index2. As shown below, the strategy doesn’t outperform every year, but over time has shown a consistent value-add.
FTSE RAFI Australia 200 Index v S&P/ASX 200 Index Total Returns by Calendar Year
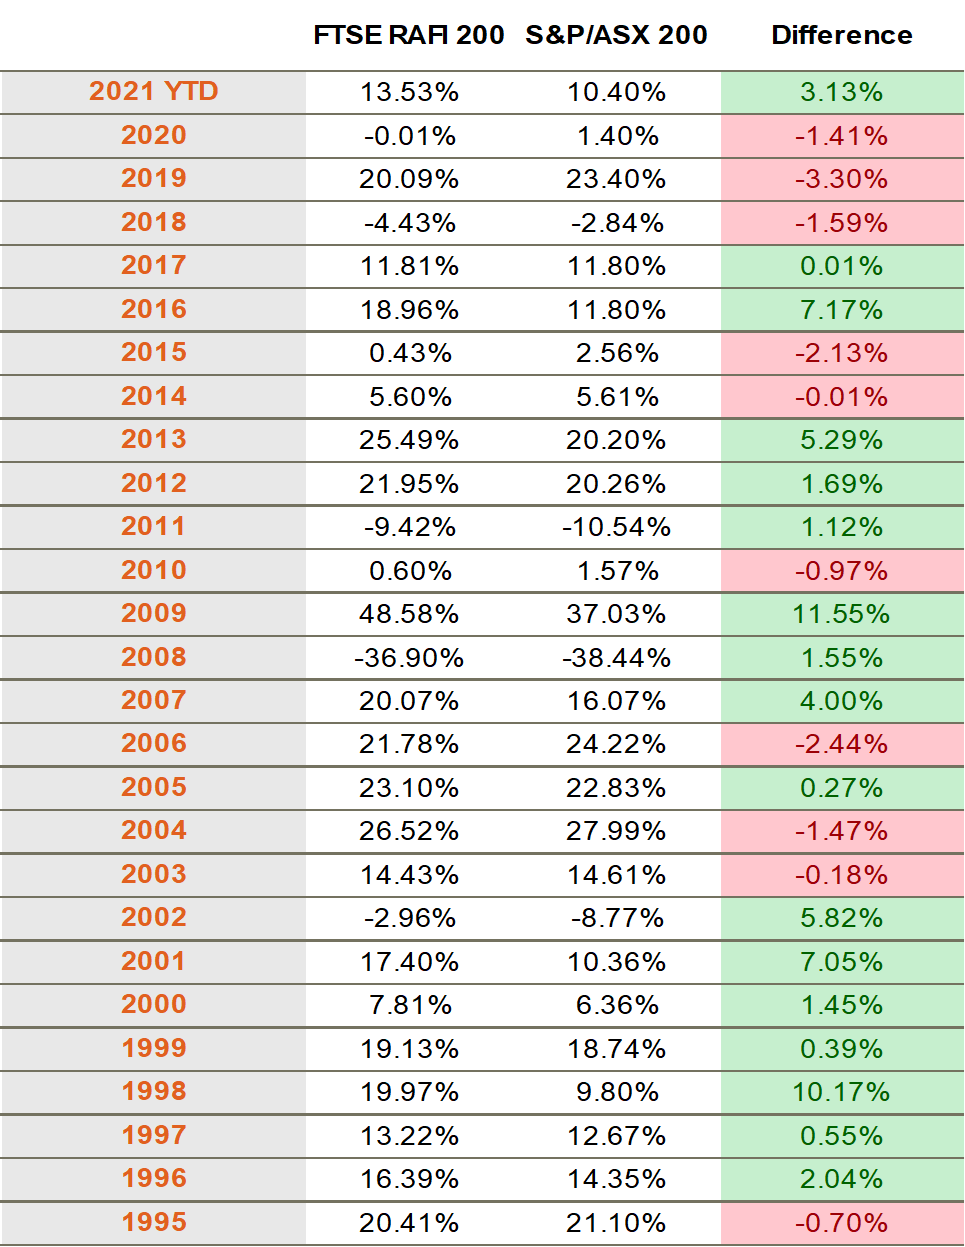
As at 31 May 2021. Table shows performance of underlying index relative to S&P/ASX 200 index, not ETF performance and does not take into account ETF management costs. You cannot invest directly in an index. Past performance is not an indicator of future performance of index or ETF. The FTSE RAFI Australia 200 Index was launched on 10/8/2009. Index returns prior to launch are simulated based on Research Affiliates’ patented non-capitalisation weighted indexing system, method and computer program product. Actual investment results may differ from simulated results. Source: Bloomberg, FTSE.
FTSE RAFI Australia 200 Index v S&P/ASX 200 Index: May 1992 – 31 May 2021
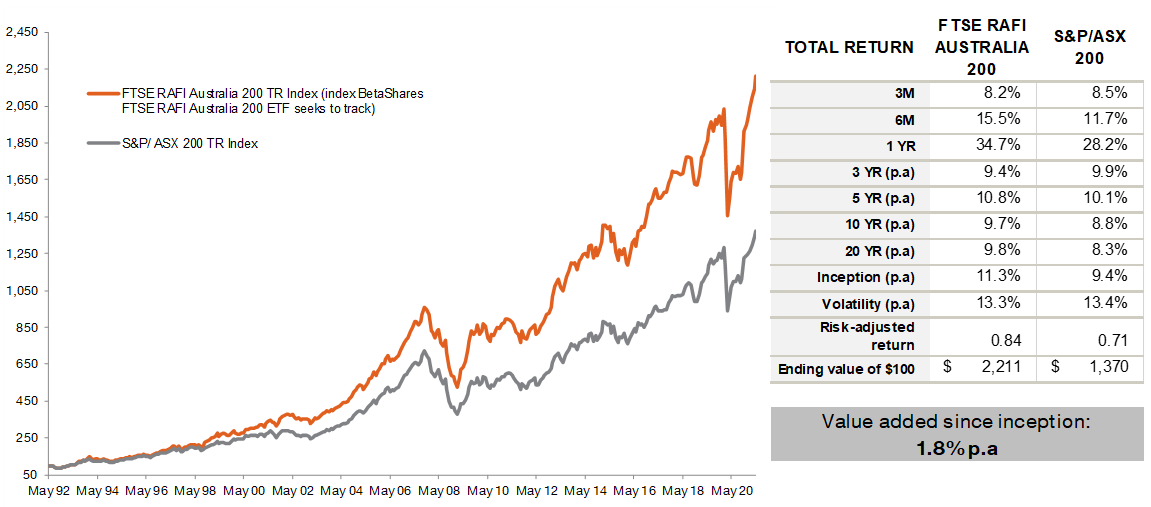
Graph shows performance of underlying index relative to S&P/ASX 200 index, not ETF performance and does not take into account ETF management costs. You cannot invest directly in an index. Returns for periods longer than one year are annualised. Past performance is not an indicator of future performance of index or ETF. The FTSE RAFI Australia 200 Index was launched on 10/8/2009. Index returns prior to launch are simulated based on Research Affiliates’ patented non-capitalisation weighted indexing system, method and computer program product. Actual investment results may differ from simulated results. Source: Bloomberg, FTSE.
Importantly, this is still a rules-based indexing strategy, with correspondingly lower fees than active strategies providing similar exposure. However, this non-price weighted approach seeks to generate outperformance over time based on the premise that high-priced stocks tend to underperform, and relatively cheap stocks tend to outperform. The RAFI approach does not give up on the pursuit of outperformance over time, and indeed as evidenced above has delivered on this objective over longer timeframes. In many ways, the RAFI approach has delivered on the often-unfulfilled promise of active management, with the cost efficiencies of passive investing.
You can access the RAFI investment strategy for Australian equities via QOZ FTSE RAFI Australia 200 ETF .
| There are risks associated with an investment in QOZ, including market risk, non-traditional index methodology risk, security specific risk and sector concentration risk. For more information on risks and other features of QOZ, please see the Product Disclosure Statement, available at www.betashares.com.au. |
1. https://www.morningstar.com/insights/2019/06/12/asset-parity
2. Past performance is not indicative of future performance of any index or fund. You cannot invest directly in an index.

Written by
Craig Higson