
Same hedge, different tax outcome: one key consideration when comparing global bond ETFs

Tom Wickenden
6 minutes reading time
- Currency hedged
- Global shares
Related articles
This information is for the use of financial advisers and other wholesale clients only. It must not be distributed to retail clients.
Betashares Global Shares ETF (ASX: BGBL) along with a currency hedged version, Betashares Global Shares Currency Hedged ETF (ASX: HGBL), offer investors the benefits of a broadly diversified global portfolio with management costs of just 0.08% p.a. for BGBL, and 0.11% p.a. for the currency hedged HGBL.* The below discussion relates just to BGBL, noting HGBL aims to track an Australian dollar currency-hedged version of BGBL’s Index.
BGBL aims to track the Solactive GBS Developed Markets ex Australia Large & Mid Cap Index (before fees and expenses). This is a free float market cap-weighted index that includes approximately 1,500 securities from 23 countries globally (ex-Australia), encompassing the majority of the developed world’s investible equity universe.
BGBL’s Index has had similar historical performance and characteristics to the MSCI World Ex-Australia Index which is typically used as a benchmark by Global active fund managers. The lowest cost ETF tracking the MSCI World Ex Australia Index has management costs of 0.18% p.a.
BGBL’s Index & MSCI World Ex-Australia Historical Performance and Statistics: 8 May 2006 – 30 June 2023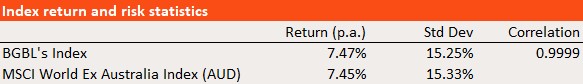
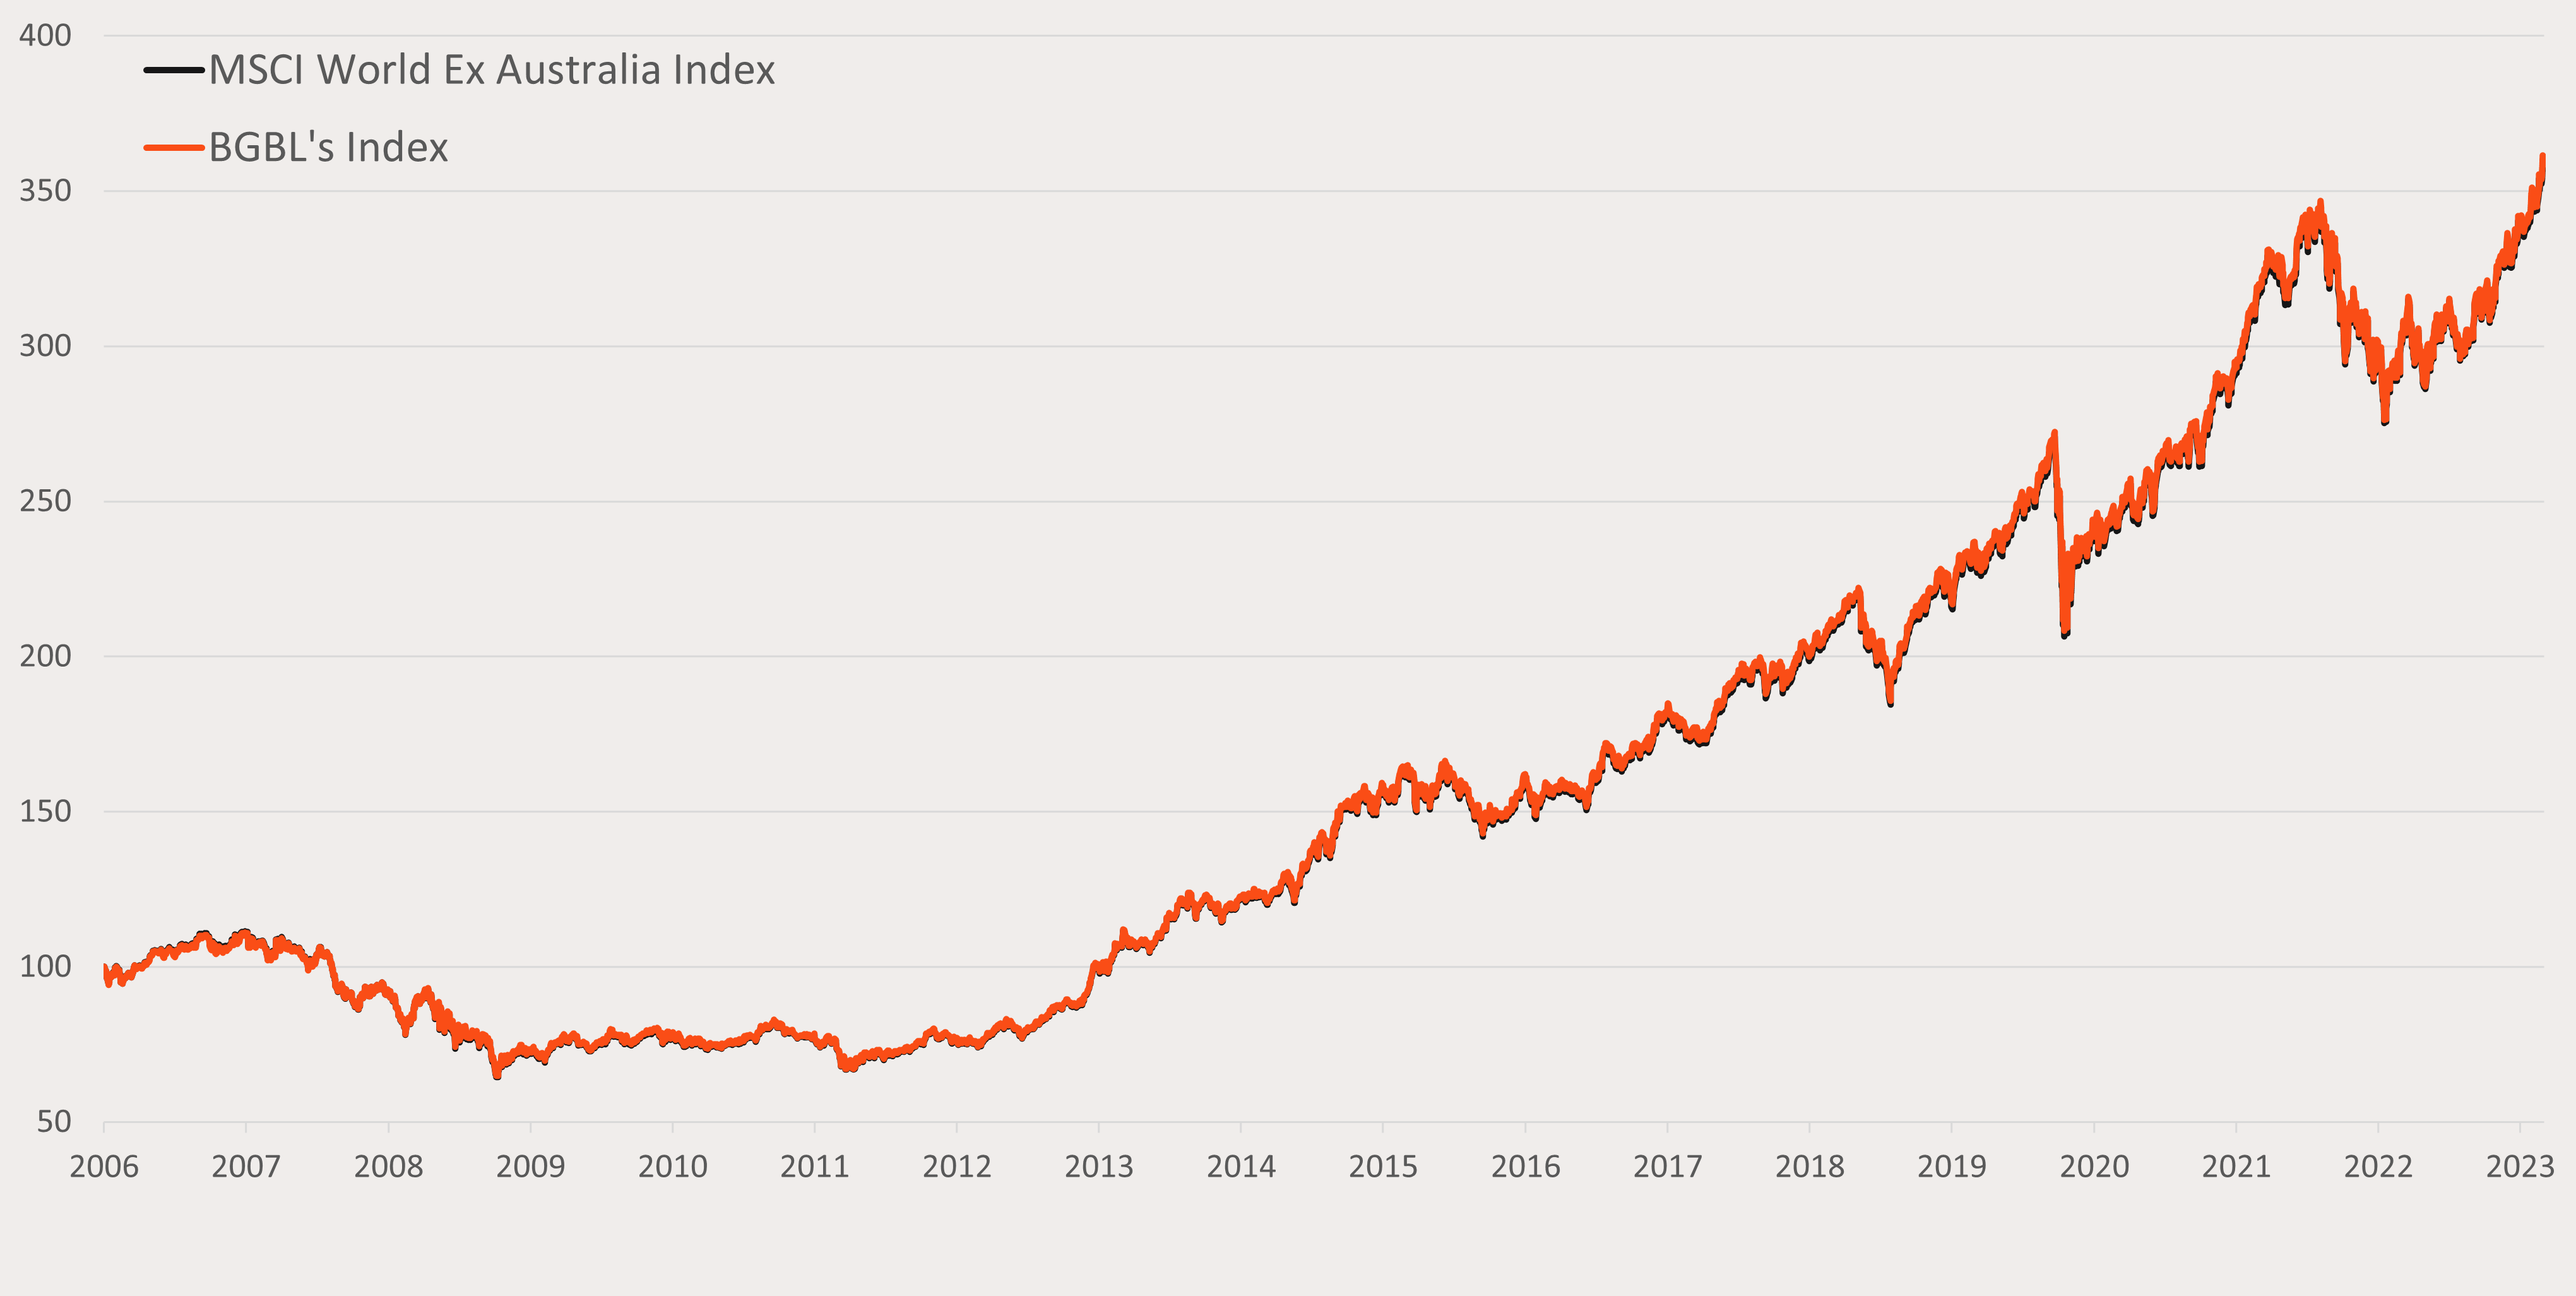 Source: Bloomberg and Morningstar Direct. As at 30/06/2023 since common inception 01/06/2006. Currency: Australian Dollar. Past performance is not an indicator of future performance. You cannot invest directly in an index. Index performance does not include any ETF fees or costs. BGBL’s inception date was 9 May 2023.
Over the past decade, we have seen a significant flow in funds under management (FUM) from Australian actively managed global equity funds to passive alternatives. In 2013, 75% of FUM was held by active managers, with just 25% in passive funds. By June 2023, this had shifted to 56% and 44% respectively1. This is likely attributable, at least in part, to performance and fees.
Would investors have been better off in an active or passive global equity fund?
For 20 years, S&P Dow Jones Indices have been reporting on the performance of active managers against passive benchmarks. The data allows us to evaluate active manager outperformance over the benchmark each year, as well as how many managers have generated persistent outperformance over longer timeframes.
Claims that increasing interest rates and heightened economic uncertainty would lead to active manager outperformance in 2022 appear to have been misplaced. Last year, only 44% of Australian active managers in the international equities category outperformed the benchmark. The proportion of active funds outperforming over 5- and 10-year periods shrank to 14% and 5%, respectively.
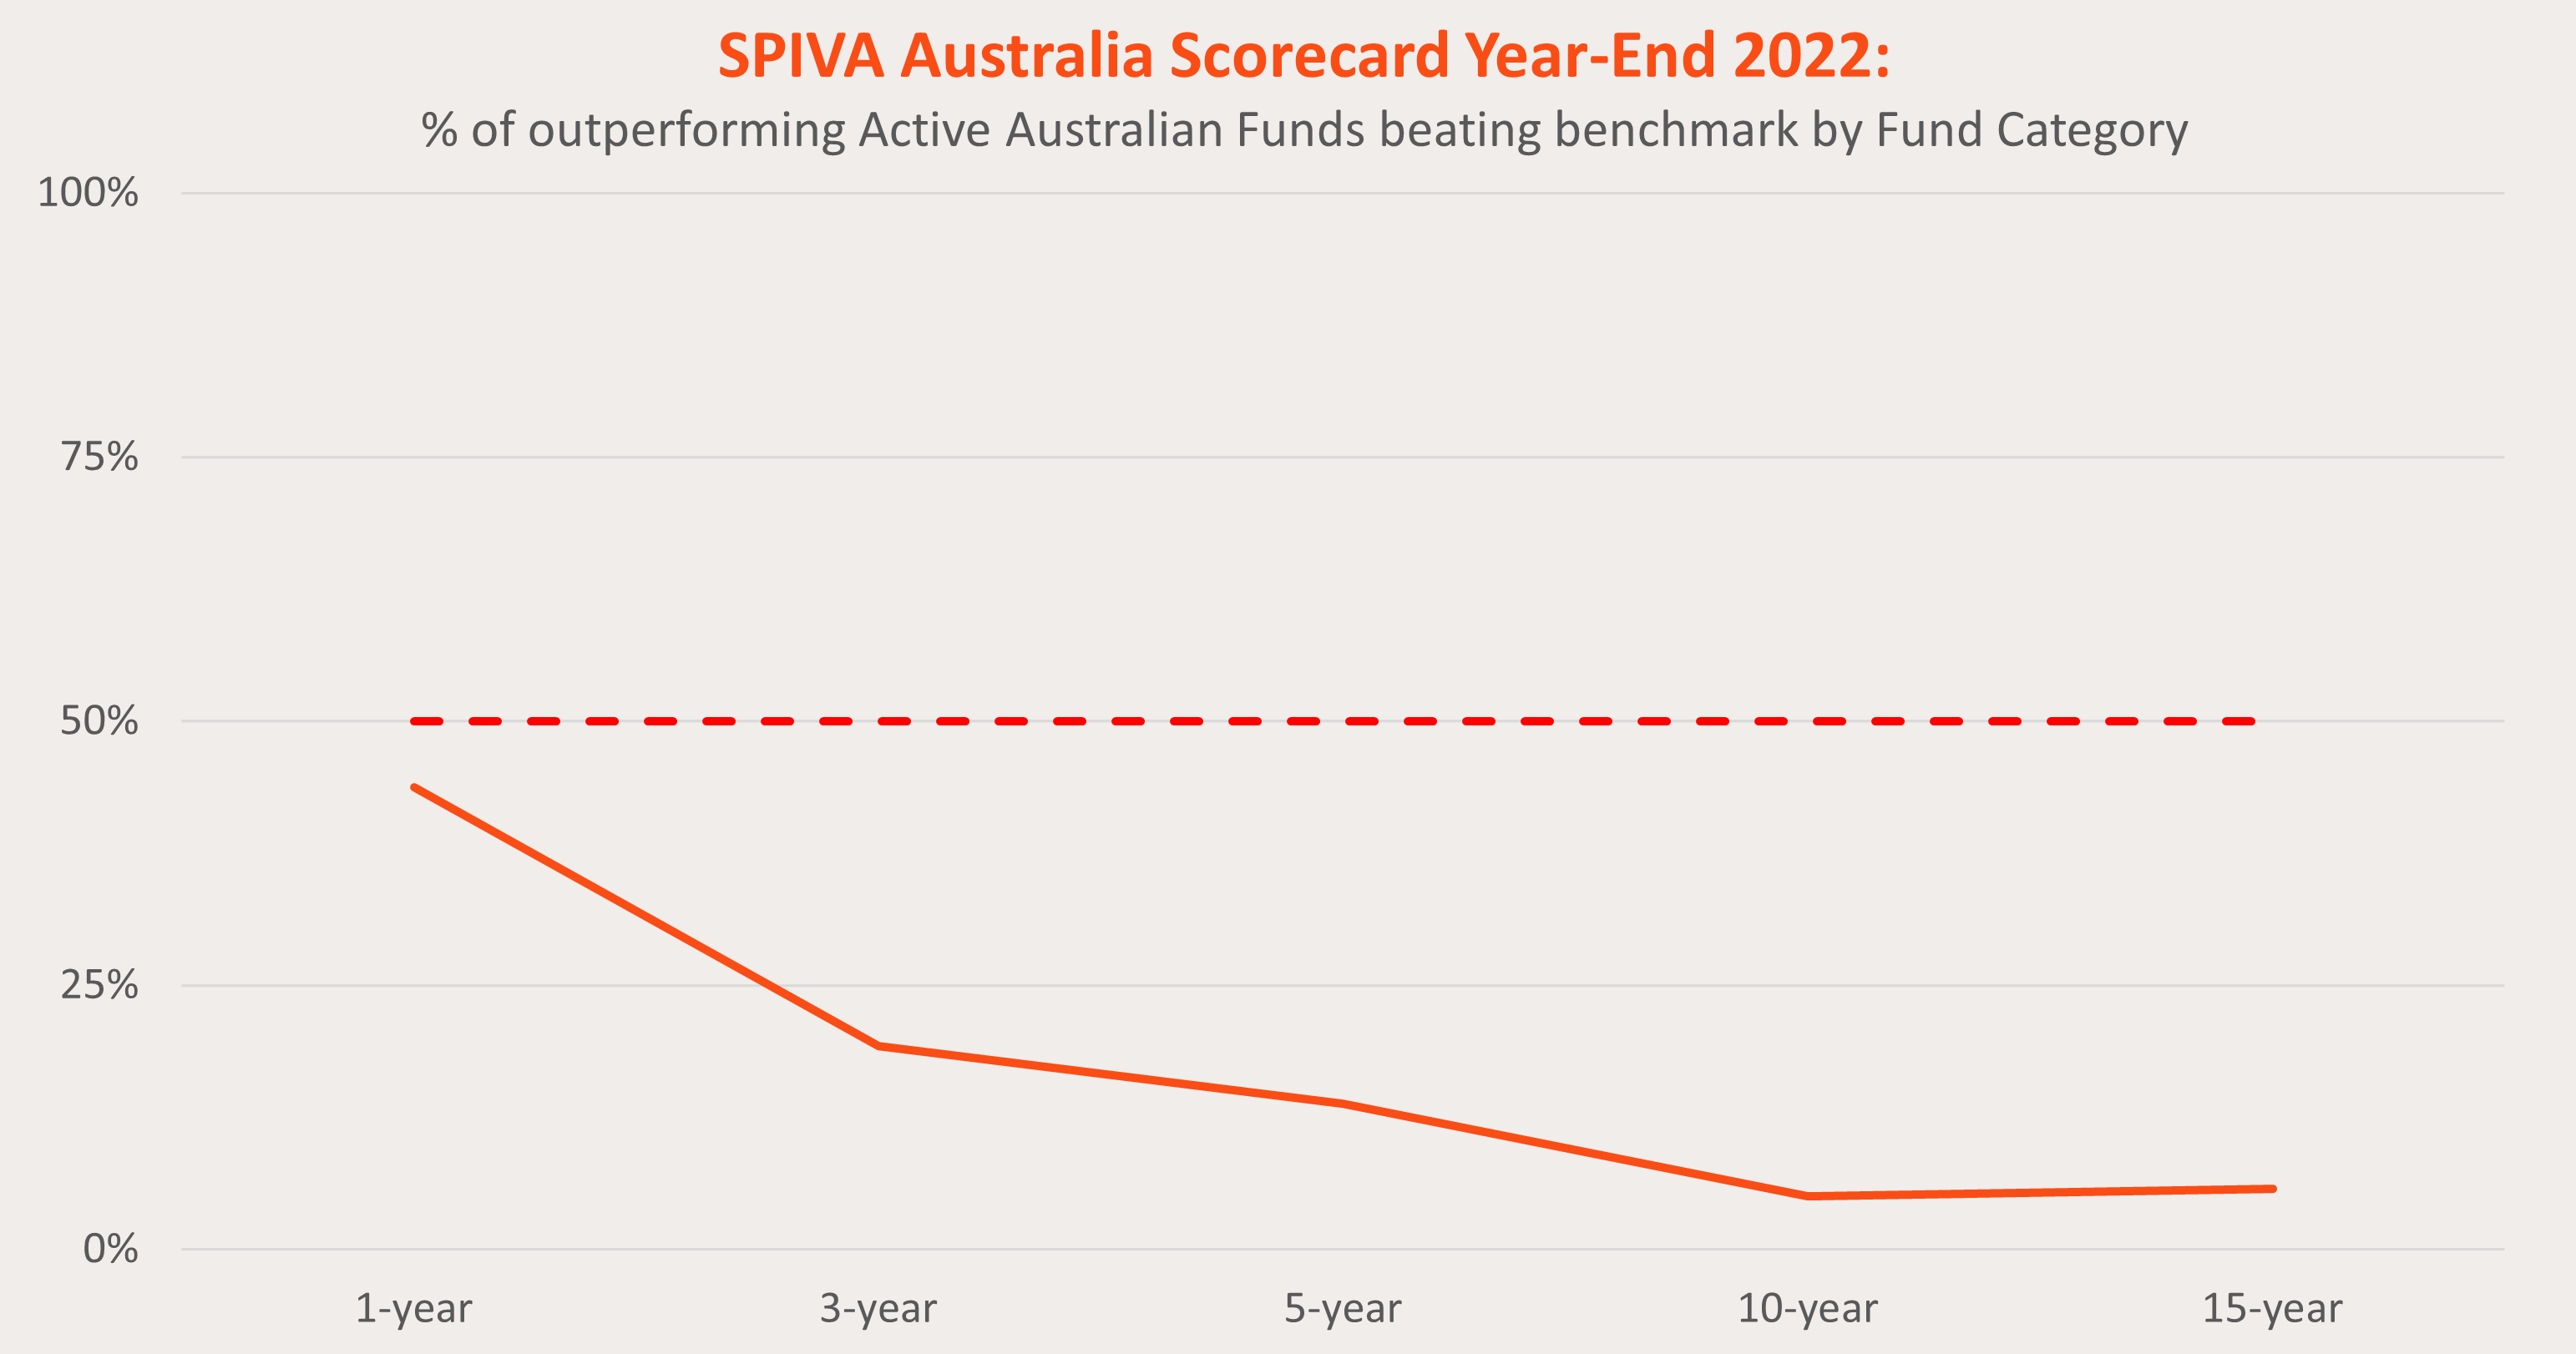
Source: S&P Dow Jones. Past performance is not indicative of future performance.
Why fees matter
Fees, like returns, compound over time and can meaningfully impact portfolio returns. A simple example shows just how significant this impact can be.
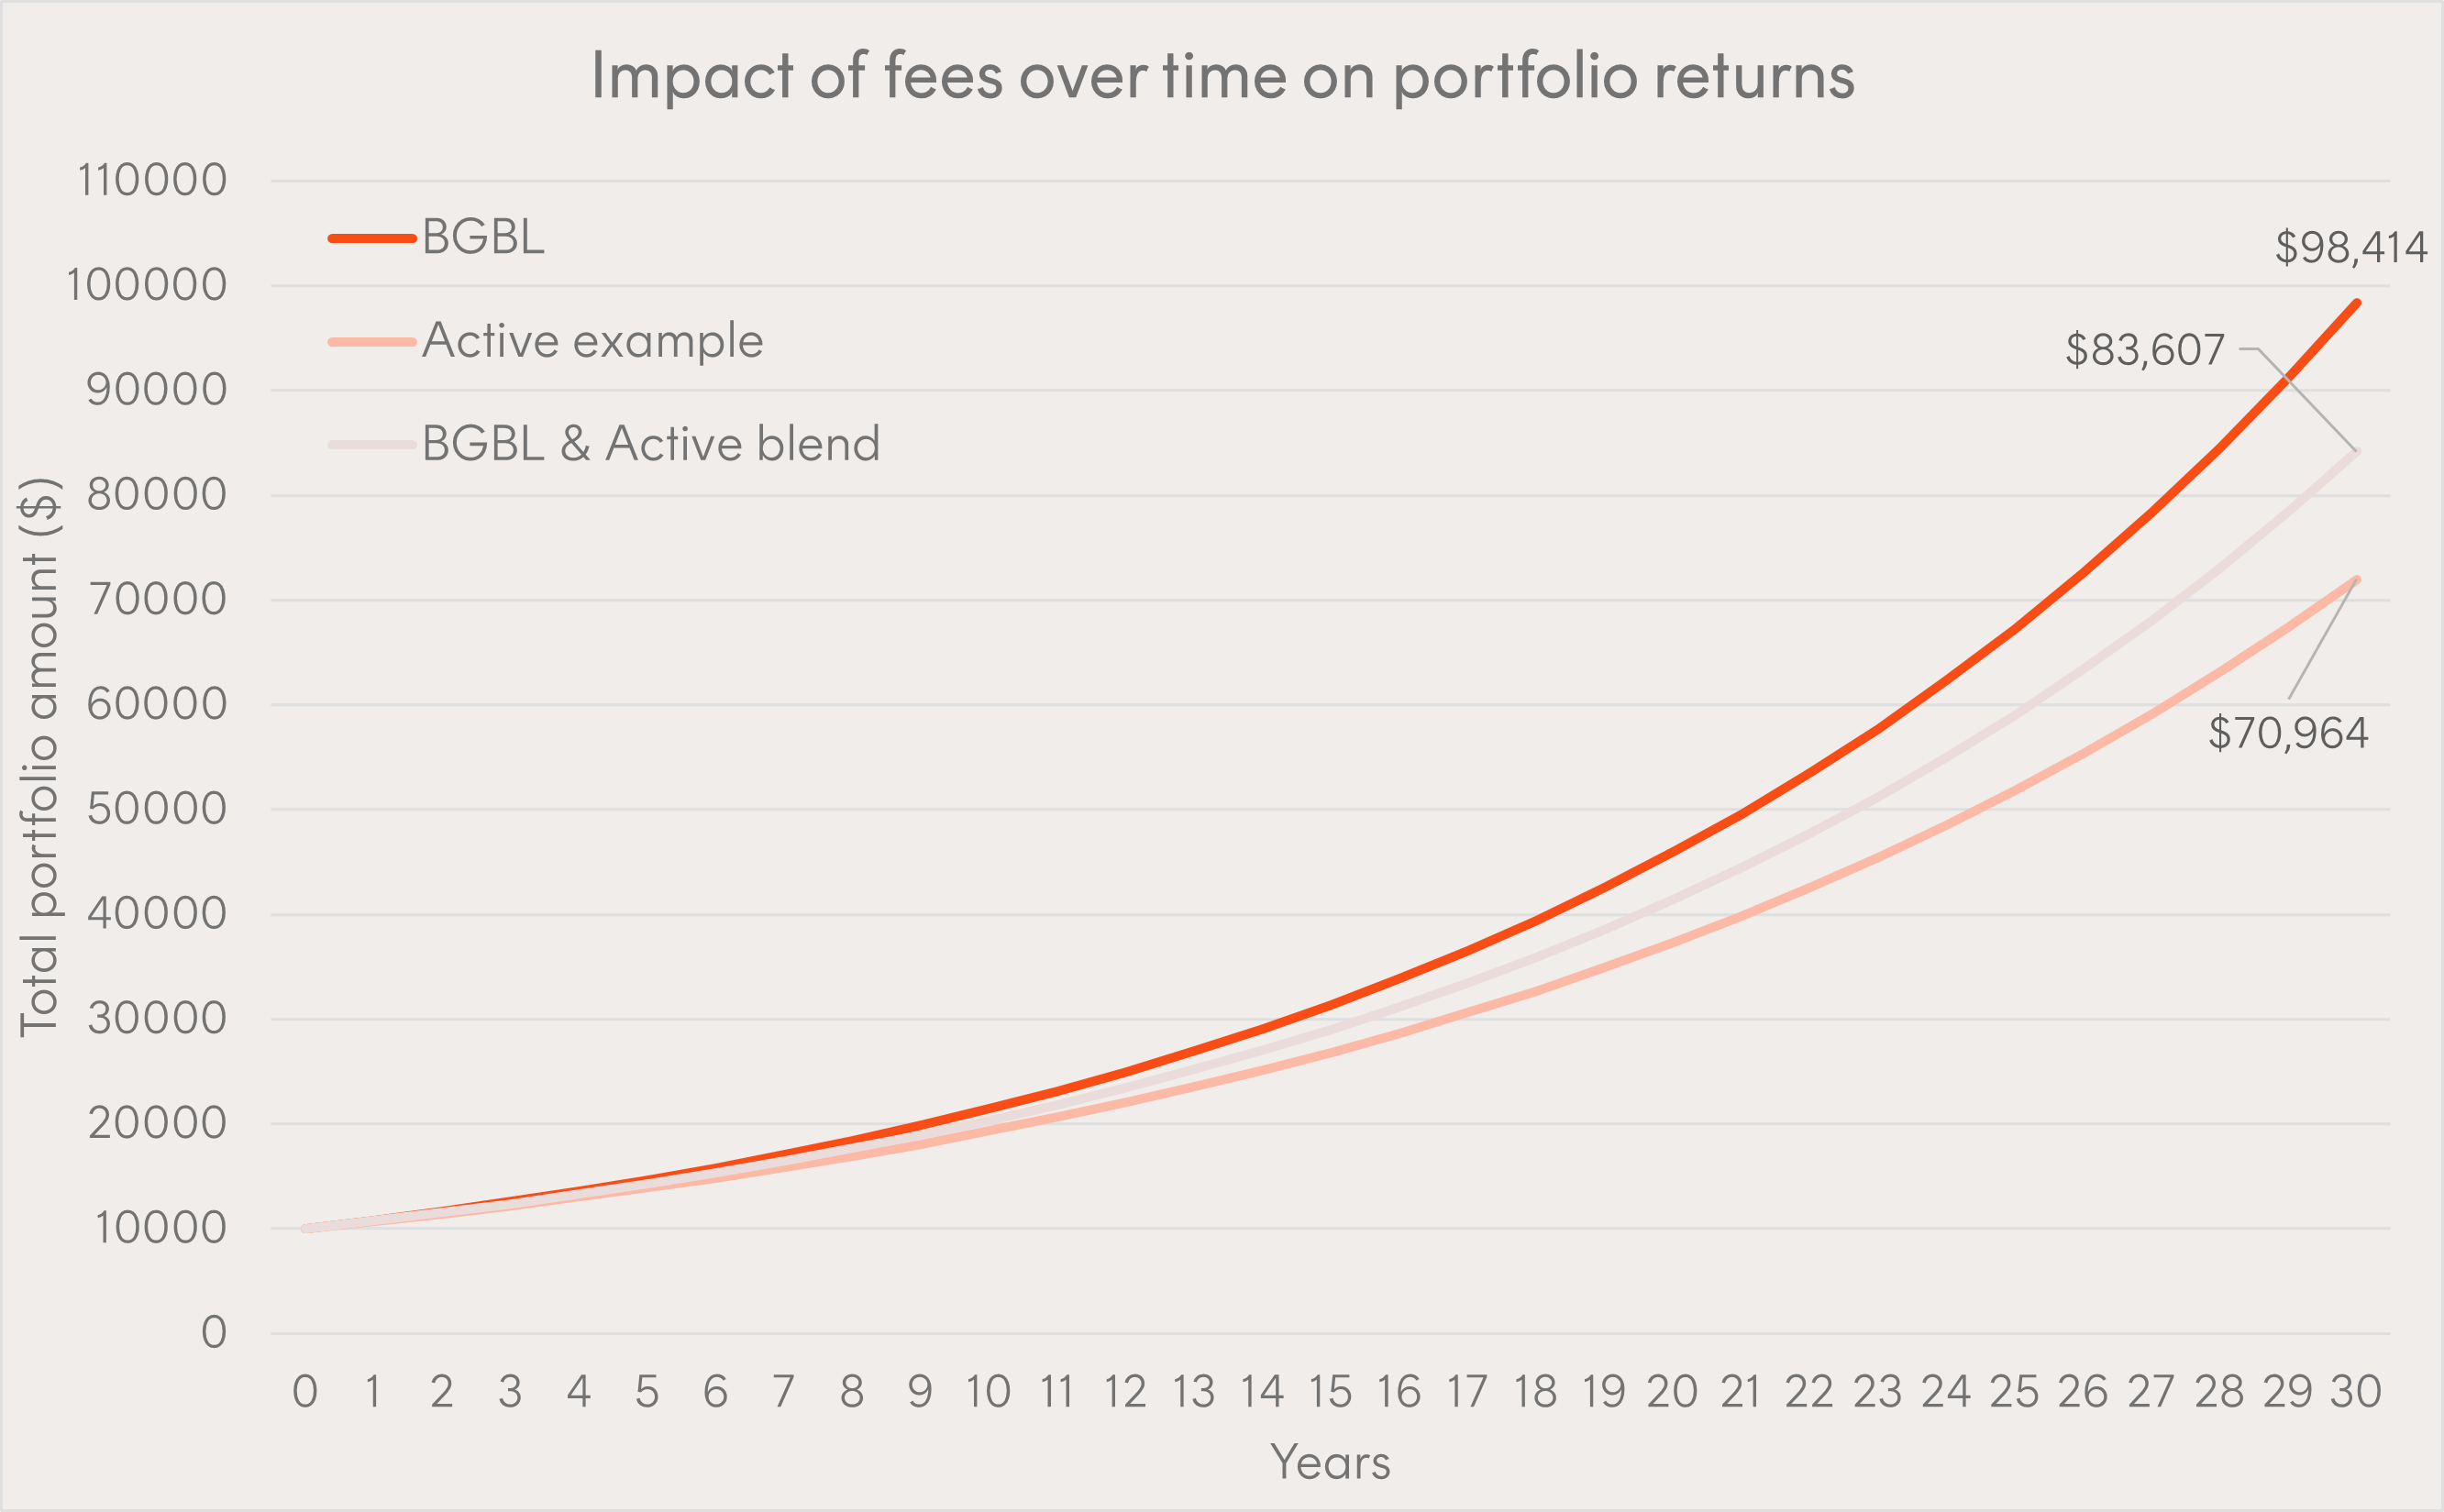
Source: Betashares. Illustrative only, using certain assumptions (as described below). Actual results may differ.
Assume an initial investment of $10,000, returning 8% p.a. pre-fees over a 30-year time horizon, with a passive fund management cost of 0.08% p.a. (i.e. the management cost for BGBL), and an active fund management cost of 1.20% p.a. (being the average management cost for Australian broad market active managers2). Over a 30-year period, the passive fund would be expected to grow to $98,414, compared to just $70,964 for the active fund – a 39% difference.
Alternatively, blending the passive fund into an existing portfolio of active funds, with the same assumed management cost of 1.20% p.a., could also have a material impact. For example, a 50/50 blend (based on the same return and time horizon assumptions noted above) would result in an end portfolio value of $83,607, 18% above the active only portfolio, and an all-in management cost reduction from 1.20% to 0.64% p.a.
Given the difficulty in choosing active managers who outperform passive benchmarks, and the impact of fees, we believe low-cost ETFs like BGBL could be better suited for long-term portfolio allocations.
Where can BGBL fit in a portfolio?
BGBL is designed to be a cost-effective core allocation for the international equities portion of a portfolio. Its benefits include:
- Low all-in fees: Implementing with BGBL can reduce ongoing fees in a portfolio.
- Tax-efficiency: BGBL offers potential tax efficiencies over active and unlisted funds due to the potential for lower turnover and other efficiencies of an ETF structure. Further, HGBL’s currency hedging component complies with TOFA regulations to maximise tax efficiency.
- International exposure: BGBL’s Index invests in around 1,500 companies from 23 developed markets (ex-Australia), making it suitable as a core international equities building block.
- Diversification: BGBL’s Index is broadly diversified across global developed market stocks and sectors. BGBL’s Index sector profile can benefit Australian portfolios that are concentrated in financials and resources.
You can find more information on BGBL at its fund page here and HGBL at its fund page here.
BGBL and HGBL are rated ‘Highly Recommended’ by Lonsec. You can request the research reports from your BDM or by filling in the form under the following link.
For more information on Betashares ETF platform availability, please use the following link.
HGBL
Global Shares Currency Hedged ETF
keyboard_arrow_down
A convenient, cost-effective way to build a core portfolio allocation to global equities, hedged into Australian dollars.
BGBL
Global Shares ETF
keyboard_arrow_down
A convenient, cost-effective way to build a core portfolio allocation to global equities.
There are risks associated with BGBL and HGBL, including market risk, international investment risk, and country risk, as well as currency hedging risk (for HGBL). Investment value can go up and down. An investment in the funds should only be made after taking into account the investor’s particular circumstances, including their tolerance for risk. For more information on risks and other features of these funds, please see the Product Disclosure Statement (PDS) and Target Market Determination (TMD), available at www.betashares.com.au.
The Lonsec Ratings (assigned 20 July 2023) presented in this document is published by Lonsec Research Pty Ltd ABN 11 151 658 561 AFSL 421 445. The Rating is limited to “general advice” (as defined in the Corporations Act 2001) and based solely on consideration of the investment merits of the financial product. Past performance information is for illustrative purposes only and is not indicative of future performance. It is not a recommendation to purchase, sell or hold any Betashares fund, and you should seek independent financial advice before investing in this product. The Rating is subject to change without notice and Lonsec assumes no obligation to update the relevant document following publication. Lonsec receives a fee from the Betashares for researching the product using comprehensive and objective criteria. For further information regarding Lonsec’s Ratings methodology, please go to http://www.lonsecresearch.com.au/research-solutions/our-ratings.
* Other costs, such as transaction costs, may apply. Refer to the PDS, available at www.betashares.com.au, for more information.
1. Morningstar Direct. Universe includes Morningstar Categories: Australia Fund Equity World Large Blend, Large Growth, Large Value, and large geared. Data point used is “Net Assets – Share Class (monthly)” for December 2013 and June 2023.
2. Morningstar Direct. Includes Morningstar Category: Australian Fund Equity Large Blend, Large Growth, Large Value. As at 4 May 2023.
Explore
Markets