
Investing in the space economy - from launch pad to commercial reality

Tom Wickenden
6 minutes reading time
- Technology
Related articles

Better investing starts here
Get Betashares Direct
Betashares Direct is the new investing platform designed to help you build wealth, your way.
Scan the code to download.
Learn more
Learn more
The Nasdaq 100 has grown to be one of the most widely recognised indices in the world. Measuring the performance of the 100 largest non-financial companies listed on the Nasdaq exchange, the index has become synonymous with the world’s largest technology companies including Apple, Microsoft, and Google.
While its early notoriety came in the late 1990’s during the dot-com bubble, which was characterised by unjustified valuations for unprofitable technology companies, the Nasdaq has since evolved into an index comprising global businesses with strong fundamental growth supporting their impressive returns.
Over the 20 years to October 2023 the Nasdaq 100 has returned 13% p.a. compared to 8% p.a. and 6% p.a. for the S&P 500 and S&P/ASX 200 respectively.
Chart 1: Nasdaq 100 vs. Benchmark Indices. Total return Jan 1, 1995 = 100.
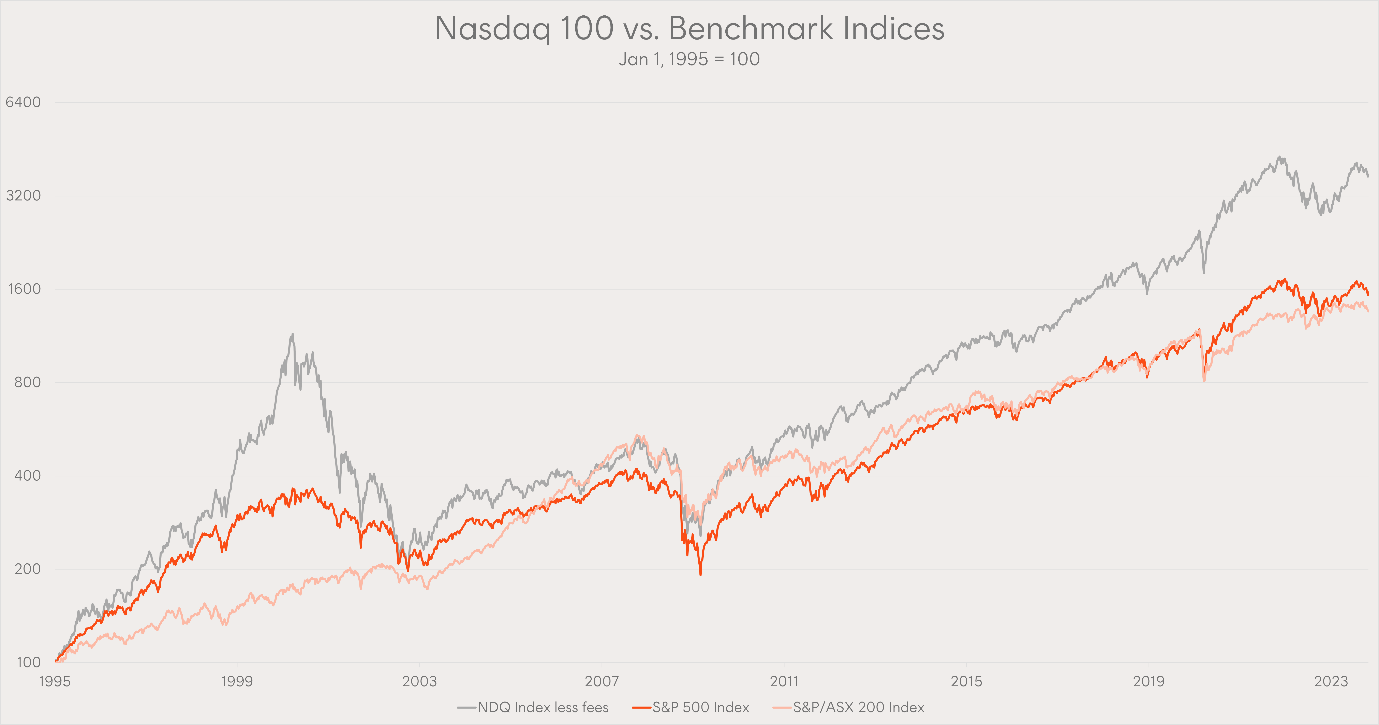
Source: Bloomberg, Betashares. As at 31 October 2023. NDQ’s index is the Nasdaq 100 Index. NDQ’s inception date was 26 May 2015. Chart shows index performance (not actual fund performance) after deducting NDQ’s management fees of 0.48% p.a. You cannot invest directly in an index. Past performance is not an indicator of future performance.
Innovation driven growth
In the 12 months to June 2023, companies in the Nasdaq 100 spent 7x the amount on R&D as companies in the S&P 500 (excluding Nasdaq listed companies)1. This level of investment into areas of potential future growth has been a hallmark of the Nasdaq 100 over the past two decades. Attracting the biggest names in global technology, companies listed on the Nasdaq have emerged as leaders in gaming, search, big data and cloud computing.
More recently as markets shift their focus to machine learning and artificial intelligence (AI), the Nasdaq 100 again has a head start. With the ability to leverage their existing competitive advantages, companies listed on the Nasdaq like Microsoft (whose partnership with ChatGPT provider OpenAI started in 2016), Google (who acquired AI startup DeepMind in 2014), and Nvidia (who started laying the foundations to become the engine room for AI hardware in 2006) have already been investing in AI for a long time with the aim of becoming leaders in the area.
Breaking down the index into its constituent’s exposure to areas of future growth potential, we find that the Nasdaq 100 provides exposure across a broad subset of potentially promising investment themes. Most notably to AI, robotics, and cloud computing.
Chart 2: Nasdaq 100 exposure per theme
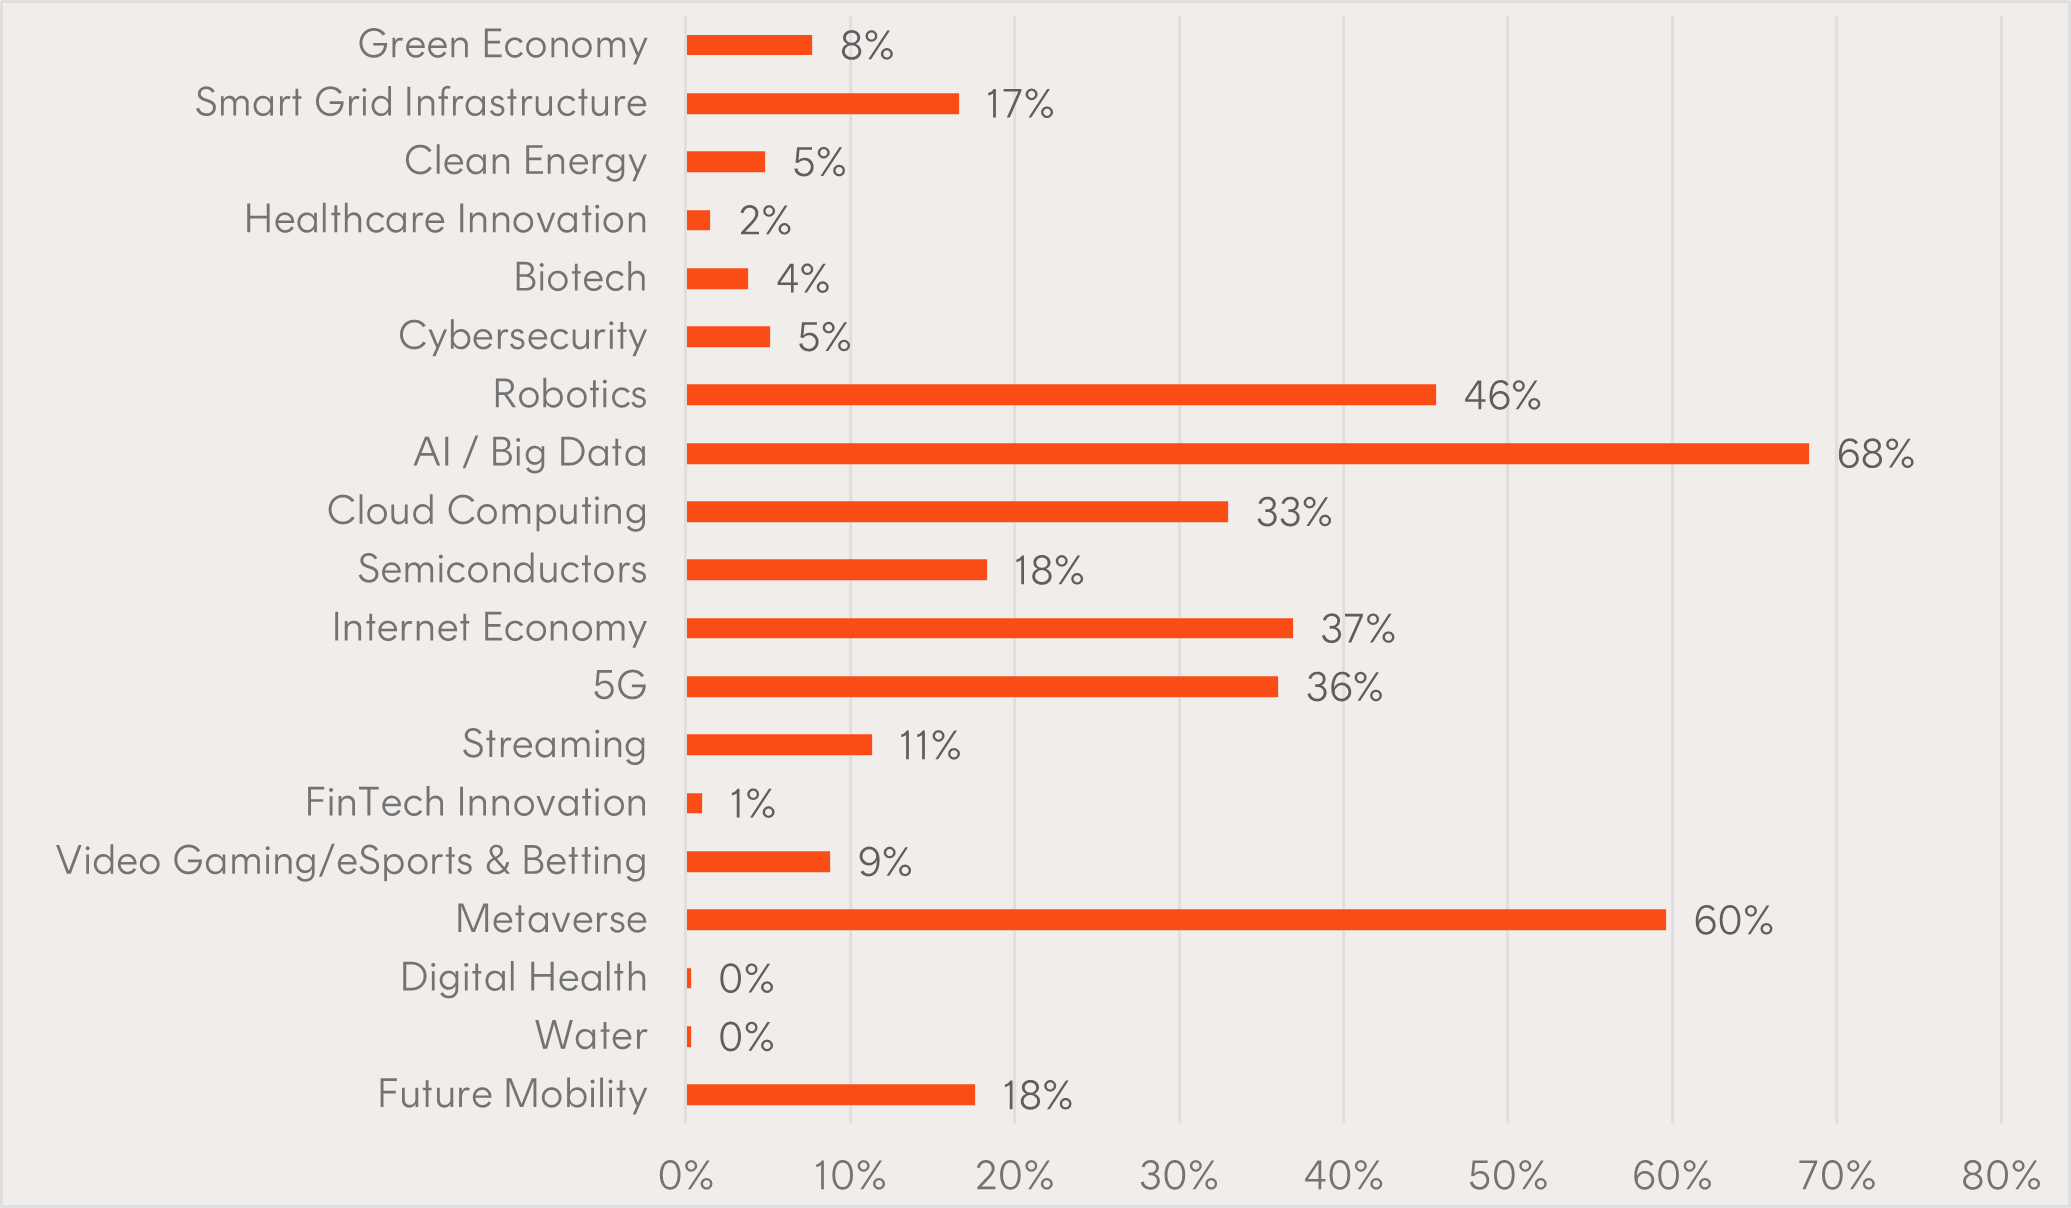
Source: Nasdaq, FactSet. Data as of 06/30/2023. Based on overlap with existing Nasdaq Thematic Indices, except for 5G, Streaming, and Video Gaming/eSports & Betting where competitor products were analyzed.
Solving the innovator’s dilemma
A great example of this innovation driven growth is Nasdaq giant Microsoft. In 2013, many questioned if Microsoft would survive as the business looked to be the latest victim of the “innovator’s dilemma” – describing an established business’s failure to risk disrupting themselves in response to competitive innovators. A Bloomberg article from that year titled “Microsoft’s Useful Life May Be Near Its End” proposed this very hypothesis.
These commentators failed to appreciate the groundwork being done by Microsoft to successfully embrace innovation once again, as they did with their original enterprise software. Two years earlier Microsoft ranked 5th globally for R&D spending2. Of this, 90% or $US8.6 billion was being spent on cloud computing technology3 seeking to disrupt their own locally stored enterprise model.
Fast forward to 2023’s US Q1 reporting season and Microsoft made headlines as sales in its cloud division were up 24% to $US32 billion. Investors took this as a sign that the company was ahead in not only the highly profitable cloud computing space, but also poised to capitalise on surging demand for AI technology.
Microsoft has ridden a wave of R&D led growth over the past two decades. This has been a shared trait of Nasdaq 100 companies. Today, five of the largest seven R&D spenders globally are in the Nasdaq 100[4]. Their success has translated into impressive revenue, earnings, and dividend growth.
Chart 3: Nasdaq 100 and S&P 500 historical revenue, earnings, and dividend growth. 2003 to 2023. 31 Dec 2003 = 100
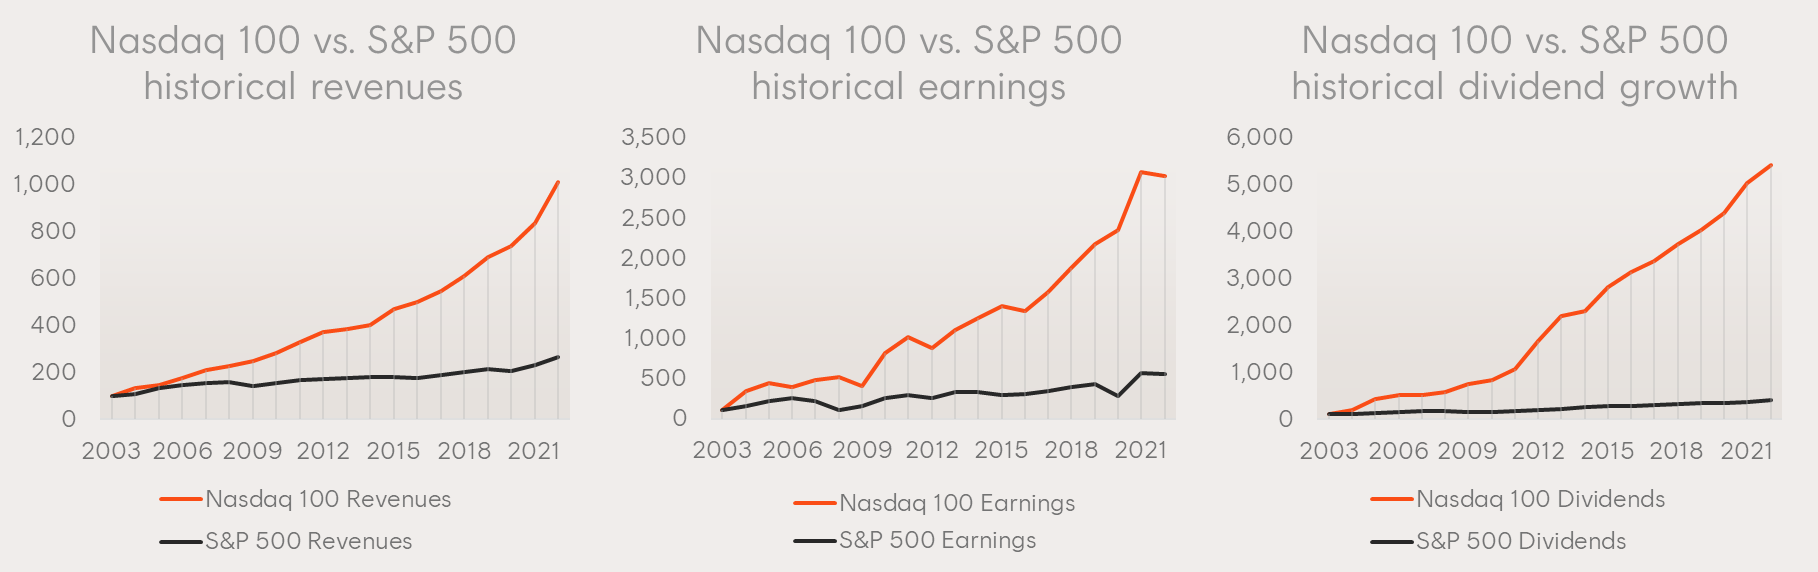
Source: Nasdaq. As at 30 June 2023. Graph shows revenues, earnings and dividend growth performance calculated on Nasdaq 100 Index v S&P 500, not ETF performance and does not take into account ETF management costs. You cannot invest directly in an index. Past performance is not an indicator of future performance.
Betashares proudly offers Australian investors exclusive access to the Nasdaq 100 Index through Betashares Nasdaq 100 ETF (ASX: NDQ) with a currency hedged option (ASX: HNDQ). NDQ is Betashares’ largest ETF with over $3 billion in funds under management. For more information on NDQ please visit the fund page through the link below.
Buy ETFs effortlessly with Betashares Direct
Betashares Direct is the new investing platform designed to help you build wealth, your way. Access NDQ through Betashares Direct, along with the 350+ other ETFs that trade on the ASX.
Get early access
NDQ
Nasdaq 100 ETF
keyboard_arrow_down
Invest in the Nasdaq 100 in a single trade
HNDQ
Nasdaq 100 Currency Hedged ETF
keyboard_arrow_down
Currency hedged exposure to the Nasdaq 100 in a single trade
There are risks associated with an investment in NDQ, including market risk, country risk, currency risk and sector risk. Investment value can go up and down. An investment in the Fund should only be considered as a part of a broader portfolio, taking into account your particular circumstances, including your tolerance for risk. For more information on risks and other features of the Fund, please see the Product Disclosure Statement and Target Market Determination, both available on this website.Betashares Capital Limited (ABN 78 139 566 868, AFSL 341181) (Betashares) is the issuer of NDQ (Fund) and Betashares Invest (the IDPS-like scheme available through the Betashares Direct platform). This information is general in nature and doesn’t take into account your financial objectives, situation or needs. You should consider its appropriateness taking into account such factors and seek professional financial advice. Investing involves risk. Before making an investment decision you should read the product disclosure statements (‘PDS’) the Target Market Determination (‘TMD’) for the Fund and Betashares Invest and consider your circumstances and obtain financial advice. This document does not constitute an offer of, or an invitation to purchase or subscribe for securities. To the extent permitted by law Betashares accepts no liability for any errors or omissions or loss from reliance on any of it.
Nasdaq®, Nasdaq-100® and Nasdaq-100 Index® are registered trademarks of Nasdaq Inc. (which with its affiliates is referred to as the “Corporations”) and are licensed for use by Betashares. The Funds have not been passed on by the Corporations as to its legality or suitability. The Funds are not issued, endorsed, sold, or promoted by the Corporations. The Corporations make no warranties and bear no liability with respect to the Funds.
References:
1. Research and development as a percentage of sales. As a total expense Nasdaq 100 companies spent 15x the amount in R&D as the companies in the S&P 500 excluding Nasdaq listed companies.
2. The Economist, https://www.economist.com/graphic-detail/2012/10/30/r-and-d-spending
3. Forbes, https://www.forbes.com/sites/kevinjackson/2011/04/19/cloud-to-command-90-of-microsofts-rd-budget/?sh=30054477571b
4. Statistica.
Explore
Funds