Southern route

Cameron Gleeson
8 minutes reading time
- Sector & regions
- Technology
Related articles


The Nasdaq 100 has evolved to become a global exposure which demands consideration by Australians seeking to construct a diversified portfolio. The index provides exposure to:
- Some of the best companies in the world, with strong forecast earnings growth, and importantly, positive revision to those earnings forecasts in 2024,
- Underlying businesses that generate revenue from across the world, providing exposure to economic growth in all geographic regions,
- Significant diversification benefits when paired with Australian equities, which provides the potential for higher returns and lowering portfolio level volatility.
Has US tech gotten too big, or has it just become more global?
Six Nasdaq stocks now boast market caps well over US$1T, raising questions whether US economic activity can support the ongoing growth of such giants. However, Nasdaq companies should not be seen as US centric businesses. With scalable platforms that transcend national borders, Nasdaq companies generate revenue from a globally diverse customer base.
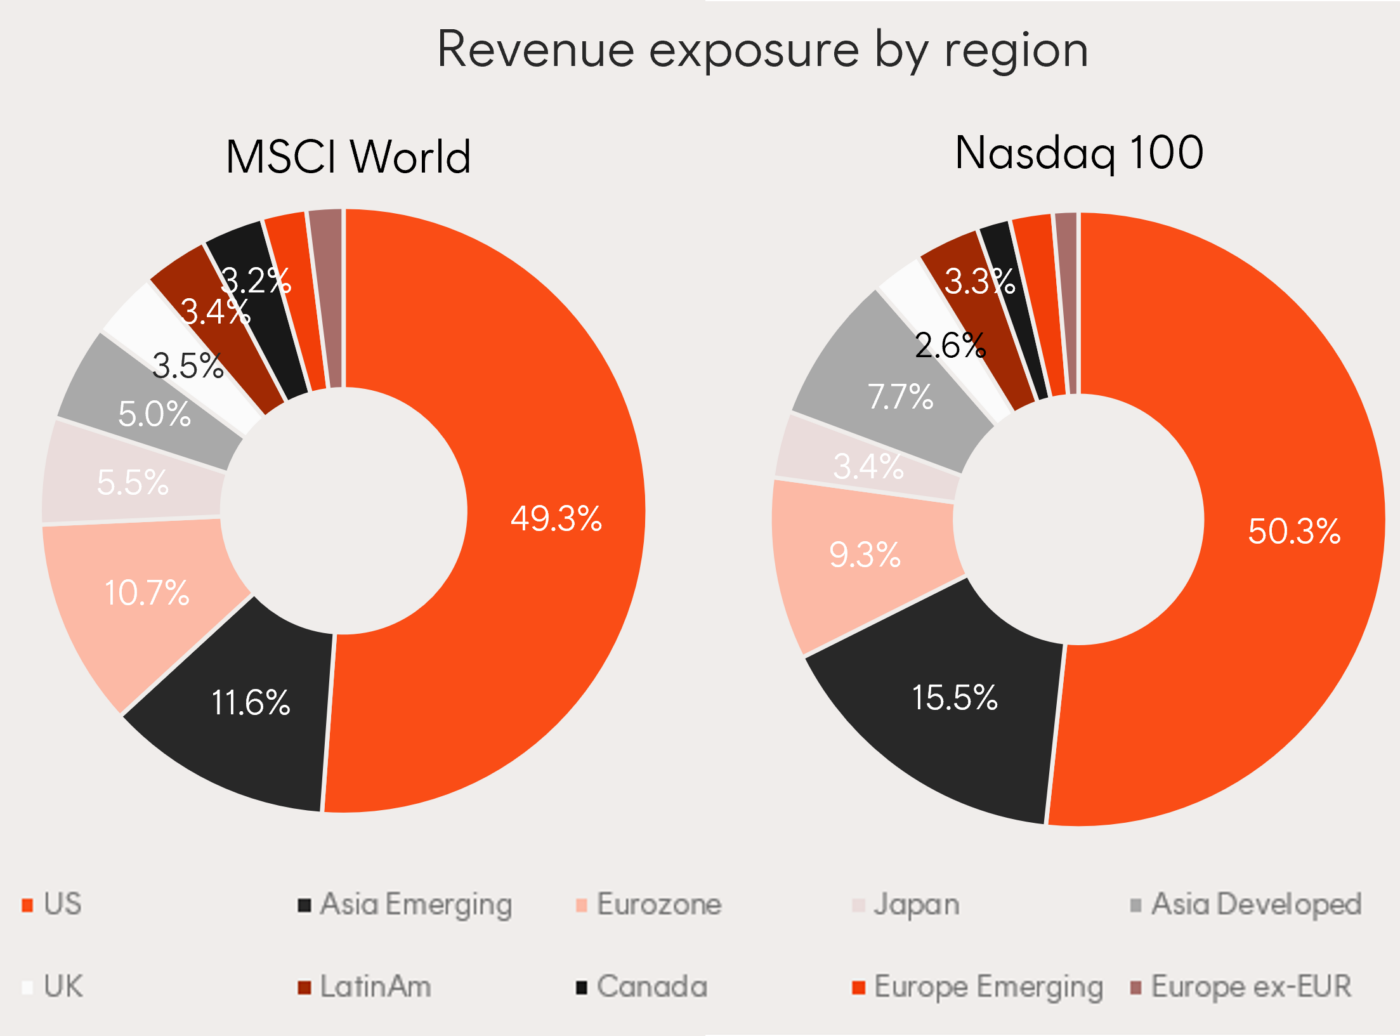
Source: Morningstar, data as at 31 January 2024.
This is evident looking at the revenue source by country of the Nasdaq 100 (on the left) with a very similar split to global equities (as shown for the MSCI World benchmark on the right). This proportion of non-US revenue share has increased over time for the Nasdaq 100, and is now far greater than the S&P500 non-US revenue share of only 40%.
Not only are Nasdaq companies earning more from outside the US, the number of non-US companies choosing to list on the Nasdaq is also increasing. The top 100 stocks include names like Lululemon (Canada), AstraZeneca (UK), ASML (Netherlands) and Mercado Libre (Argentina).
When Australian tech success story, Atlassian, IPO’d in 2015 it completely bypassed the ASX, and opted for the pools of capital of the Nasdaq. While this deprived local investors the opportunity to buy a global tech leader on the ASX, from Atlassian’s perspective, their IPO was “substantially oversubscribed” and the share price was up 32% on the first day of trading1.
The biggest IPO globally last year was British chip design company Arm, which debuted shares on the Nasdaq with a colossal valuation of US$54.5 billion. Another home-grown tech hero, Canva, is considering to IPO on the Nasdaq in a year or two.
The Nasdaq is now effectively a global index, attracting some of the best companies in the world, whether they were founded Silicon Valley, Cambridge UK, or Perth, Western Australia.
Nasdaq 100 – Earnings growth is what matters in the long run
Over the short term, the market is a voting machine (that is, it’s driven by sentiment), but over the long term it’s a weighing machine (where compounding of earnings growth is measured). Given the outperformance of US equities over the last year, it’s important to consider whether the primary driver of these returns was multiple expansion or earnings growth.
Over the past months consensus earnings forecasts have been upgraded in the US and downgraded elsewhere. A deeper dive into US equities shows that earnings upgrades are being driven by companies in the Nasdaq 100. In fact, ex-Nasdaq earnings growth is nothing to get excited about.
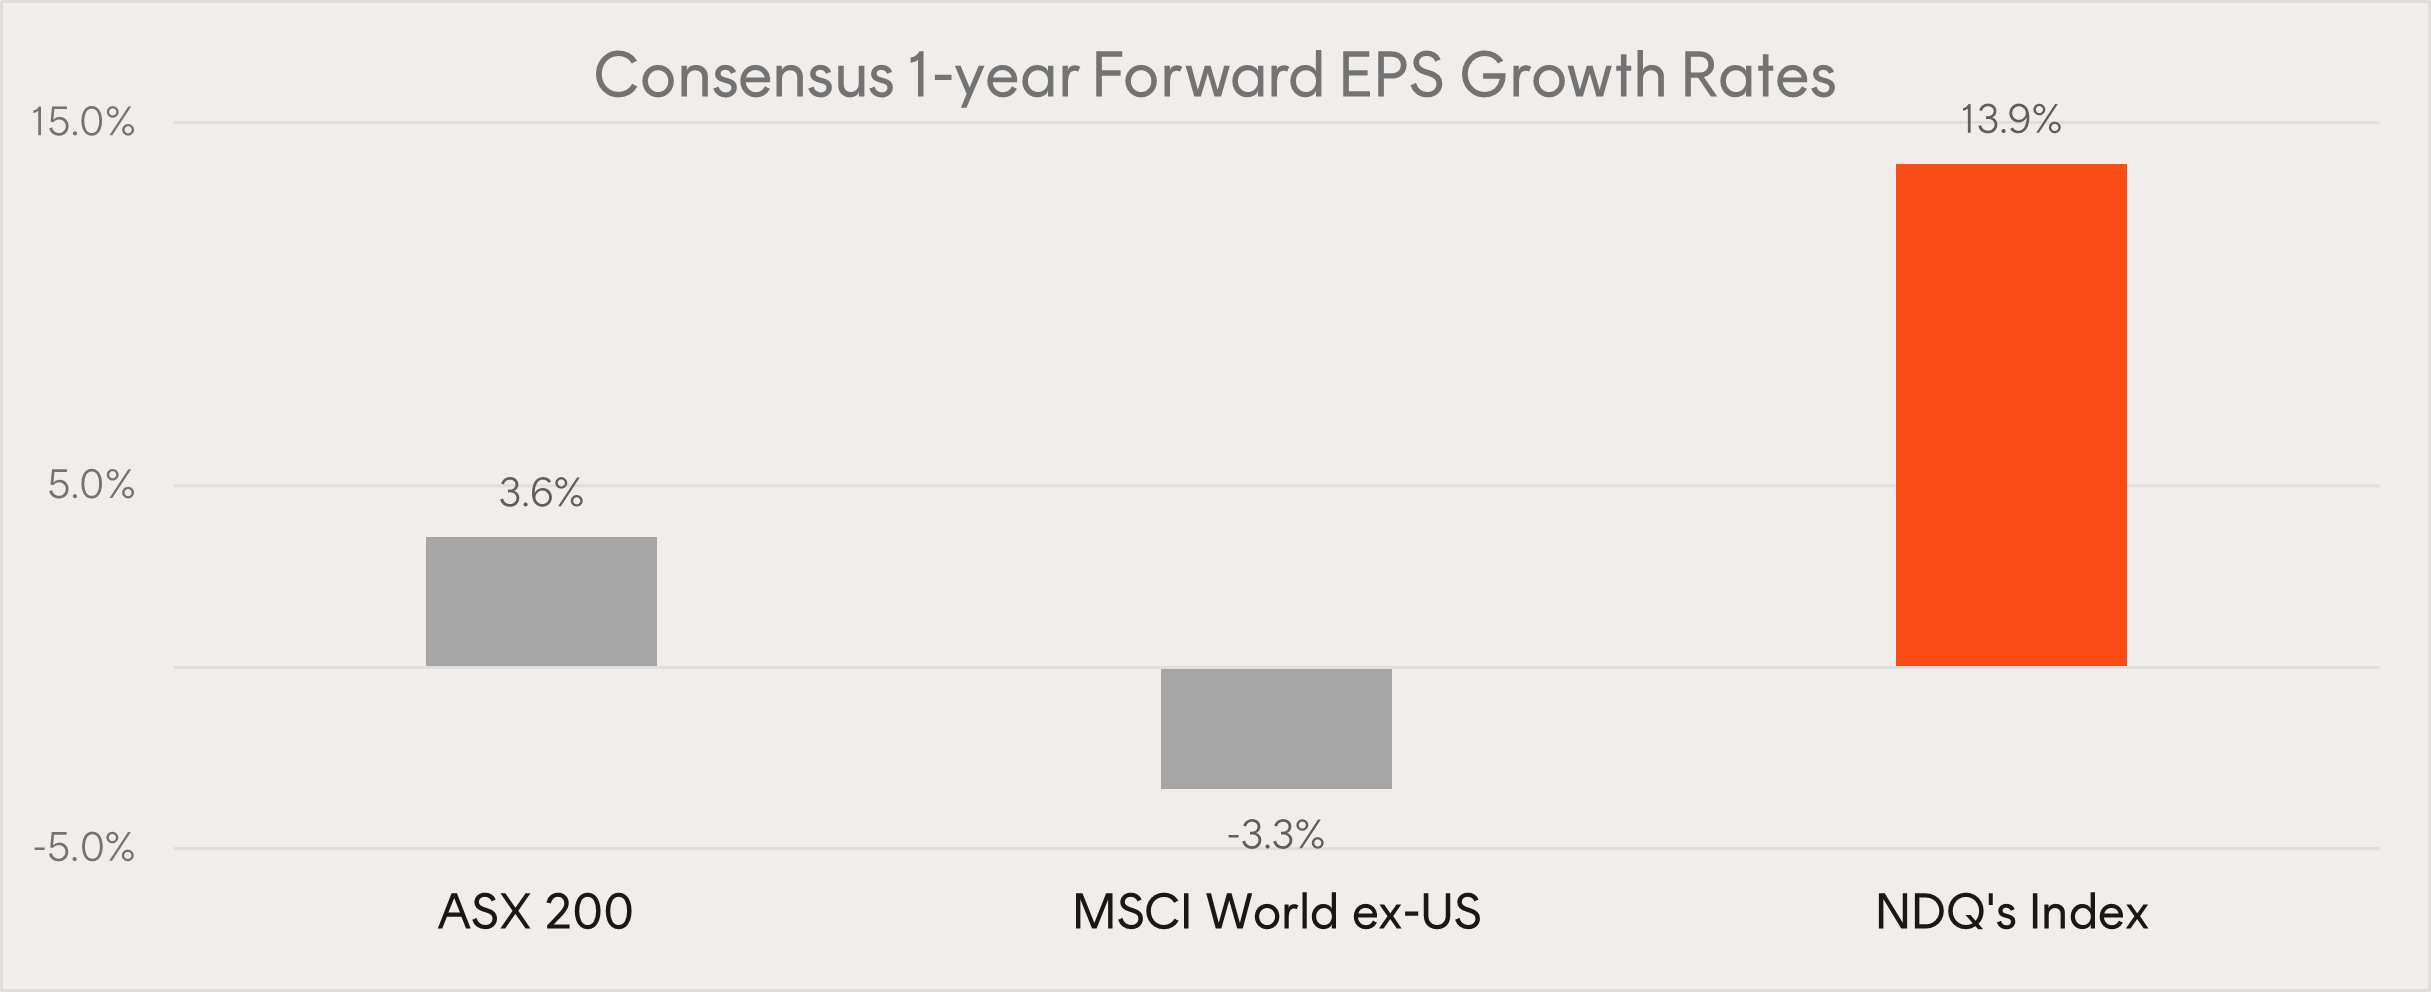
Source: Bloomberg. As at 15 March 2024. Calculations based on 12-month forward EPS estimates.
The stellar performance of the Nasdaq 100 in the 2023 calendar year, can in large part be explained by the strong earnings upgrade cycle many of these stocks have enjoyed. For example:
- Nvidia’s EPS growth outstripped its incredible 239% share price return, meaning its PE ratio actually compressed,
- Amazon’s PE also compressed on stronger earnings growth,
- ASML’s earnings growth was roughly in line with its strong share price performance,
- Most of Meta’s price return was explained by improved fundamentals,
- In the minority was Tesla, who’s earnings fell for the year.
At an index level, the trailing PE for the Nasdaq 100 might sit toward the top end of its long-term range at 30.4x, but the 3-year forward PE is 20.2x2. The Nasdaq 100 arguably looks cheap. If the companies in the index can deliver on the strong earnings growth reflected in the forward PE ratios, the index will be well positioned to continue producing good returns
Nasdaq companies have a history of beating consensus forecasts, and their long run growth story is backed up by their commitment to innovation. On average Nasdaq companies spend nearly 7x as much on R&D as non-Nasdaq S&P500 companies3. Over time this has created a virtuous circle, with the introduction of a new highly profitable product driving earnings growth and funding the development of the next generation of highly profitable products.
A complement for Australian equities
The Australian equity market is dominated by the Financials and Materials sectors, with Information Technology and Communication Services representing only 6.3% combined. By contrast, the Nasdaq 100, which has next to zero exposure to Financials and Materials, may therefore be a well-suited complement.
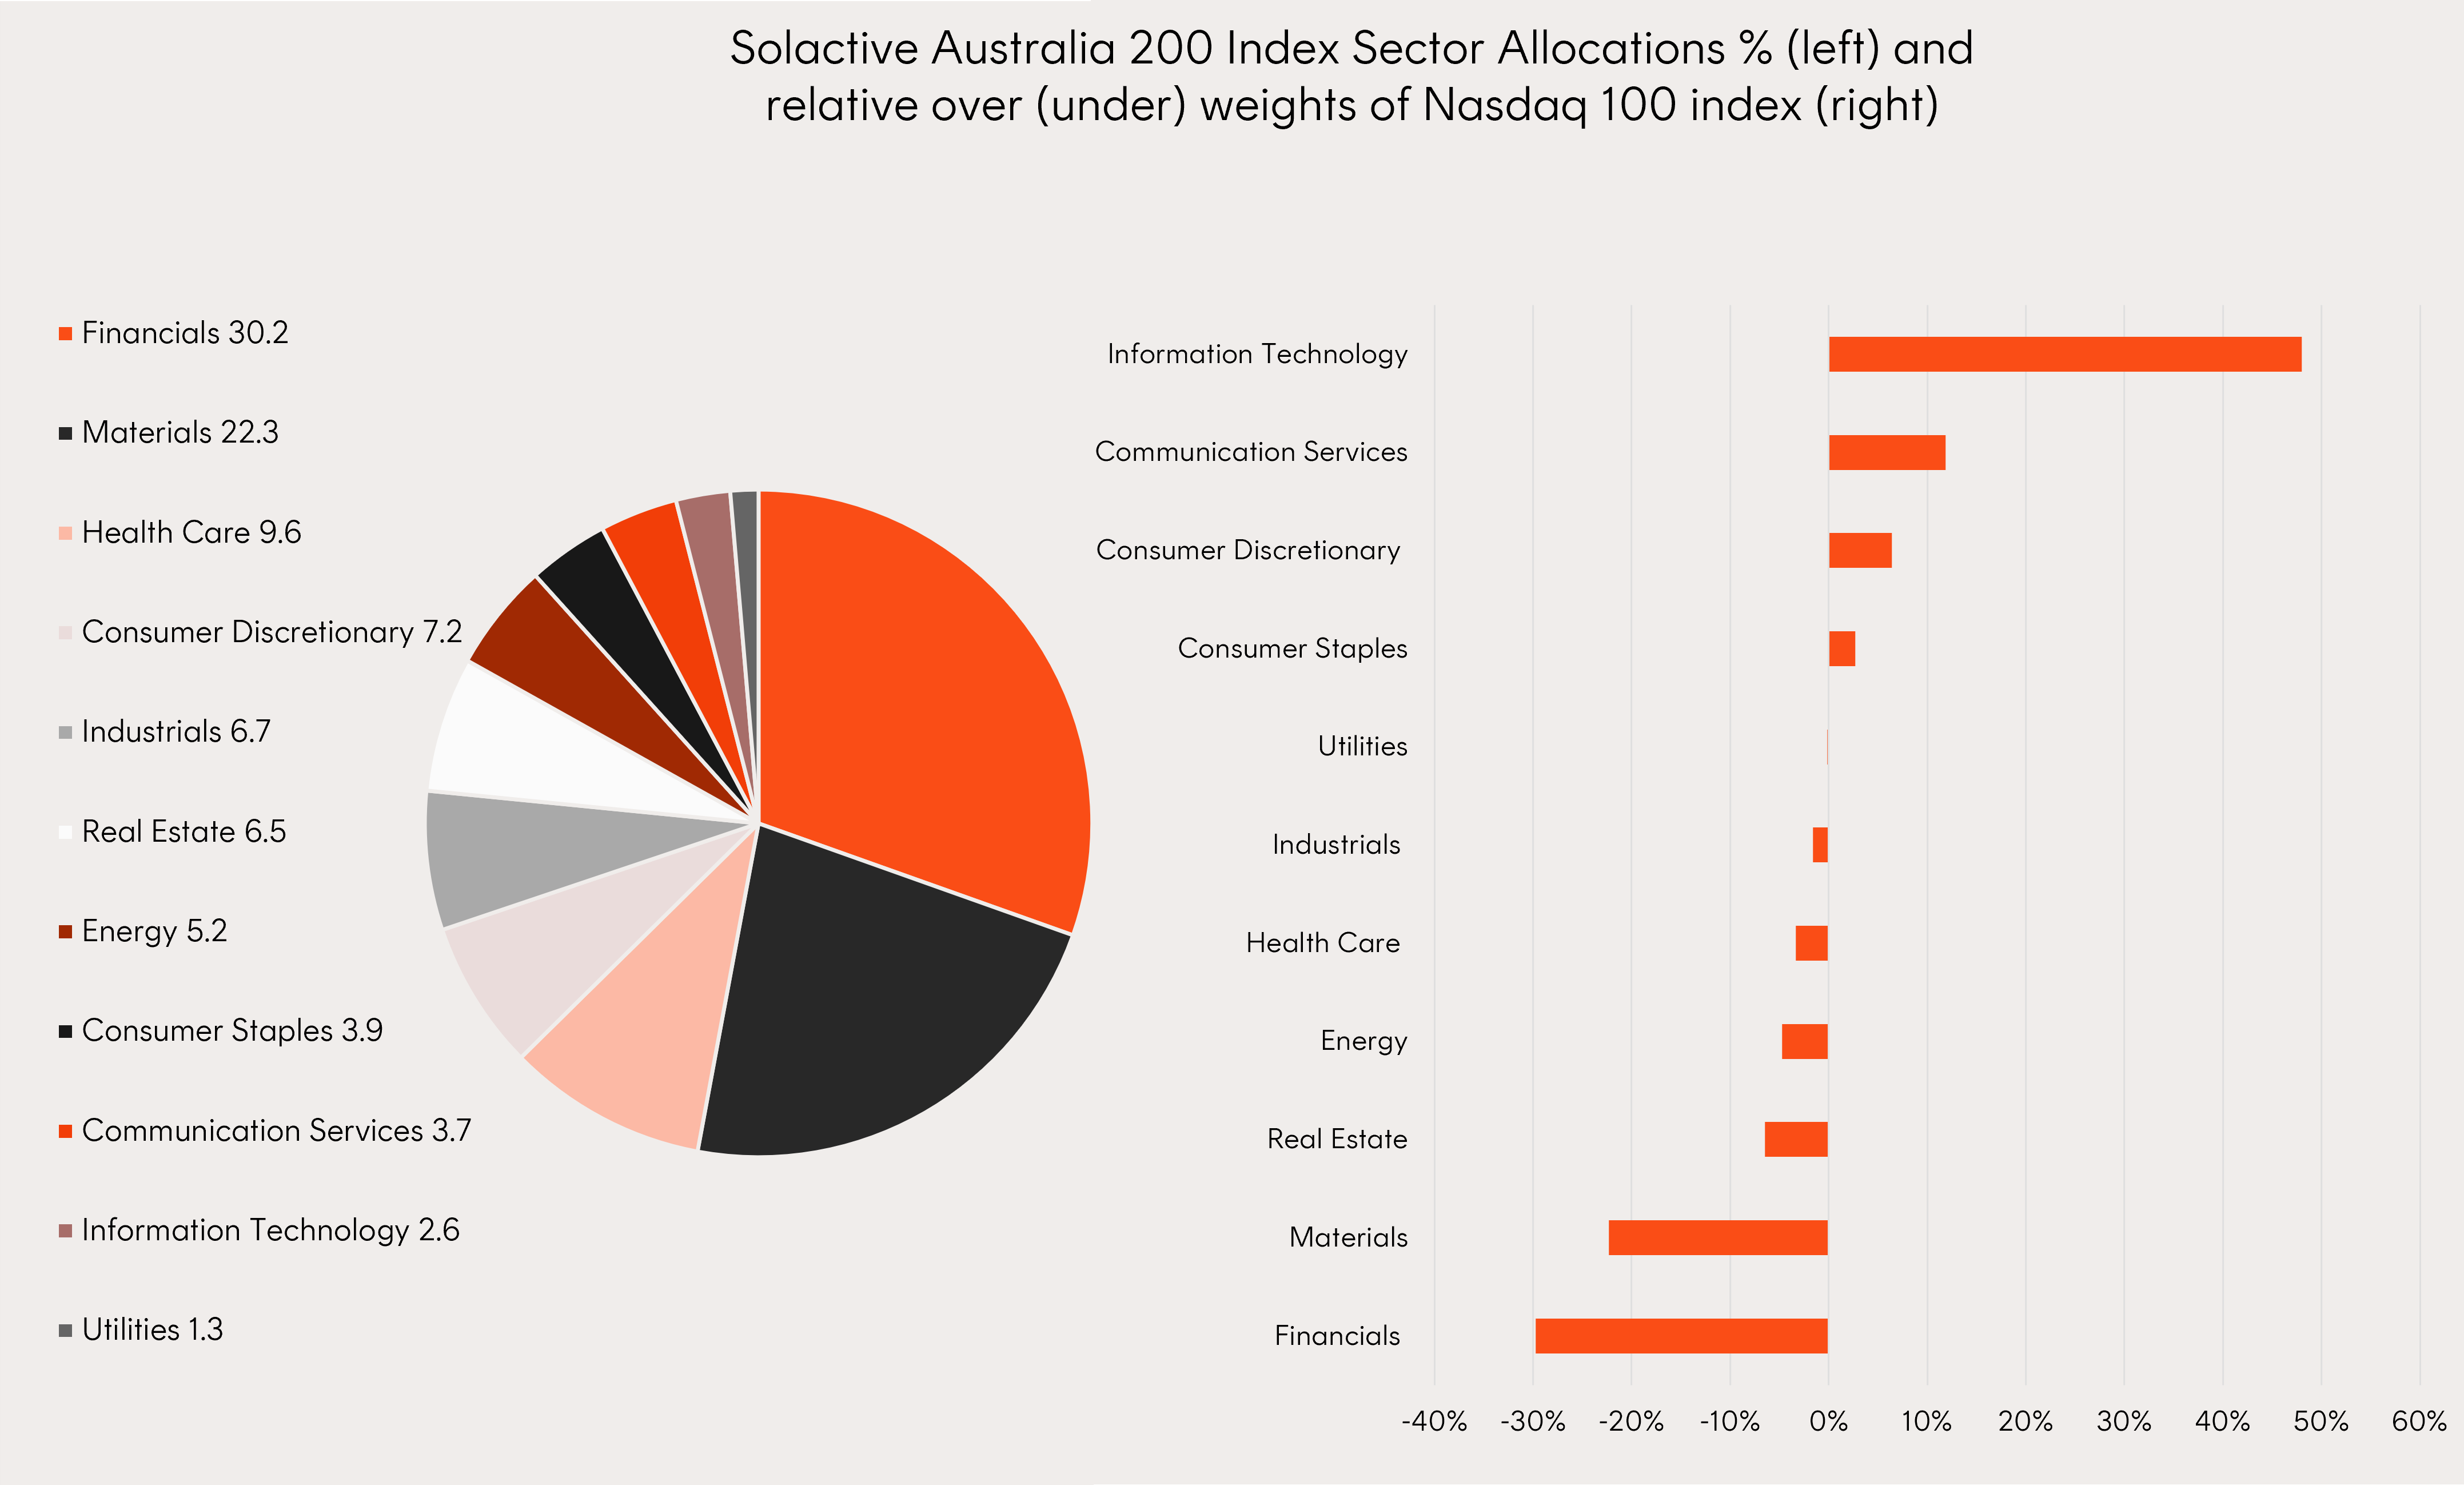
Source: Bloomberg, Betashares, as at 29 February 2024.
This sector makeup means that the Nasdaq 100 has a comparatively low level of correlation with Australian equities4. As a result exposure to the Nasdaq 100, through the Betashares Nasdaq 100 ETF, can be used for part of a global equity allocation for diversification benefits, as well as for the potential for outperformance.
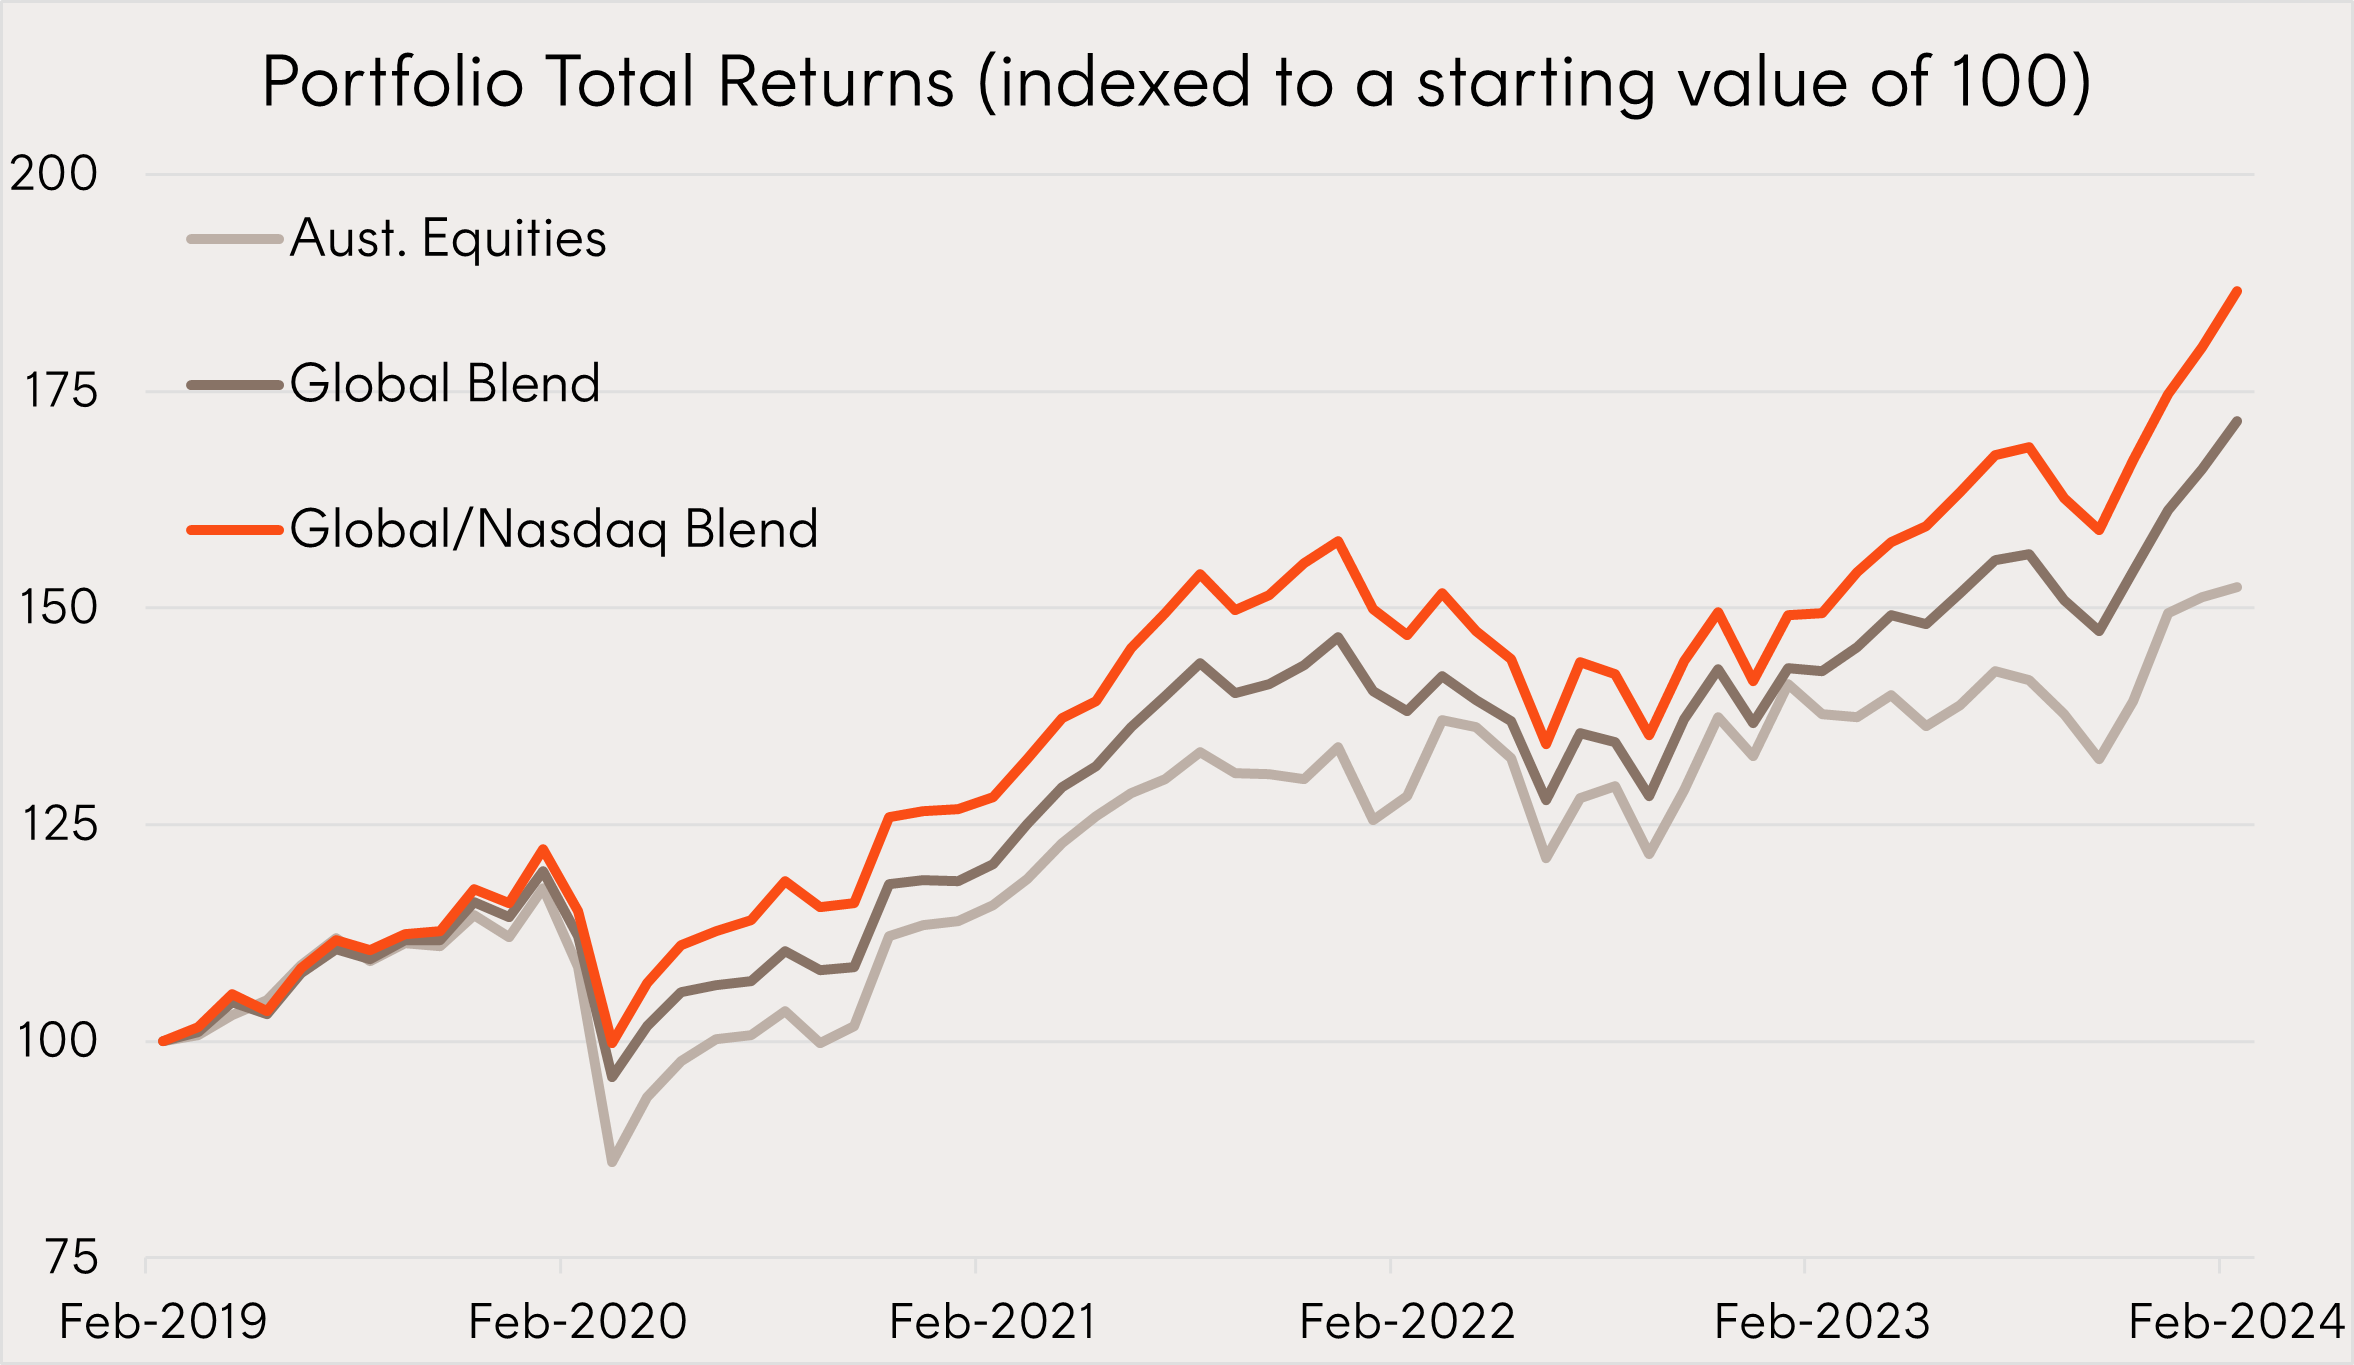
| Portfolio | Broad market Australian Equities | Broad market Global Equities | Nasdaq 100 | Total Return (p.a.) | Volatility | Sharpe Ratio |
| Aust. Equities | 100% | – | – | 8.8% | 16.4% | 0.45 |
| Global Blend | 50% | 50% | – | 11.4% | 13.1% | 0.76 |
| Global/Nasdaq Blend | 50% | 30% | 20% | 13.3% | 13.4% | 0.88 |
Source: Bloomberg. As at 29 February 2024. Calculation of volatility data is based on AUD monthly returns. Calculation of the Portfolios returns assume monthly rebalancing to allocations shown above. For the calculation of the Sharpe Ratios an average risk-free rate of 1.47% was used. The above hypothetical example is provided for illustrative purposes only. It is not a recommendation to invest or adopt any investment strategy. A200’s Index, the Solactive Australia 200 Index, is used as the proxy for “Broad market Australian Equities“, BGBL’s Index, the Solactive GBS Developed Markets ex Australia Large & Mid Cap Index, is used as the proxy for “Broad market Global Equities”, Nasdaq 100 is the Nasdaq-100 Notional Net Total Return Index (AUD). Total returns shown are index returns less ETF management fees and costs. You cannot invest directly in an index. Past performance is not indicative of future performance of any index or ETF.
The chart and table above show the benefits of simply adding diversified global equities over this time period, with the “Global Blend” providing an improvement on the “Aust. Equities” portfolio both in terms of return and volatility.
However, the diversification benefits of the “Global/Nasdaq Blend”, are also on show, with a 20% weight to NDQ’s index providing a further uplift in total return with no material change to overall volatility. Furthermore, adding the 20% allocation to Nasdaq 100 significantly increased the portfolio Sharpe ratio, further enhancing risk adjusted returns.
Portfolio Implementation
Betashares is Australia’s home of the Nasdaq, who we have a strong, long standing relationship with.
You can get access to the NDQ in a single trade on the ASX. While past performance is not a indicator of future performance, NDQ was the best performing Australian domiciled equity fund for the 5 years to 31 December 2023 – better than all other active or passive funds, whether they were ETFs or unlisted managed funds.5
NDQ
Nasdaq 100 ETF
keyboard_arrow_down
Invest in the Nasdaq 100 in a single trade
Betashares has also recently launched JNDQ and QNDQ which provide additional options for Australians seeking diversified exposure to companies listed on the Nasdaq.
JNDQ
Nasdaq Next Gen 100 ETF
keyboard_arrow_down
Invest in the rising stars of the Nasdaq
QNDQ
Nasdaq 100 Equal Weight ETF
keyboard_arrow_down
Invest in an equally weighted portfolio of the Nasdaq-100 companies
There are risks associated with an investment in NDQ, JNDQ and QNDQ, which may include for example market risk, country risk, currency risk, medium sized companies risk and sector risk. Investment value can go up and down. An investment in these funds should only be considered as a part of a broader portfolio, taking into account your particular circumstances, including your tolerance for risk. For more information on risks and other features of the funds, please see the respective Product Disclosure Statement and Target Market Determination, both available at www.betashares.com.au.
1. https://www.afr.com/technology/atlassian-prices-ipo-sets-record-us44-valuation-20151210-gljvsp
2.Source: Bloomberg. As at 15 March 2024. PE figures based on forward EPS estimates.
3.Source: Nasdaq Global Indices, Factset, as at 31 Dec 2023. A comparison of Weighted average R&D as a % of sales.
4.The correlation of monthly returns for A200’s Index, the Solactive Australia 200 Index, and the Nasdaq 100 Index (AUD) over the five years to 29 Feb 2024 was only 0.49, compared to the correlation of A200’s Index and BGBL’s index, Solactive GBS Developed Markets ex Australia Large & Mid Cap Index, was 0.71.
5.Source: Morningstar, January 2024. Based on all AUD-domiciled funds with Global Broad Category Group of “Equity”.
Explore
Markets