Betashares Australian ETF Review: Half Year 2026
Betashares Insights
7 minutes reading time
Related articles


Better investing starts here
Get Betashares Direct
Betashares Direct is the new investing platform designed to help you build wealth, your way.
Scan the code to download.
Learn more
Learn more
To put it bluntly, 2023 has been a confusing year for investors.
The major stories that have filled our headlines have mostly revolved around an impending recession, painful inflation, high interest rates, and the Nasdaq-100 closing out its best first-half performance ever with a 40% rally.
With many economists still predicting a US recession, investors are justified in asking: “Why has US tech been soaring?”
Technology traditionally has been seen as a high-risk high-reward sector, suitable for investors with a long time horizon and ability to withstand at least a few years of losses on the way. Anyone who was investing before the turn of the century will be acutely aware of the 15 years it took for the Nasdaq-100 to recover from the dot-com crash. That’s not the kind of exposure investors would intuitively rush to buy in the face of an imminent recession. However, the companies in the technology sector have changed a lot in the last 20 years, and a closer look at US tech leaders reveals some important characteristics that may explain its current popularity.
What has been driving tech’s performance?
The Nasdaq-100’s current rally has been driven almost entirely by the largest 7 stocks: Apple, Microsoft, Alphabet, Amazon, Nvidia, Tesla and Meta. While their average total weight of 50% in the index is high, they have contributed a whopping 75% of returns in the first half of 2023.
A major factor is the natural advantage the large tech companies have in the skillset, computing power and financial resources required to develop and monetise increasingly sophisticated AI models. But another perhaps underappreciated reason is that these companies are some of the largest, most established businesses in the world. They tend to have strong fundamentals, hold significant cash reserves and historically have generated relatively steady revenues over the business cycle – the type of company you may want to hold going into a recession (remembering of course that past performance isn’t indicative of future performance).
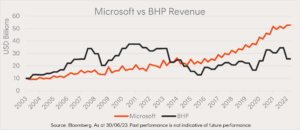
For example, over the last 20 years, Microsoft generally has exhibited steady revenue growth – even through the GFC, the downturn in 2015/16 and Covid. Meanwhile, BHP’s revenue has swung up and down more significantly with the business cycle. These companies offer products and services that nearly all of us use every day, and their ubiquity could give them strength, which is currently reflected in their fundamentals.
Tech company fundamentals
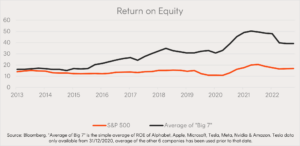
Over the last ten years, the seven tech giants have displayed an attractive growth in return on equity (ROE), leaving behind the rest of the S&P 500. As well as driving technological innovation, the firms’ digital nature and relatively low capital requirements have allowed them to develop scalable business models across multiple market sectors.
A perfect example of this trend is Amazon Web Services (AWS), Amazon’s cloud computing platform. While many people would still think of Amazon as an online shopping company, AWS is now its most successful business unit. The segment generated almost US$23 billion in profit on US$80 billion of revenue in 2022, bringing Amazon’s operating income to US$12.25 billion for the year, from what would have been a US$10.59 billion loss without AWS1.
What about Aussie tech?
The US tech giants aren’t the only investable tech companies. While the US traditionally has been the go-to place for tech investors, there’s been increasing interest in our domestic sector.
Australian technology offers appealing qualities as a diversifier for investors with an existing US tech exposure. The most obvious of these is size. While the US tech giants dwarf Australian tech names on an absolute basis, they are also much larger compared to the rest of their market. The weighted average market cap of the Information Technology (IT) sector within the S&P 500 is 2.8x that of the S&P 500, while in Australia the trend is reversed, with the ASX 200 having a weighted average market cap 5x higher than its technology component. The Australian tech industry is still in its nascency, with a long growth runway ahead of it. We have a highly educated and tech-savvy population and are seen as a desirable destination within the Asia Pacific for skilled migrants to work and study.
The ASX All Technology Index has enjoyed a 21% gain for the six months to 30 June this year. While well below the 45% gain in the S&P 500 tech sector, this was significantly higher than any other S&P/ASX 200 sector. Over the five-year period to 30 June 2023, the ASX All Technology Index has returned 10.44% p.a. The Australian tech sector is far more B2B software-focused and has likely missed out on some of the excitement around AI and semi-conductors that has driven gains in the US. As well, the smaller size of Australian tech companies means Australian investors may be less likely to turn to them in the face of a recession.
Ultimately, the recent gains in the US technology sector suggest that some investors may view some of the larger, more established companies in that sector as having potential ‘defensive’ characteristics. Their established market presence, potentially more economically-resilient revenue streams and access to resources to invest in new business lines could make them an attractive option for investors expecting challenging times ahead.
On the other hand, Australian technology offers a compelling long term growth prospect. Supportive demographics and room for growth presents opportunities for investors looking to capitalise on a developing tech market.
How can Australian investors gain technology exposure?
Index-tracking ETFs are an increasingly popular way for Australian investors to gain exposure to domestic and international equities. They offer intra-day liquidity, being able to be bought and sold on the ASX like a share. Their holdings are generally published daily, allowing investors to know exactly what they are investing in. They offer diversified exposure to the sector, as opposed to the high risk approach of trying to pick the ‘next Nvidia’. Finally, thanks to their passive, rules-based methodology, ETFs generally enjoy lower management fees than their active peers.
Investors can gain convenient, cost-effective exposure to the Australian technology sector via the ATEC S&P/ASX Australian Technology ETF , which aims to track the S&P/ASX All Technology Index (before fees and expenses). For those looking for a US exposure, Betashares offers the NDQ Nasdaq 100 ETF , which aims to track the NASDAQ-100 Index (before fees and expenses), and the HNDQ Nasdaq 100 Currency Hedged ETF , a currency hedged version of NDQ.
HNDQ
Nasdaq 100 Currency Hedged ETF
keyboard_arrow_down
Currency hedged exposure to the Nasdaq 100 in a single trade
ATEC
S&P/ASX Australian Technology ETF
keyboard_arrow_down
Gain exposure to Australia's dynamic technology sector
NDQ
Nasdaq 100 ETF
keyboard_arrow_down
Invest in the Nasdaq 100 in a single trade
There are risks associated with investing in ATEC, NDQ and HNDQ, including market risk, technology sector risk and concentration risk, as well as currency risk and country risk for NDQ and currency hedging risk for HNDQ. Investment value can go up and down. An investment in ATEC, NDQ or HNDQ should only be considered as a part of a broader portfolio, taking into account your particular circumstances, including your tolerance for risk. For more information on risks and other features of each fund, please see the applicable Product Disclosure Statement and Target Market Determination, both available at www.betashares.com.au.
The S&P/ASX All Technology Index (Index) is a product of S&P Dow Jones Indices LLC or its affiliates (SPDJI) and ASX Operations Pty Ltd (ASX) and has been licensed for use by Betashares. S&P® is a registered trademark of Standard & Poor’s Financial Services LLC (S&P); ASX® is a registered trademark of ASX and these trademarks have been licensed for use by SPDJI and sublicensed for certain purposes by Betashares. ATEC is not sponsored, endorsed, sold or promoted by SPDJI, S&P, their respective affiliates, or ASX, and none of such parties make any representation regarding the advisability of investing in ATEC nor do they have any liability for any errors, omissions or interruptions of the Index.
Nasdaq®, Nasdaq-100®, Nasdaq-100 Index® and Nasdaq-100 Currency Hedged AUD Index® are registered trademarks of Nasdaq Inc. (which with its affiliates is referred to as the “Corporations”) and are licensed for use by Betashares. Neither NDQ nor HNDQ have been passed on by the Corporations as to its legality or suitability. NDQ and HNDQ are not issued, endorsed, sold, or promoted by the Corporations. The Corporations make no warranties and bear no liability with respect to NDQ or HNDQ.
References:
1. Amazon Financial Reports
Explore
Markets
2 comments on this
What has been the main driver of the technology sector’s performance over the last few decades, especially in the face of a potential recession?
Greeting : Telkom University
Hi, thank you for your question and interest!
Pinning an entire sector’s performance on one key factor can be an ambiguous matter. As highlighted in the article, investors may not be as fearful of a recession due to the reliability and safety of these tech giants. This level of reliability could have been attributed to a variety of factors.
1. Interest Rates: Whilst polarizing, are not necessarily a negative for the current gargantuan tech companies such as the MAG7. Periods of low interest rates (post GFC and post Covid) have definitely been a (if not the) major driver of tech performance over the period, fuelling rapid innovation and leveraged growth.
2. Trade Tariffs: Other than in 2018/2019 and potentially now in 2025, scaling global supply chains through increased globalisation may also have been an enabler to tech growth,.
Institutional and Consumer Demand: Catalysed the supply of innovations as far back as the first smartphone and 5G internet to generative AI, advanced software, e-commerce, big data management, and cloud computing.
Regards,
Betashares customer Support Team.