
Tom Wickenden
7 minutes reading time
This information is for wholesale client use only.
When it comes to global equities over the last decade, the S&P 500 Index has outperformed other major country indices by some margin. But this stellar run is in fact attributable to only a handful of now very dominant companies. As a result, the market capitalisation-weighted S&P 500 is now more concentrated than it has been at any time in the last 50 years.
Under these circumstances, investors may want to re-consider the effectiveness of broad market capitalisation-weighted indexes in the US and how equal-weighted strategies may provide better long-term outcomes.
Top heavy US equity markets poses a risk to investors
While investors have enjoyed a resurgent US equity market so far in 2023, there is good reason to be cautious. The 14.3% rally in the S&P 5001 has been incredibly narrow, with 80% of the index’s gains attributable to just seven of the largest index constituents.
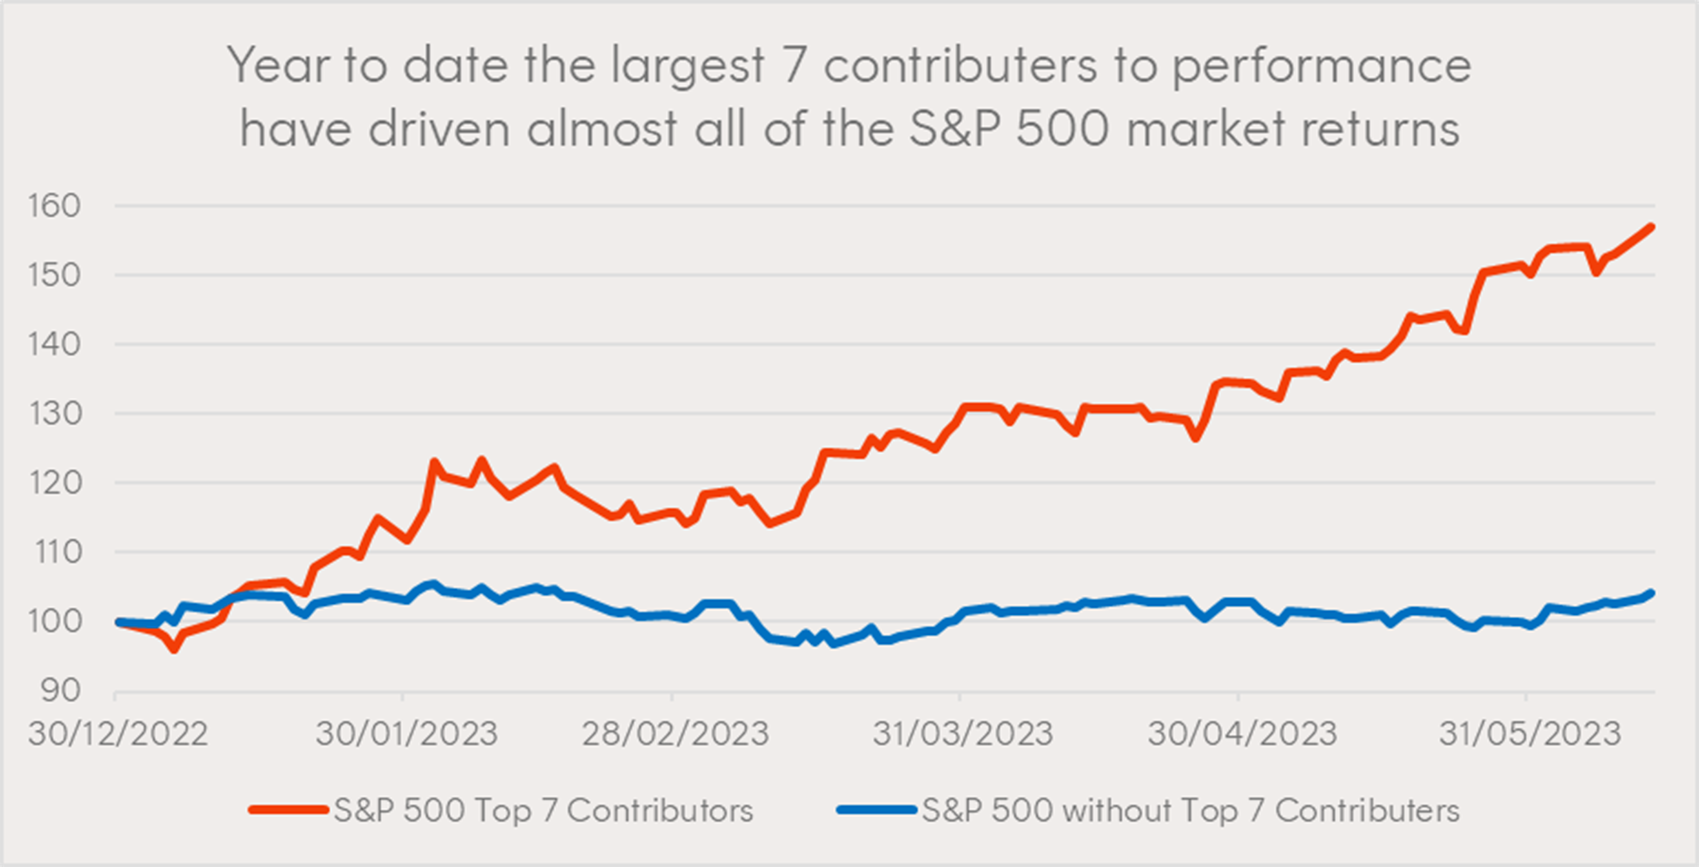
Source: Bloomberg. Year to 13 June 2023 . S&P 500 Top 7 Contributors calculated using market capitalisation index returns of these stocks. The top 7 contributors were Apple, Microsoft, Nvidia, Google (A and C class combined), Amazon, Meta, and Tesla. Past performance is not an indicator of future performance. You cannot invest directly in an index.
This mega-cap leadership means the 5 largest companies (combining Google’s A and C class shares) now comprise 24% of the index’s weight (as at 13 June 2023 ), up from 11% a decade earlier, and surpassing levels of concentration last seen during the dot-com bubble.2
For investors, these levels of concentration can pose a threat for a few reasons.
Firstly, given the five largest companies account for about one quarter of the index weight, they have a significant sway over market returns. This may not have been a concern if the companies were unrelated, however all five are considered ‘tech’ stocks and exhibit high positive correlations,3 worsening both the stock and sector diversification benefits typically associated with index investing.
Secondly, recent positive performance has been driven primarily by expanding valuation multiples rather than earnings growth. The top five names now have an average forward P/E ratio of 33x. Given their increased representation in the S&P 500, the index’s forward P/E has been stretched to 19x.4 With the macro-economic environment less supportive of such valuation multiples than it was two years ago, current stock prices may become harder to justify without strong earnings growth.
And what of the path forward? We may see the concentration become even more acute until the top-heavy leadership can no longer support the whole market, which could cause a correction. It is also possible that participation in the rally may become more broad-based in the event of a new bull market driven by healthier fundamentals. In either scenario, the largest companies may be expected to underperform the rest of the market. This has been the case historically when equity market concentration has subsided.
The S&P 500 Equal Weight Index (S&P 500 EW) is a broad-based US equity index which does not suffer from the mega-cap concentration dilemma. The relative outperformance of the S&P 500 EW versus the market capitalisation-weighted S&P 500 has generally been strongest in periods when concentration was high and subsiding, as can be seen in the chart below. While the equally weighted index has gone through periods of underperformance – including the last 10 years when US large cap concentration was increasing – over the longer term the S&P 500 EW has outperformed the S&P 500 by more than 1% p.a. since January 1990.5
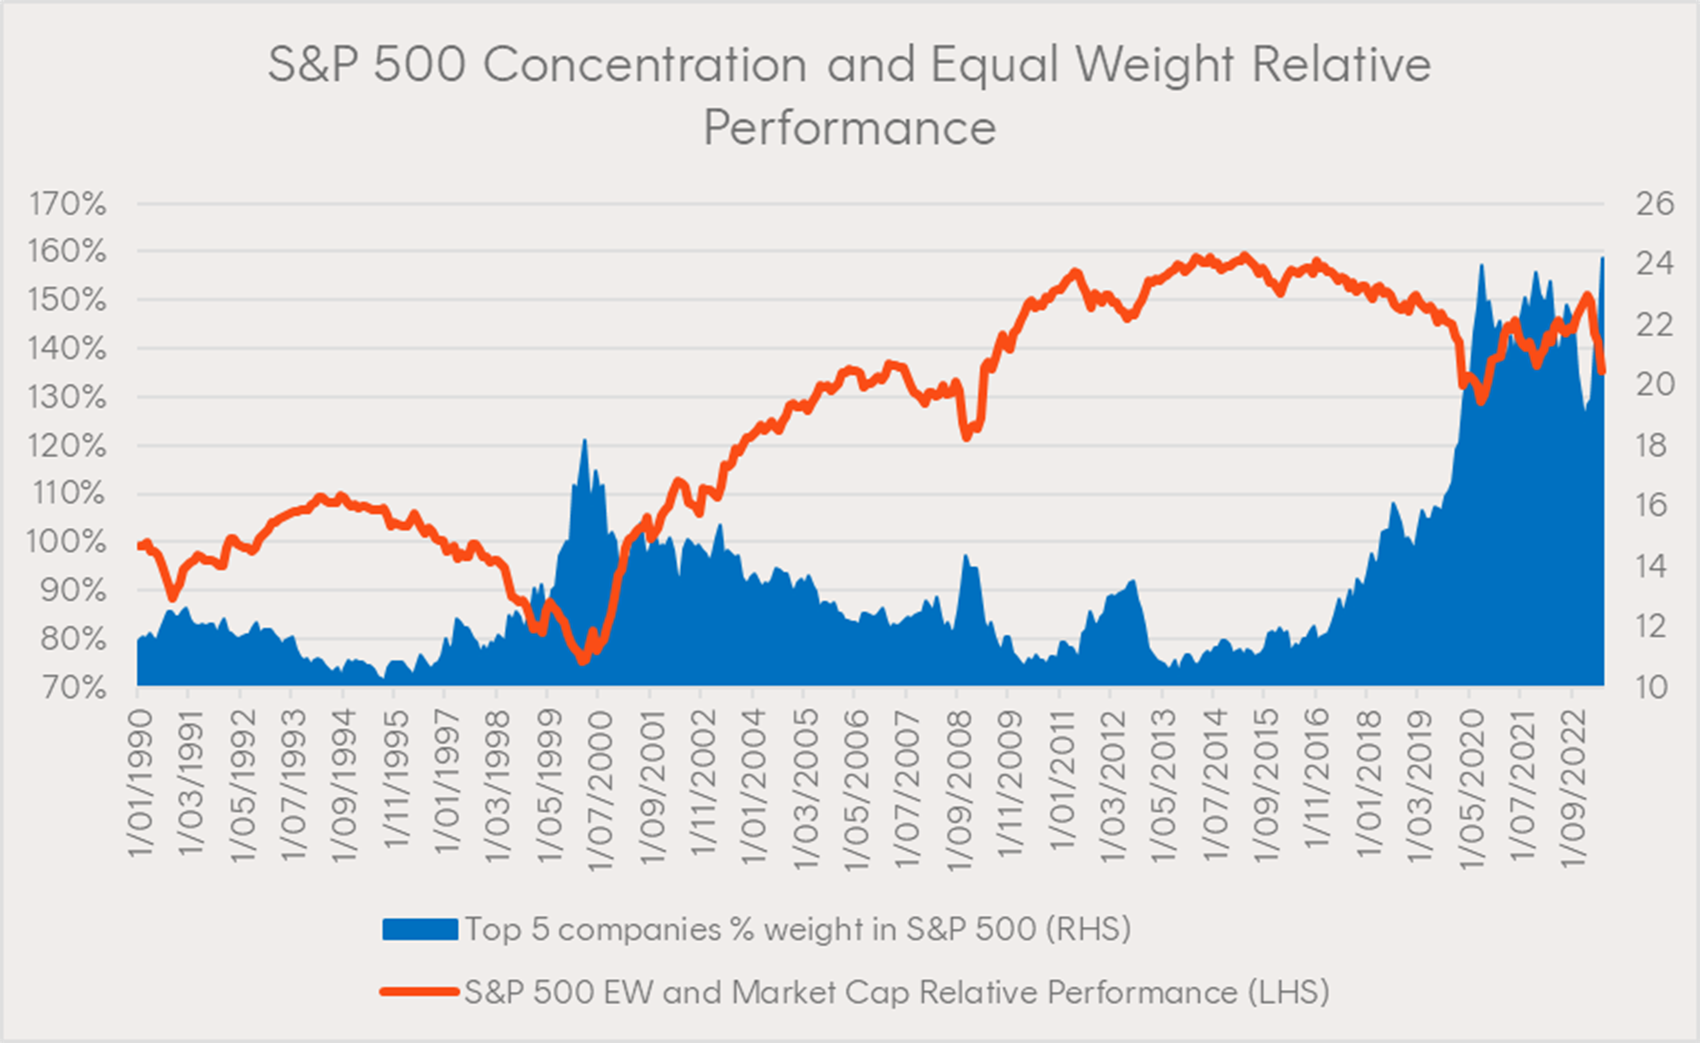
Source: Bloomberg. From 1 January 1990 to 31 May 2023. Past performance is not an indicator of future performance of any index or ETF. Does not take into account any ETF fees and costs. You cannot invest directly in an index.
Equal weighting – Better diversification in the US economy?
The S&P 500 EW comprises the same 500 largest US-listed companies as the S&P 500, however, each constituent is rebalanced to a portfolio weight of 0.2% on a quarterly basis. While the top five names in the S&P 500 currently account for ~25% of that index’s weight, these same five companies only represent ~1% in the S&P 500 EW. This allows for the remaining 495 companies to have a much greater impact on the performance, providing diversification benefits to investors. Due to the similarities of S&P 500’s largest holdings, the equal weight index also provides investors with more balanced exposure to the US economy on a sector level.
The S&P 500 Equal Weight Index represents more diversified sector exposure in the US
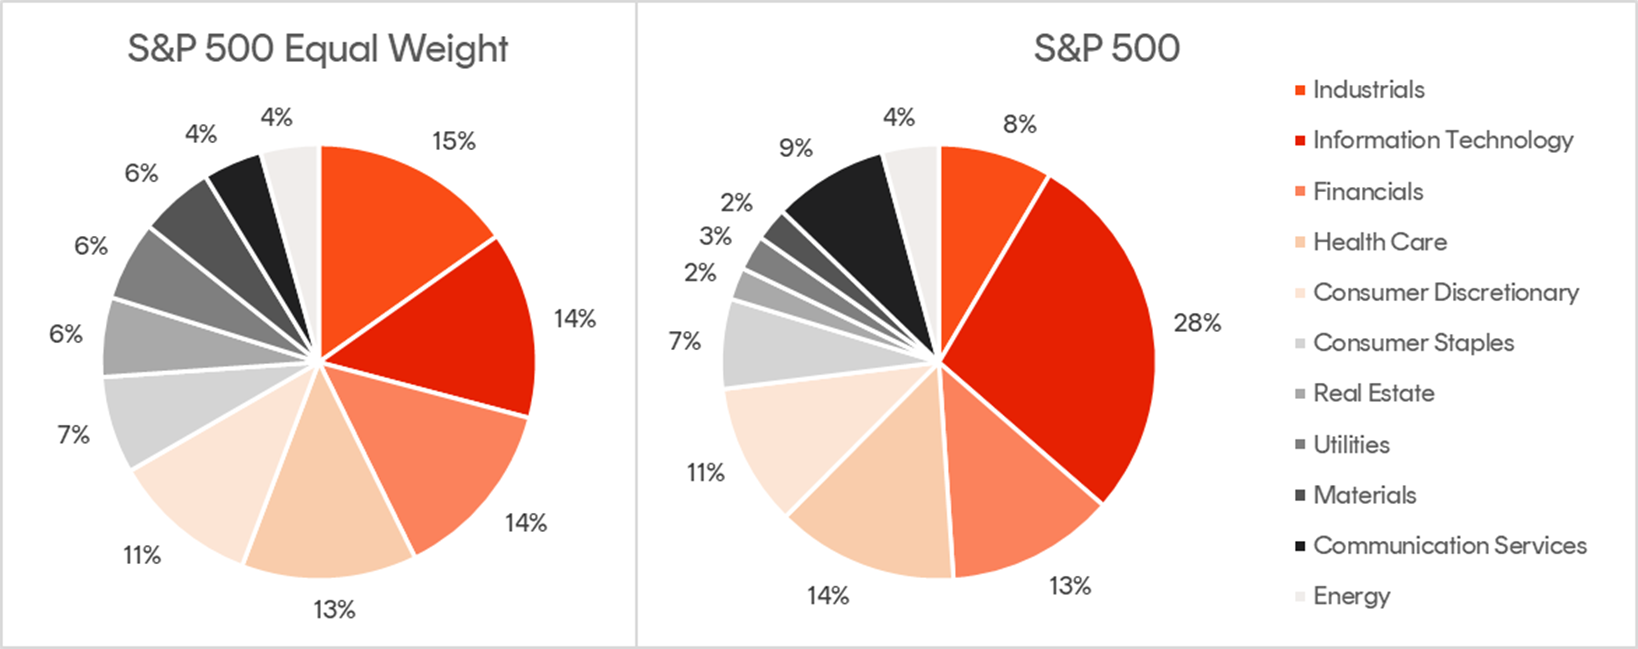
Source: Bloomberg. As at 13 June 2023. You cannot invest directly in an Index.
An additional benefit is the relatively less demanding valuations of S&P 500 EW, with a forward P/E of only 15.77x.6
The S&P 500 EW may be appropriate for investors seeking a more diversified core exposure to the US economy, or could be considered alongside existing holdings in market capitalisation-based US indices to reduce concentration risk.
Betashares S&P 500 Equal Weight ETF (QUS)
Betashares offers investors the only US equity market equal-weighted ETF available on the ASX (ASX code: QUS), which aims to track the S&P 500 Equal Weight Index before fees and expenses.
QUS may be appropriate for advisers seeking a more diversified exposure to the US economy:
• As the anchor for a client’s US equity allocation; or
• To be held alongside existing market capitalisation-based US equity allocations to seek to reduce overall inherent concentration risk.
As reported by the AFR, a US-listed ETF tracking this the same equal weight index saw record weekly inflows for the week ending 9 June 2023 of over US$1 billion,7 showing investors may be becoming increasingly wary of the market capitalisation-based S&P 500’s concentration.
QUS is rated ‘Recommended’ by Lonsec. You can request the research reports from your BDM or by filling in the form under the following link.
For more information on Betashares ETFs’ platform availability please use the following link.
Additional Information
• Product Summary to assist with SOAs
• Target Market Determination
• Product Disclosure Statement
There are risks associated with an investment in the QUS, including market risk, country risk, industry specific risk and currency risk. Investment value can go up and down. For more information on risks and other features of these funds, please see the Product Disclosure Statement and Target Market Determination, both available at www.betashares.com.au.
The Lonsec rating (assigned 13 October 2022) presented in this document and the research report is published by Lonsec Research Pty Ltd ABN 11 151 658 561 AFSL 421 445 (Lonsec). Ratings are general advice only, and have been prepared without taking account of your objectives, financial situation or needs. Consider your personal circumstances, read the product disclosure statement and seek independent financial advice before investing. The rating is not a recommendation to purchase, sell or hold any product. Past performance information is not indicative of future performance. Ratings are subject to change without notice and Lonsec assumes no obligation to update. Lonsec uses objective criteria and receives a fee from Betashares. Visit lonsec.com.au for ratings information. © 2023 Lonsec. All rights reserved.
Betashares Capital Limited (ABN 78 139 566 868, AFSL 341181) (“Betashares”) is the issuer of the Betashares Funds. This information is general only, is not personal financial advice, and is not a recommendation to buy units or adopt any particular strategy. It does not take into account any person’s financial objectives, situation or needs. Investments in Betashares Funds are subject to investment risk and the value of units may go down as well as up. Any person wishing to invest should obtain a copy of the relevant PDS from www.betashares.com.au and obtain financial advice in light of their individual circumstances. You may also wish to consider the relevant Target Market Determination (TMD) which sets out the class of consumers that comprise the target market for each Betashares Fund and is available at www.betashares.com.au/target-market-determinations.
1. Year to date, as at 13 June 2023
2. Source: Bloomberg.
3. FS Investments – Concentration issues: A look at the top-heavy US equity market. https://fsinvestments.com/fs-insights/concentration-issues-us-equity-market/
4. Bloomberg, as at 13 June 2023.
5. From 1 January 1990 to 31 May 2023. Past performance is not indicative of future performance of any index or ETF.
6. Bloomberg, as at 13 June 2023.
7. https://www.afr.com/markets/equity-markets/stumbling-megacaps-see-investors-pour-1-5bn-into-invesco-etf-20230609-p5dfdw