
July 2023 Review: Industry’s positive trajectory continues with a new all-time record
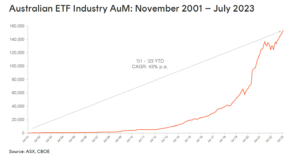
Robust investor flows, combined with market appreciation, pushed the Australian ETF industry to a new all-time high in assets under management as at the end of July, marking a strong start to the second half of the year.
Exchanged Traded Funds Market Cap
• Australian Exchange Traded Funds Market Cap (ASX + CBOE): $153.5B – new all time high
• ASX CHESS Market Cap: $138.3B1
• Market Cap increase for month: 2.4%, $3.5B
• Market Cap growth for last 12 months: 17.9%, $23.3B
New Money
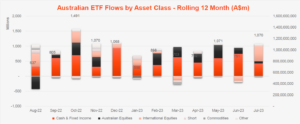
• Net inflows for month: $1.1B – the 2nd highest level of inflows recorded this calendar year
Products
• 340 Exchange Traded Products trading on the ASX & CBOE
• One new ETF launched – a futures-based broad commodities exposure from Global X
Comment: This month, we also saw a rare new entrant into the Top 10 largest ETFs, with our A200 Australia 200 ETF , Australia’s lowest management cost domestic shares ETF, entering this list for the first time as it exceeded $3B in assets under management.
Trading Value
• ASX ETF trading value remained stable for the month, with ASX trading value being >$10.3B for the month.
Performance
•
CRYP
Crypto Innovators ETF
was the number one performing fund this month returning ~22% for the month as investors continued their enthusiasm for crypto and bitcoin related exposures. We also saw strong performance in crude oil via our
OOO
Crude Oil Index ETF – Currency Hedged (Synthetic)
which returned ~16% for the month. (Note: past performance is not indicative of future performance.)
Source: ASX, CBOE
Top 5 category inflows (by $) – July 2023
| Broad Category | Inflow Value |
| Fixed Income | $557,468,937 |
| International Equities | $496,955,105 |
| Australian Equities | $74,698,629 |
| Listed Property | $34,694,796 |
| Multi-Asset | $29,403,796 |
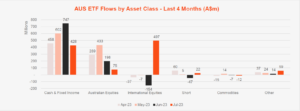
Comment: Very much in line with the year to date, we once again saw Australian fixed income exposures lead the way in terms of flows, with the category recording the highest level of net flows this month ($557m). However, for the first time in the calendar year, we saw strong net flows into international equities exposures, recording their first meaningful monthly inflow as a category since the beginning of the year ($497m), as investors sought out global growth exposures.
Top category outflows (by $) – July 2023
| Sub-Category | Inflow Value |
| Cash | ($129,114,461) |
| Commodities | ($11,882,069) |
| Currency | ($4,836,554) |
Commentary: Outflows were limited to some selling in cash ETFs, together with what appeared to be profit-taking related selling in Oil.
 Source: ASX, CBOE
Top sub-category inflows (by $) – July 2023
| Sub-category | Inflow Value |
| Australian Bonds | $417,061,453 |
| International Equities – US | $191,540,899 |
| International Equities – Developed World | $166,208,232 |
| Global Bonds | $127,158,837 |
| International Equities – Sector | $70,803,498 |
Top sub-category outflows (by $) – July 2023
| Sub-Category | Inflow Value |
| Cash | ($129,114,461) |
| Australian Equities – Geared | ($23,028,037) |
| Oil | ($17,697,717) |
| International Equities – Europe | ($17,229,983) |
| Australian Equities – Large Cap | ($14,884,188) |
*Past performance is not an indicator of future performance.
1. Since February 2023, the ASX started reporting additional data on a CHESS-only basis. The primary use of such data is that it excludes, amongst other things, the FuM and Flows in ‘dual class’ Active ETFs and potentially provide a more accurate picture of exchange traded activity.
-
A200
Australia 200 ETF
Investor & founder with a Financial Services & Fintech focus. Co-founder of Betashares. Passionate about entrepreneurship and startups.
Read more from Ilan.