Betashares Australian ETF Review: July 2023

Ilan Israelstam
3 minutes reading time
Related articles
Better investing starts here
Get Betashares Direct
Betashares Direct is the new investing platform designed to help you build wealth, your way.
Scan the code to download.
Learn more
Learn more
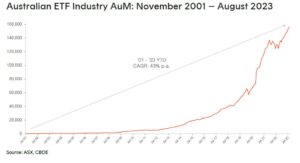
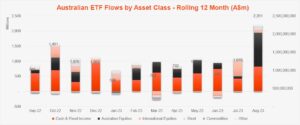
August 2023 Review: Strongest inflows for 12 months drive industry to record high
The strongest monthly inflows of the last 12 months drove the Australian ETF industry to a new all-time high in assets under management as at the end of August
Exchanged Traded Funds Market Cap
• Australian Exchange Traded Funds Market Cap (ASX + CBOE): $156.1B – new all time high
• ASX CHESS Market Cap: $140.8B1
• Market Cap increase for month: 1.6%, $2.5B
• Market Cap growth for last 12 months: 20.1%, $26.1B
New Money
• Net inflows for month: $2.2B – highest inflows for 2023 to date, and within the last 12 months
Products
• 342 Exchange Traded Products trading on the ASX & CBOE
• Three new ETFs launched: 2 Active ETFs from JP Morgan (Fixed Income and Emerging Markets), 1 new Active ETF from IML (Australian Shares) and a new US equities product from Global X
• 1 XTB single bond exposure was closed
Trading Value
• ASX ETF trading value grew 8% month on month, with ASX trading value rising above $11.B for the first time in 15 months with the 5th highest monthly value traded on record
Performance
• URNM Global Uranium ETF was the best performing product this month, rising ~15% as a result of a significant volume of long-term uranium purchase contracts being signed combined with concerns over disruptions to supply
Source: ASX, CBOE
Top 5 category inflows (by $) – August 2023
| Broad Category | Inflow Value |
| Australian Equities | $1,118,843,997 |
| Fixed Income | $612,531,802 |
| Cash | $212,099,899 |
| Short | $110,801,488 |
| International Equities | $74,042,451 |
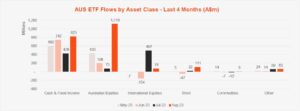
Comment: In a departure from previous months, this month we saw the top category for inflows being broad Australian equities ETFs which, at $1.1B, represented a 50% of the total months inflows. Australian Fixed Income exposures also continued to be popular with investors ($612m), and even at position 2 for this month, received higher flows than the month before.
Source: ASX, CBOE
Top sub-category inflows (by $) – August 2023
| Sub-category | Inflow Value |
| Australian Equities – Broad | $1,007,290,322 |
| Australian Bonds | $420,779,978 |
| International Equities – Developed World | $246,616,915 |
| Cash | $212,099,899 |
| Global Bonds | $183,307,908 |
Top sub-category outflows (by $) – August 2023
| Sub-Category | Inflow Value |
| International Equities – Europe | ($180,250,890) |
| International Equities – Sector | ($96,136,177) |
| International Equities – Asia | ($43,957,545) |
| International Equities – Emerging Markets | ($28,718,059) |
| US Equities – Short | ($24,570,040) |
Comment: There were very little outflows at a category or sub-category level this month, with ETF investors largely choosing to hold or add to their positions, in aggregate.
*Past performance is not an indicator of future performance.
1. Since February 2023, the ASX started reporting additional data on a CHESS-only basis. The primary use of such data is that it excludes, amongst other things, the FuM and Flows in ‘dual class’ Active ETFs and potentially provide a more accurate picture of exchange traded activity.
URNM
Global Uranium ETF
keyboard_arrow_down
Access leading companies in the global uranium industry
Explore
ETF industry
1 comment on this
Looking for your “best” Aust minerals ETF.
Pls help.
Graeme
Currently holding several Beta, eg ACDC, past dip Fin Planner, aged 87yrs.