Betashares Australian ETF Review: May 2026

Ilan Israelstam
5 minutes reading time
Related articles

Better investing starts here
Get Betashares Direct
Betashares Direct is the new investing platform designed to help you build wealth, your way.
Scan the code to download.
Learn more
Learn more
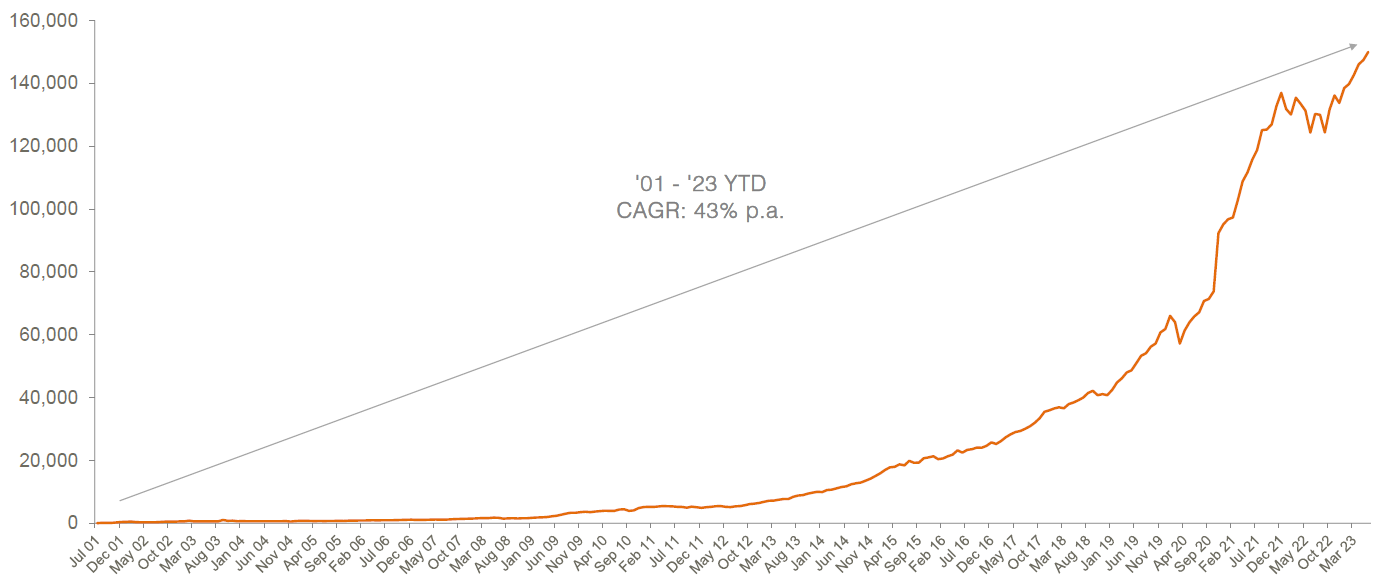
Australian ETF Industry breaks $150 billion barrier
The Australian ETF industry ended the financial year on a high, reaching the $150 billion mark in total assets under management after recording robust growth for the half year, a particularly strong result considering the tough conditions being faced in the asset management industry more broadly.
We would very much categorise the Australian ETF industry as an ‘absolute/relative’ story at the moment: On an absolute basis the industry is growing more slowly than the 2 years preceding this one, with investors being far more guarded about investment allocations. On a relative basis, however, the Australian ETF industry has never been in a stronger position, particularly when compared to the unlisted active funds which have been plagued by outflows in recent times.
Market size and growth: Half year 2023
Source: ASX, CBOE
Exchanged Traded Funds Market cap
- Australian Exchange Traded Funds Market Cap (ASX + CBOE): $150.0B – new all time high
- Market cap increase for Half Year: 12.2%, $16.3B
Comment: The Australian ETF industry increased in size by 12.2% for the Half Year, recording total growth of $16.3B for the Half Year, to end the financial year at $150.0B, a new all-time industry record. The majority of the growth (70%) was caused by market appreciation, although industry inflows remained strongly positive.
New money
- Net inflows for the Half Year: +$4.8B
Comment: Given investor caution, ETF industry flows were relatively strong, with net inflows for the half year reaching $4.8B. This was 20% less when compared to the $6.2B of net flows received in the first half of 2022. However, it compares well against unlisted funds: Morningstar data shows that Australian unlisted funds have seen outflows of $23.4B between January and May this year, demonstrating a clear investor preference for exchange traded funds that is consistent with historical trends in Australia and overseas.
Issuer Flows
- Betashares was the #1 issuer for net flows in the first half with ~$1.8B in net inflows. Flow concentration by issuer remains elevated, with the top 3 issuers (Betashares, Vanguard & iShares) receiving 92% of the industry flows for the Half.
Products
- 339 Exchange Traded Products trading on the ASX & CBOE
- New products/closed products: 22 new products launched in the half year (compared to 23 in the first half of 2022), 1 product matured, 1 product closed (Switzer’s Higher Yield Active ETF).
Trading value
- Trading value for this half was 13% lower than the first half of 2022
Performance
After a slow start, the end of the half in particular saw growth exposures perform very strongly causing such products to dominate the performance table for the first 6 months of the year. Given the resurgence of interest in crypto, it was Betashares Crypto Innovators ETF (ASX: CRYP) that took the number one slot for half year performance, with a total return of ~121%. This was followed by other crypto and technology exposures.
Top 5 category inflows (by $) – YTD June 2023
| Broad Category | Inflow Value |
| Fixed Income | $2,504,843,599 |
| Australian Equities | $1,596,489,771 |
| Cash | $687,791,492 |
| Short | $128,487,759 |
| Listed Property | $55,176,829 |
Top category outflows (by $) – YTD June 2023
| Broad Category | Inflow Value |
| Commodities | ($97,673,607) |
| International Equities | ($94,400,225) |
| Currency | ($19,785,901) |
Top sub-category inflows (by $) – YTD June 2023
| Sub-category | Inflow Value |
| Australian Bonds | $1,704,454,185 |
| Australian Equities – Broad | $1,111,612,961 |
| Cash | $687,791,492 |
| Global Bonds | $657,585,391 |
| Australian Equities – High Yield | $373,081,942 |
Top sub-category outflows (by $) – YTD June 2023
| Sub-category | Inflow Value |
| International Equities – Developed World | ($447,030,052) |
| International Equities – Europe | ($211,706,867) |
| Gold | ($120,130,312) |
| Australian Equities – E&R – Ethical | ($116,401,876) |
| Australian Equities – Short | ($34,858,771) |
*Past performance is not an indicator of future performance.
Comment: The first half of 2023 saw a very different mix of asset class flows compared to most years in which this report has been published. Fixed Income ETFs received the highest level of flows for the Half, as investors sought a more defensive stance in their asset allocations. Australian Equities ETFs were the second most popular category for inflows.
Top 10 Products: Half Year 2023
| Ticker | Product | Issuer | Market Cap | Rank Movement |
| VAS | Vanguard Australian Shares Index ETF | Vanguard | $12,328,554,894 | |
| MGOC | Magellan Global Fund (Open Class) (Managed Fund) | Magellan | $7,052,905,726 | |
| VGS | Vanguard MSCI Index International Shares ETF | Vanguard | $6,064,553,514 | |
| IVV | iShares S&P 500 ETF | iShares | $5,811,467,276 | |
| STW | SPDR S&P/ASX 200 | State Street | $4,722,243,279 | |
| IOZ | iShares Core S&P/ASX 200 ETF | iShares | $4,082,862,476 | |
| QUAL | VanEck Vectors MSCI World Ex-Australia Quality ETF | VanEck | $3,819,073,126 | |
| VTS | Vanguard US Total Market Shares Index ETF | Vanguard | $3,459,343,558 | |
| NDQ | Betashares NASDAQ 100 ETF | Betashares | $3,243,460,861 | +5 |
| AAA | Betashares Australian High Interest Cash ETF | Betashares | $3,207,730,797 | -1 |
Top Performing Products – Half Year 2023
| Ticker | Product Name | Performance |
| CRYP | Betashares Crypto Innovators ETF | 121.3% |
| LNAS | Global X Ultra Long Nasdaq 100 Hedge Fund | 100.5% |
| EBTC | Global X 21Shares Bitcoin ETF | 84.0% |
| FANG | Global X FANG+ETF | 77.1% |
| EETH | Global X 21Shares Ethereum ETF | 56.1% |
Past performance is not indicative of future performance. Performance shown is for a 6 month period only and is not intended to suggest a usual holding period for any fund. Longer term performance may be materially lower. Performance over longer time periods can be found on the relevant Fund’s website. Returns for funds with concentrated or geared exposures can be expected to be substantially more volatile than broad-based or ungeared exposures. The performance shown is provided for general information purposes only, is not a recommendation to make any investment or adopt any investment strategy, and should not be used as a basis of any investment decision.
Industry Forecast:
At the end of 2022 (when the industry was $133B) we forecast the industry to end 2023 in excess of $150B. While economic conditions remain uncertain and investor sentiment remains cautious, we are now upgrading that forecast to $160B and expect investors to continue to preference ETFs over unlisted Active funds for the remainder of 2023.
Explore
ETF industry
1 comment on this
Hi there to claim my Shere where I go
Counter share register