

Hugh Lam
7 minutes reading time
Betashares Senior Investment Strategist, Cameron Gleeson, recently interviewed Mark Marex, Senior Director – Nasdaq Index Research & Development and David Tsoi, Senior Product Development Specialist – Nasdaq Index Research & Development, to discuss what has driven the performance of Nasdaq companies.
Below we look at five key takeaways from the webinar, which you can view here, and how Australian investors can gain exposure to innovative companies on the Nasdaq exchange in more ways than ever through Betashares Nasdaq 100 ETF (ASX: NDQ) and two new Australian ETFs, Betashares Nasdaq Next Gen 100 ETF (ASX: JNDQ) and the Betashares Nasdaq 100 Equal Weight ETF (ASX: QNDQ).
1 – Fundamentals have driven the long term performance of the Nasdaq
Whilst the Nasdaq 100 Index is trading at all-time highs, returns have been driven by strong underlying earnings.
Mark highlights that the Nasdaq is currently trading at a similar price to earnings ratio to around 2006, at a mid-30x price to earnings ratio. Driving this similarity in valuations is bottom line earnings growth for companies in the Nasdaq 100 which have increased by 30 times over the past 20 years.
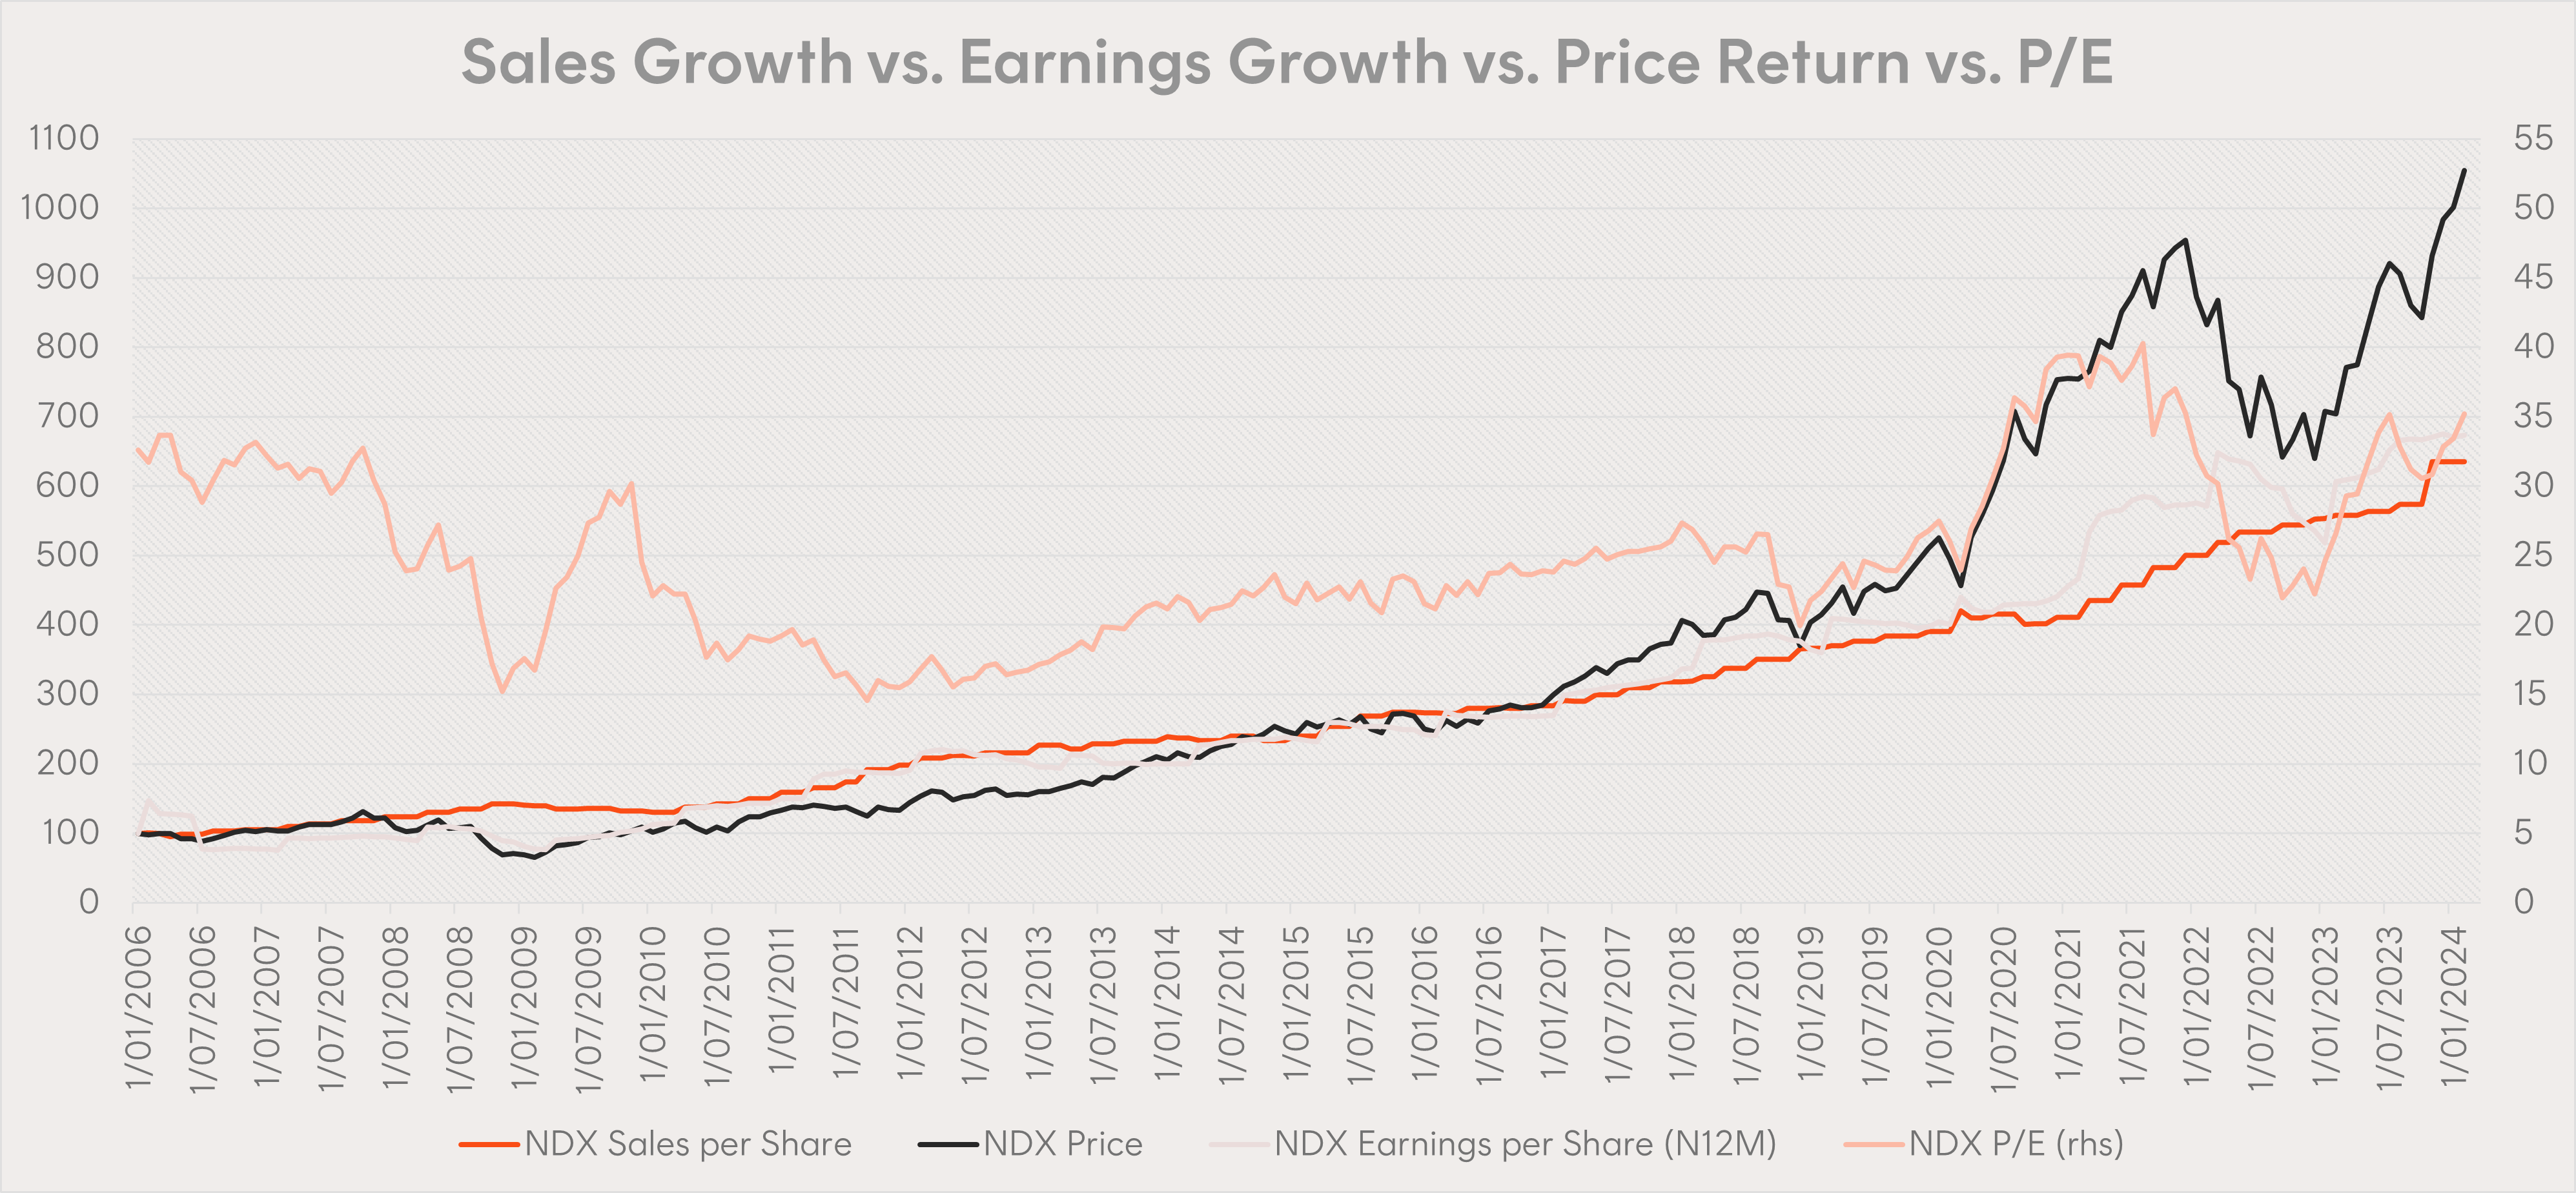
Source: Nasdaq, FactSet, Bloomberg. Data as of 29 February 2024. Past performance is not an indicator of future performance.
2 – The largest Nasdaq constituents are the biggest research and development (R&D) spenders
In order for companies to innovate and grow in the 21st century, investment in R&D is crucial.
David highlights that the top 15 companies on the Nasdaq are the biggest R&D spenders, allocating an average of 16.9% of their revenues to R&D over the past 12 months. It has been this spending on innovation in areas like enterprise, cloud computing, cybersecurity, and more recently AI that has ultimately led to underlying growth.
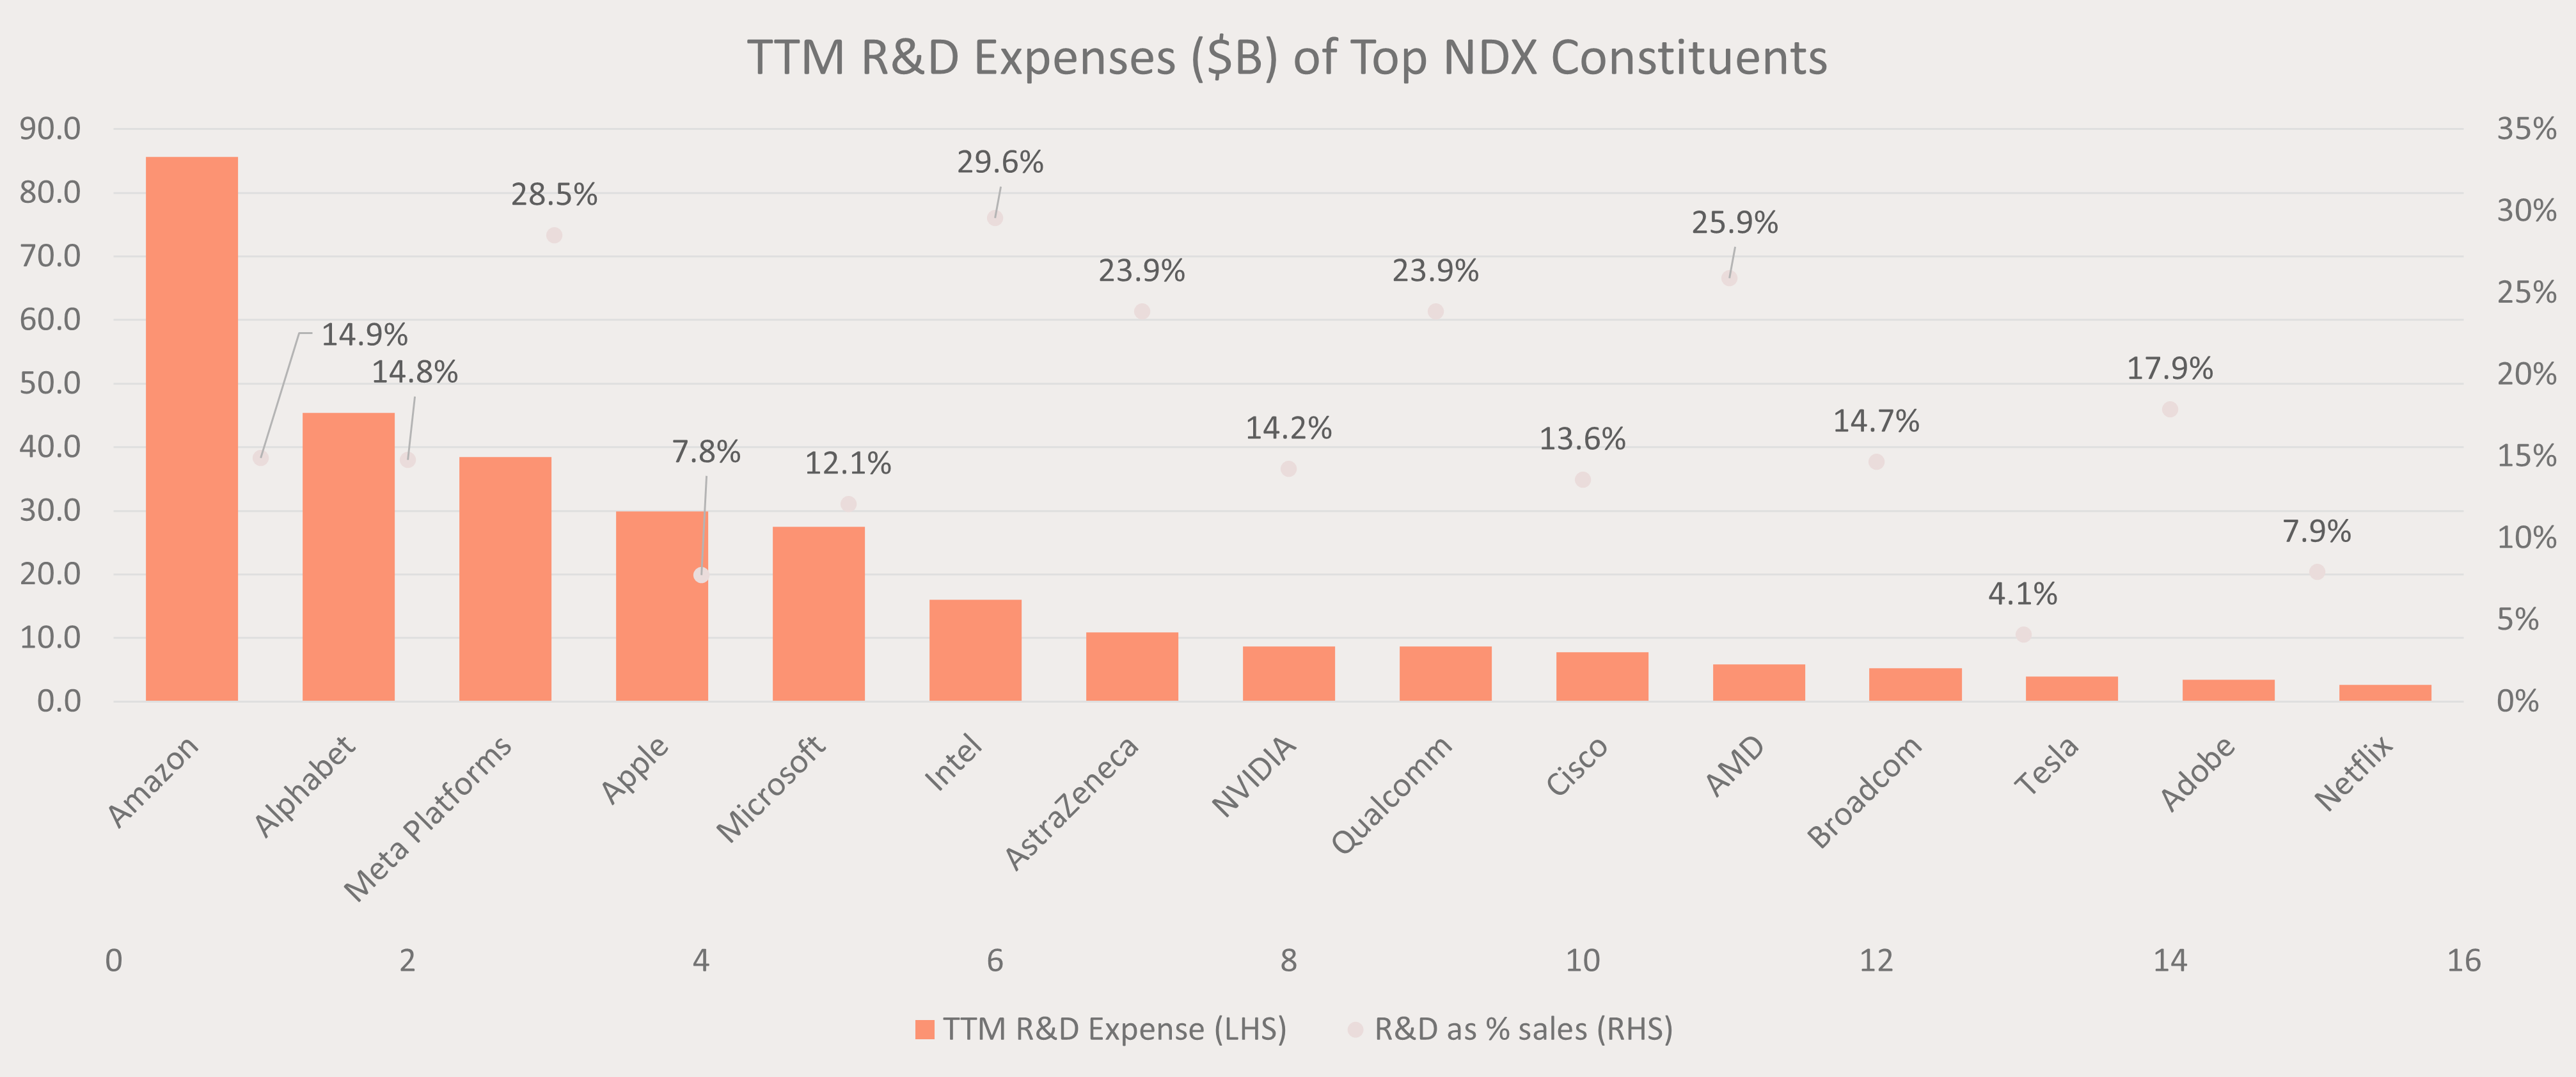
Source: Nasdaq Global Indexes, Bloomberg. Data as of 27 February 2024.
3 – 80 Nasdaq Next Generation companies have “graduated” into the Nasdaq 100 since 2010
A large number of companies in the Nasdaq-100 Index were previously in the Nasdaq Next Generation 100 Index, where there are many upcoming innovative companies. As Mark highlighted, 70-80% of price performance for these companies happened in the 12 months leading up to “graduation” into the Nasdaq 100. A potential future graduate is Super Micro Computer Inc (SMCI) which has more than tripled in price from the start of this year and may be included in the Nasdaq 100 in the next rebalance. It is currently the largest holding in the Betashares Nasdaq Next Gen 100 ETF (JNDQ) at time of writing.
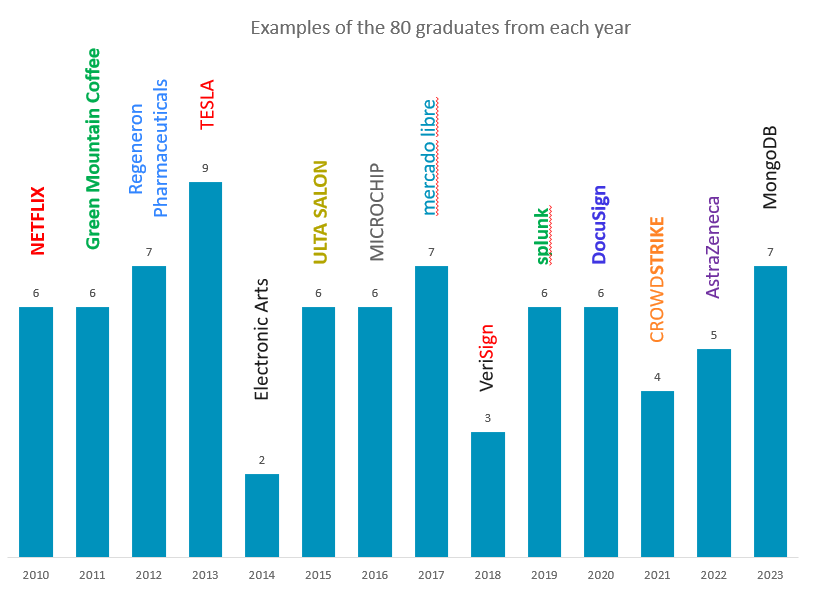
Source: Nasdaq Data as of 31 December 2023.
4 – An opportunity to address Nasdaq 100 concentration through an equal weighted approach
Market concentration in the Nasdaq remains elevated with the top 10 constituents contributing 73% of last year’s total gains. Mark highlights that tactically combining an equal weight Nasdaq 100 Index with the Nasdaq 100 can lower overall portfolio risk by reducing sector and “Mag 7” concentration. For example, the Nasdaq 100 Equal Weight had a 10% exposure to the top 10 companies compared to 48% for the Nasdaq 100.
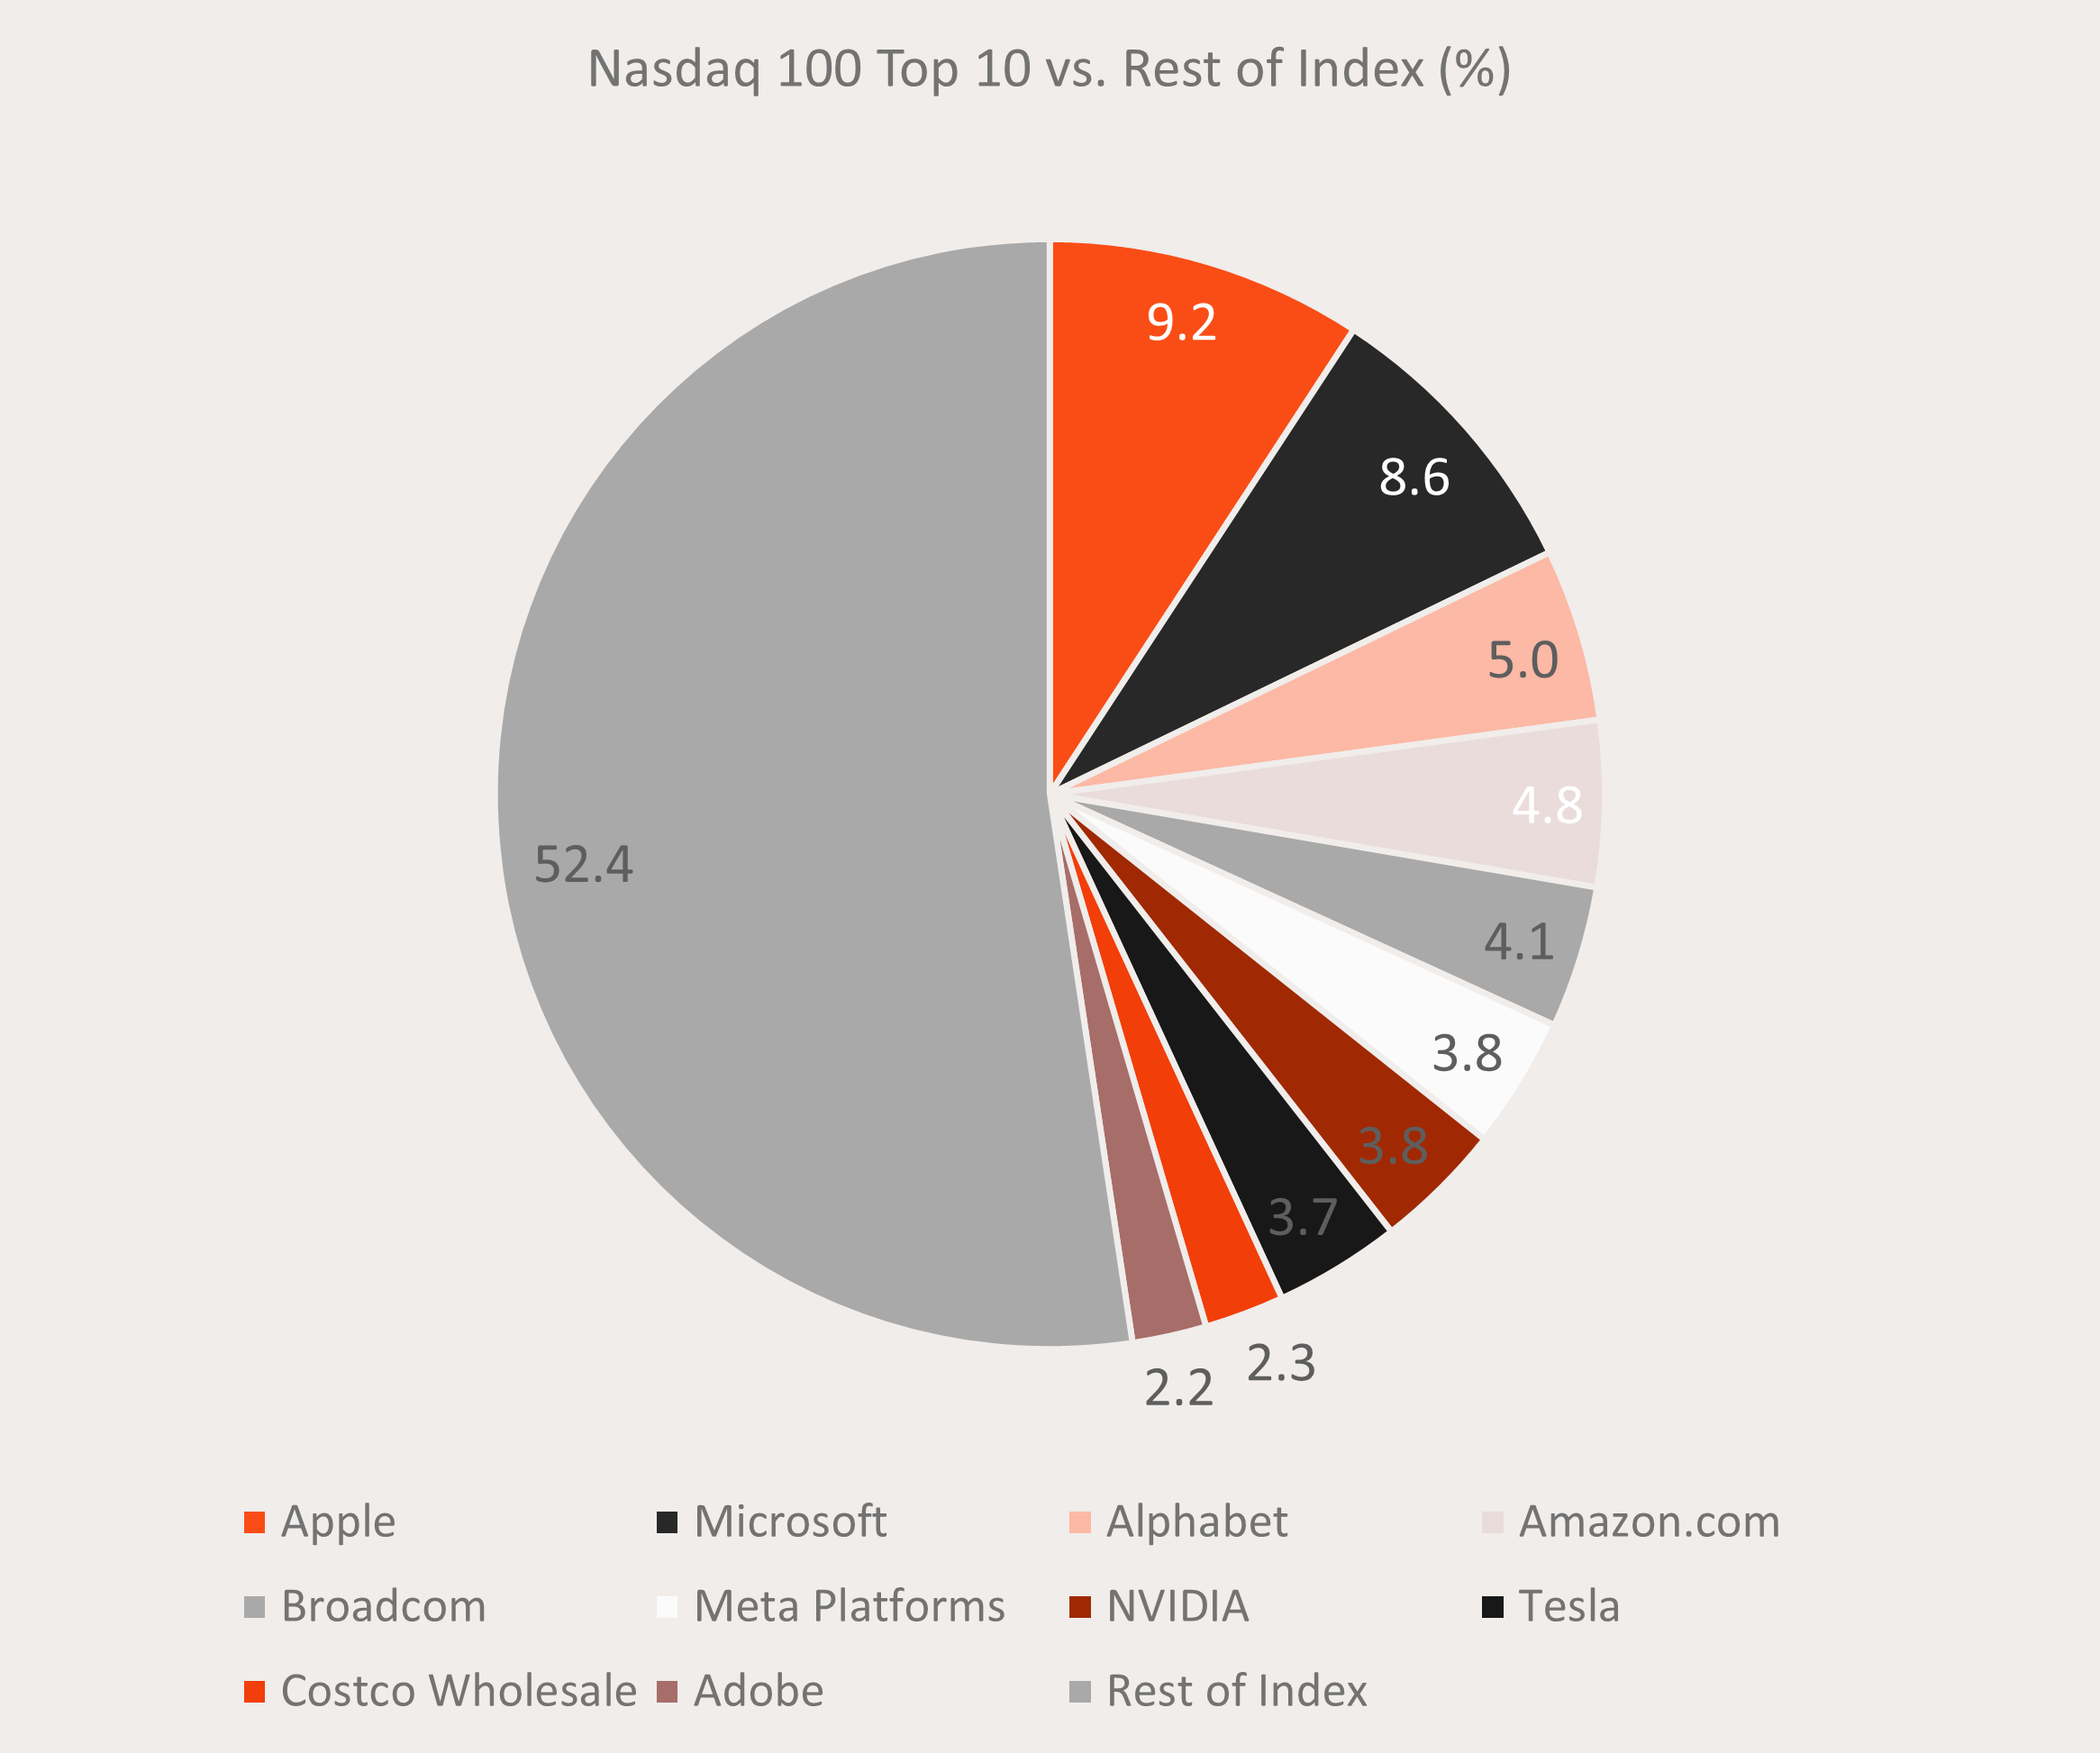
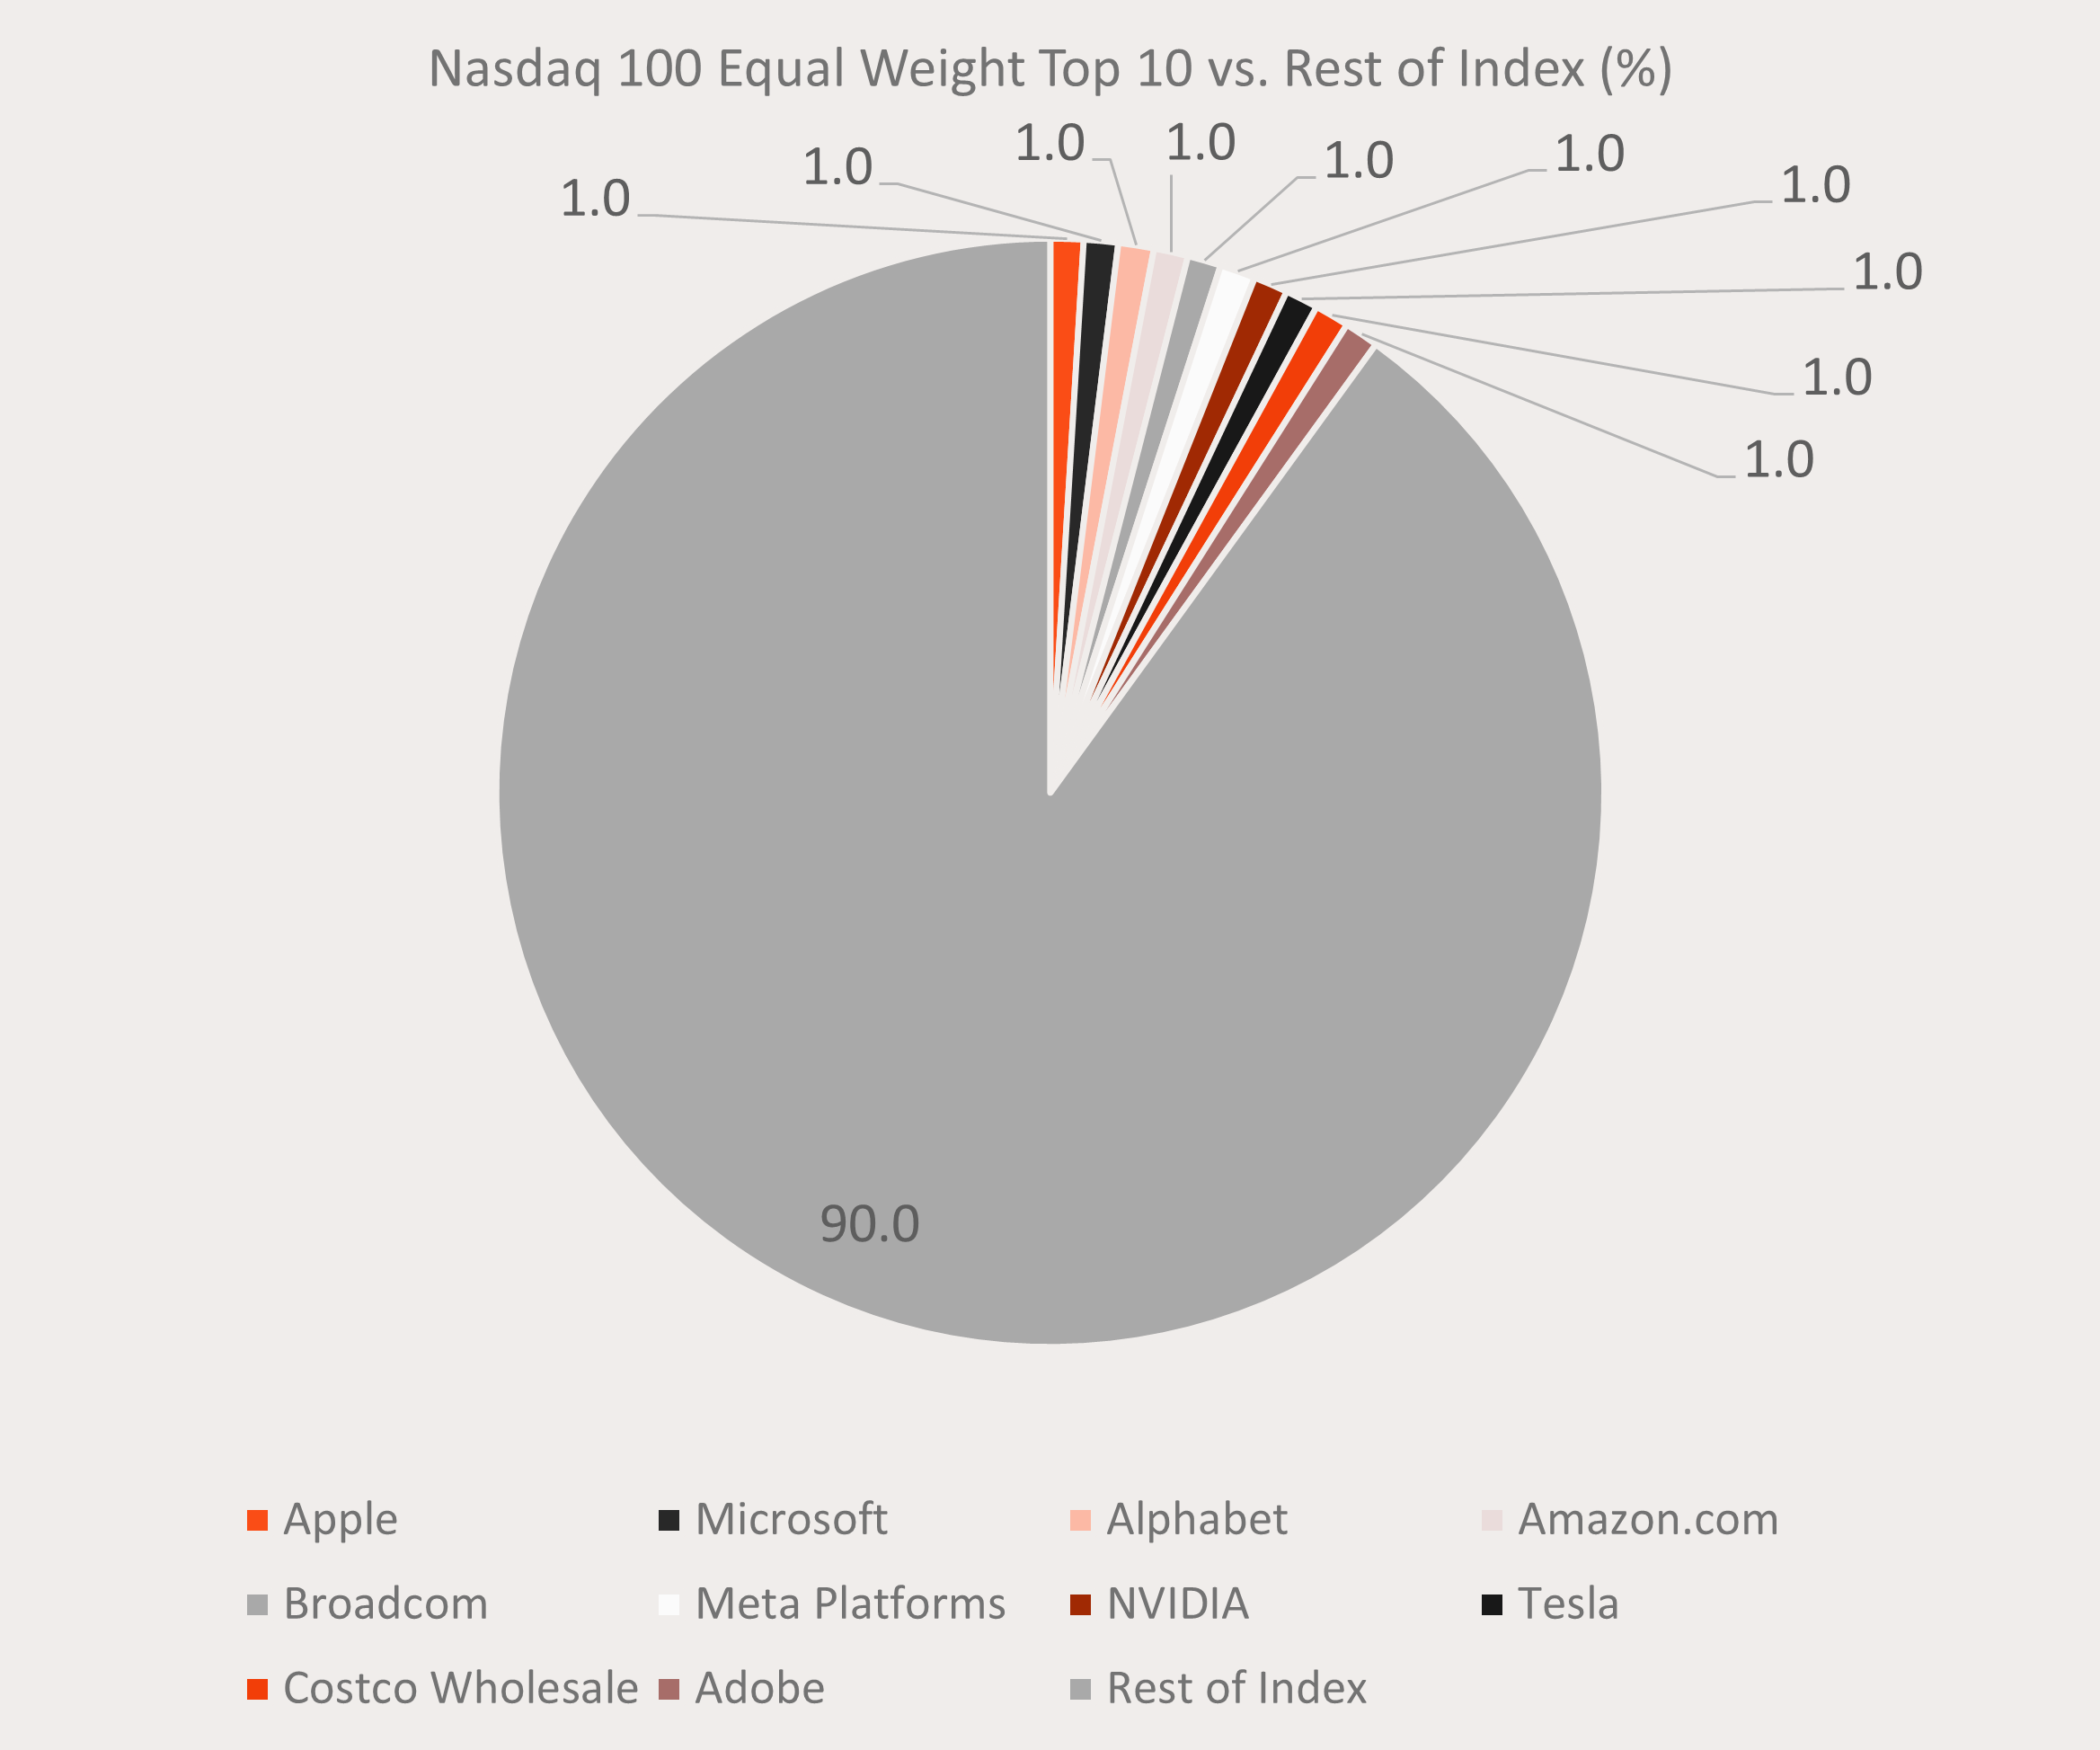
Source: Nasdaq Global Indexes, Bloomberg. Data as of 31 December 2023.
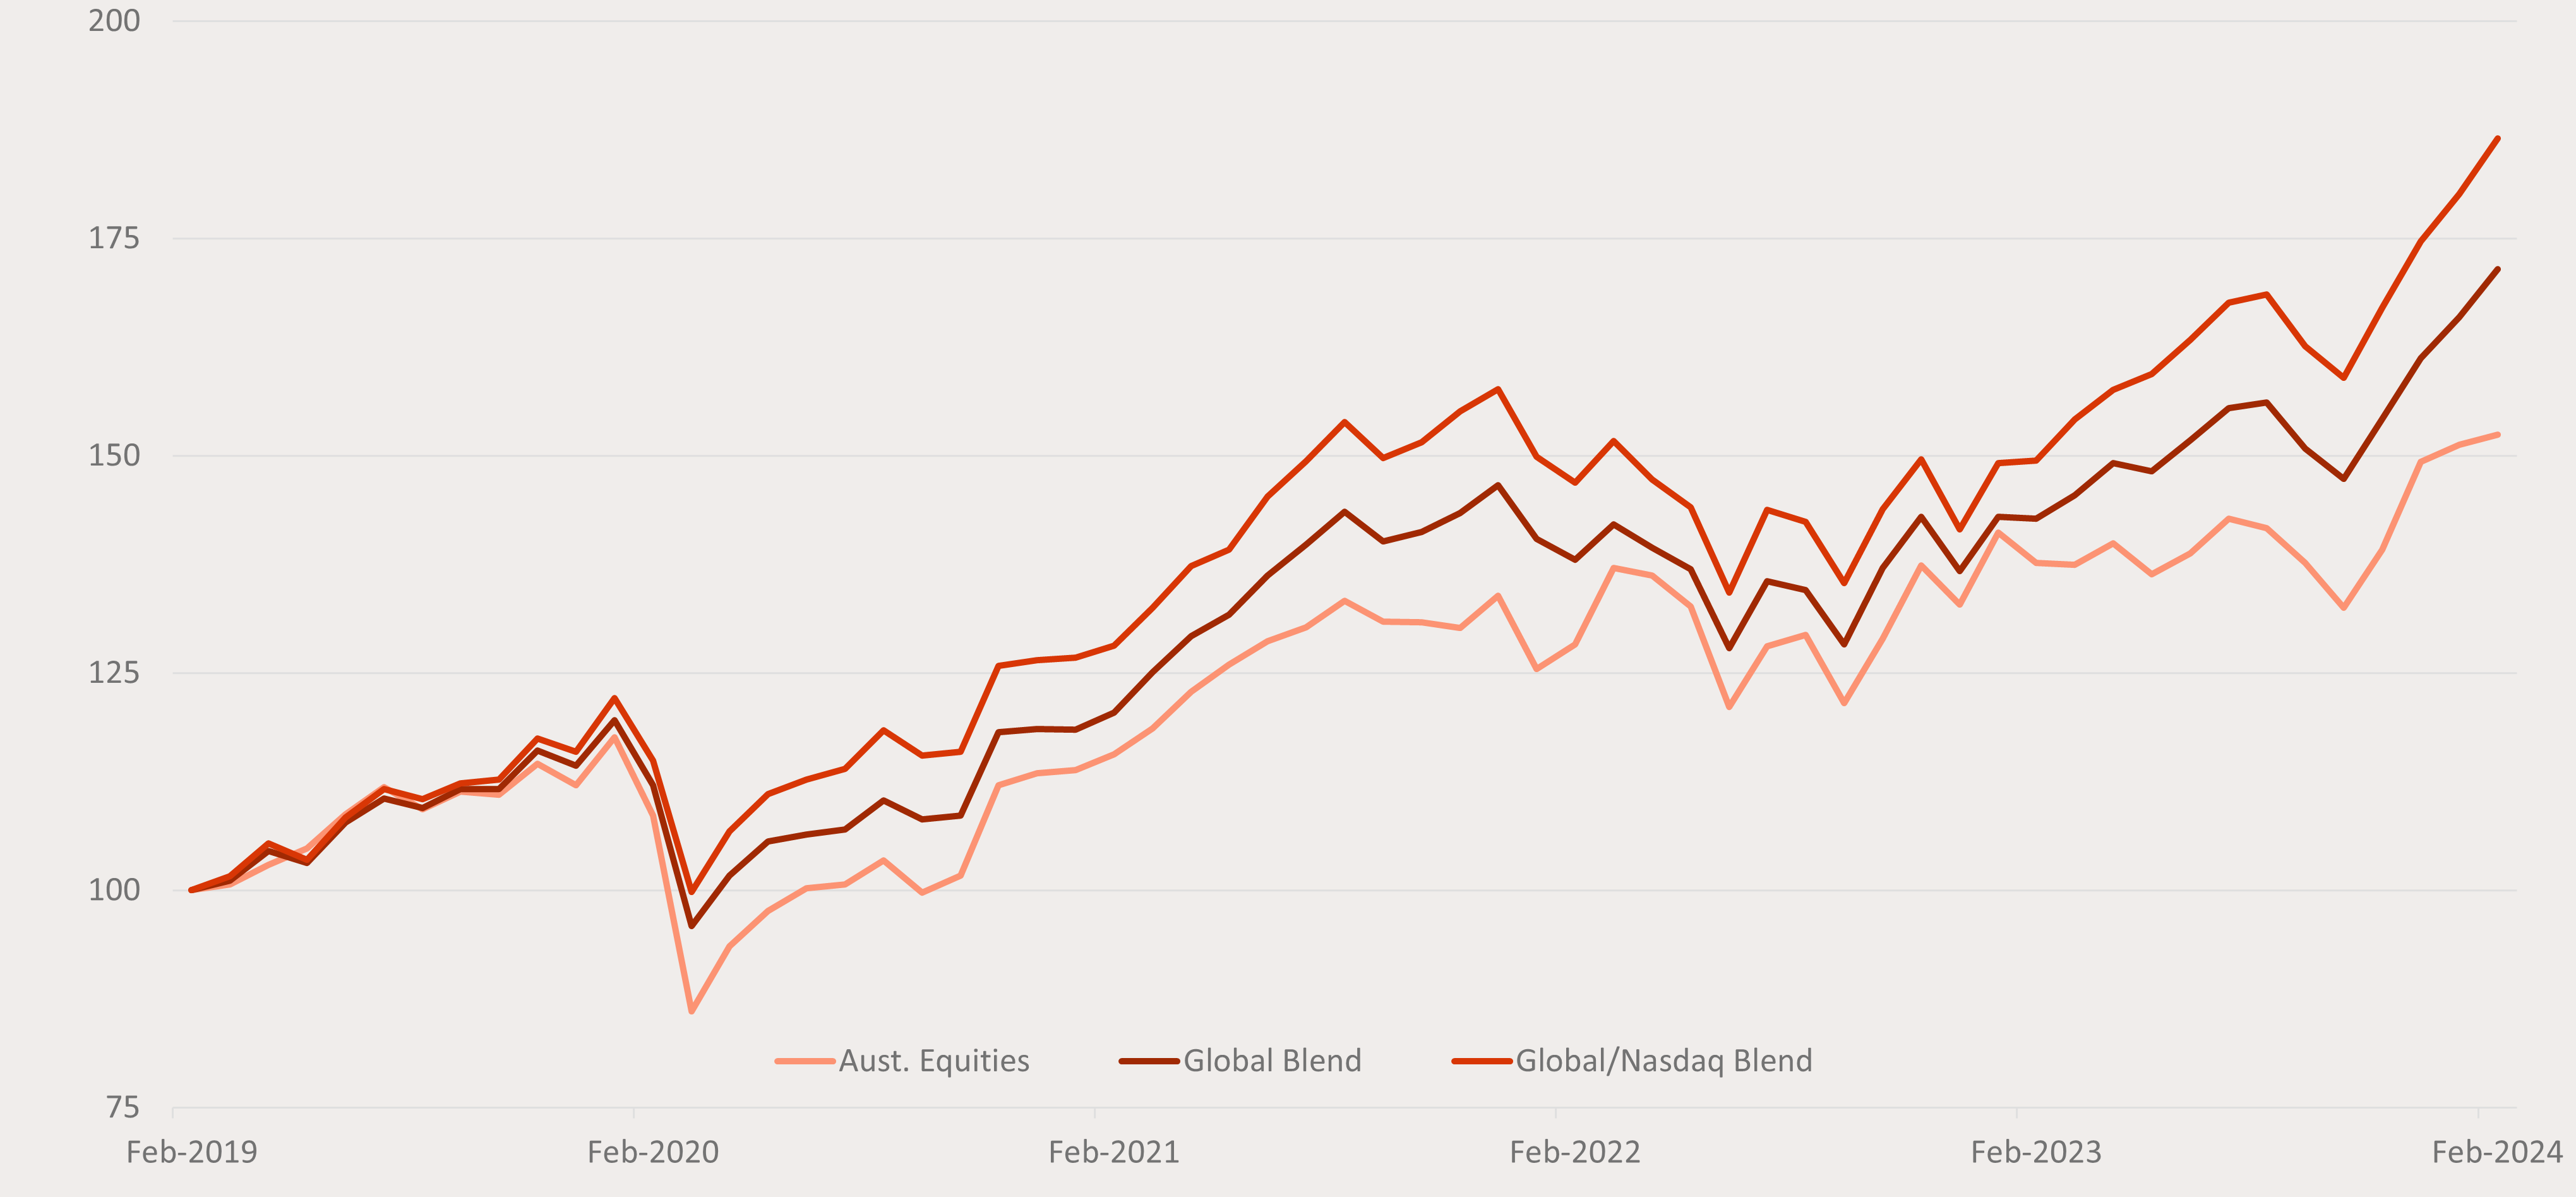
5 – Blending Australian equity exposure with the Nasdaq 100 has the potential to deliver superior risk-adjusted returns
The Australian and US share market indices are substantially different with the ASX 200 overweight Financials and Materials whilst the S&P 500 and Nasdaq indices are overweight Information Technology and Communication Services. A blended portfolio of Australian equities with both diversified global and Nasdaq exposures can significantly increase risk-adjusted returns. As an example, Cameron compares a portfolio with a 50/30/20 split of exposures to Australian equities/diversified global equities/Nasdaq 100, that produced a Sharpe Ratio of 0.88 compared to 0.45 for a pure broad based Australian equities exposure over the last 5 years.
Portfolio Total Returns (Indexed to a starting value of 100)
| Portfolio | A200’s Index | BGBL’s Index | NDQ’s Index | Total Return (p.a.) | Volatility | Sharpe Ratio |
| Aust. Equities | 100% | – | – | 8.8% | 16.4% | 0.45 |
| Global Blend | 50% | 50% | – | 11.4% | 13.1% | 0.76 |
| Global/
Nasdaq Blend |
50% | 30% | 20% | 13.3% | 13.4% | 0.88 |
Source: Bloomberg. Data as of 29 February 2024. Calculation of volatility data is based on AUD monthly returns. Portfolio returns assume monthly rebalancing to allocations shown above. For the calculation of the Sharpe Ratios an average risk-free rate of 1.47% was used. The above hypothetical example is provided for illustrative purposes only. It is not a recommendation to invest or adopt any investment strategy. A200’s Index is the Solactive Australia 200 Index, NDQ’s Index is the Nasdaq-100 Notional Net Total Return Index, BGBL’s Index is the Solactive GBS Developed Markets ex Australia Large & Mid Cap Index. Total returns shown are index returns less ETF management fees and costs. You cannot invest directly in an index. Past performance is not indicative of future performance of any index or ETF.
You can watch the full webinar on replay here.
How to gain exposure to the Nasdaq
NDQ Nasdaq 100 ETFYou can get access to the Betashares Nasdaq 100 ETF (ASX: NDQ) in a single trade on the ASX. NDQ has performed strongly since its inception in May 2015, and is one of Betashares’ biggest funds.
JNDQ Nasdaq Next Gen 100 ETF and QNDQ Nasdaq 100 Equal Weight ETF
The Betashares Nasdaq Next Gen 100 ETF (ASX: JNDQ) and Betashares Nasdaq 100 Equal Weight ETF (ASX: QNDQ) now offer Australian investors more ways to access the innovative companies on the Nasdaq exchange.
JNDQ aims to track the performance of the Nasdaq Next Generation 100 Index (before fees and expenses) which provides exposure to the 100 largest Nasdaq listed non-financial companies by market capitalization outside of the Nasdaq 100 Index.
QNDQ aims to track the performance of the Nasdaq 100 Equal Weighted Index (before fees and expenses), providing exposure to 100 of the largest non-financial companies listed on the Nasdaq with each holding in the Index weighted equally.
JNDQ:
QNDQ:
There are risks associated with an investment in each of the Funds, including market risk, country risk, currency risk and sector risk. Investment value can go up and down. An investment in any Fund should only be made after considering your particular circumstances, including your tolerance for risk. For more information on the risks and other features of a Fund, please see the relevant Product Disclosure Statement and Target Market Determination, available on this website at the links to the fund pages above.