Betashares Australian ETF Review: July 2023

Ilan Israelstam
3 minutes reading time
Related articles
Better investing starts here
Get Betashares Direct
Betashares Direct is the new investing platform designed to help you build wealth, your way.
Scan the code to download.
Learn more
Learn more
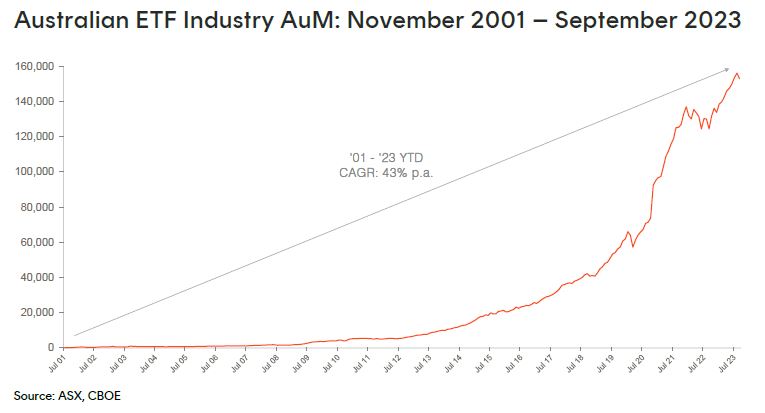
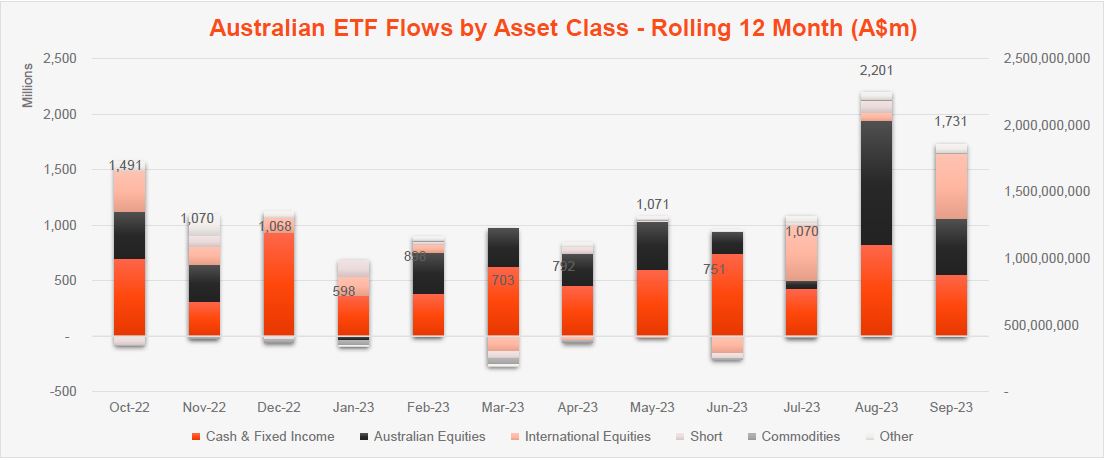
September 2023 Review: Industry declines in value as markets fall, while flows remain strong
The second highest net flows of the calendar year were not enough to combat a decline in asset values, as global sharemarket falls caused the industry to decline in September
Exchanged Traded Funds Market Cap
• Australian Exchange Traded Funds Market Cap (ASX + CBOE): $152.9B
• ASX CHESS Market Cap: $137.9B1
• Market Cap increase for month: -2.0%, -$3.1B
• Market Cap growth for last 12 months: 22.9%, $28.5B
New Money
• Net inflows for month: $1.7B – 2nd highest inflows for 2023 to date
Products
• 350 Exchange Traded Products trading on the ASX & CBOE
• Nine new ETFs launched: Betashares launched two US Treasury Bond ETFs including the first
UTIP
Inflation-Protected U.S. Treasury Bond Currency Hedged ETF
and a
US10
U.S. Treasury Bond 7-10 Year Currency Hedged ETF
; the ASX had a further 5 ETF launches in the Government Bond & thematic space by VanEck, Global X and iShares. 2 new funds were launched on CBOE – Active ETFs from Coolabah Capital (Active short term bonds) and JPMorgan (Active Emerging Markets equity)
• 1 XTB single bond exposure was closed
Trading Value
• After very high levels of trading value last month, trading value dropped back by ~20% in September, with ASX trading value of $9B for the month
Performance
•
URNM
Global Uranium ETF
was the best performing product for the second month in a row, rising an additional 24% (after the ~15% rise last month). With sharp falls in the US sharemarket in September, geared short US equities exposures such as
BBUS
US Equities Strong Bear Currency Hedged Complex ETF
performed strongly (~13% for the month)
Source: ASX, CBOE
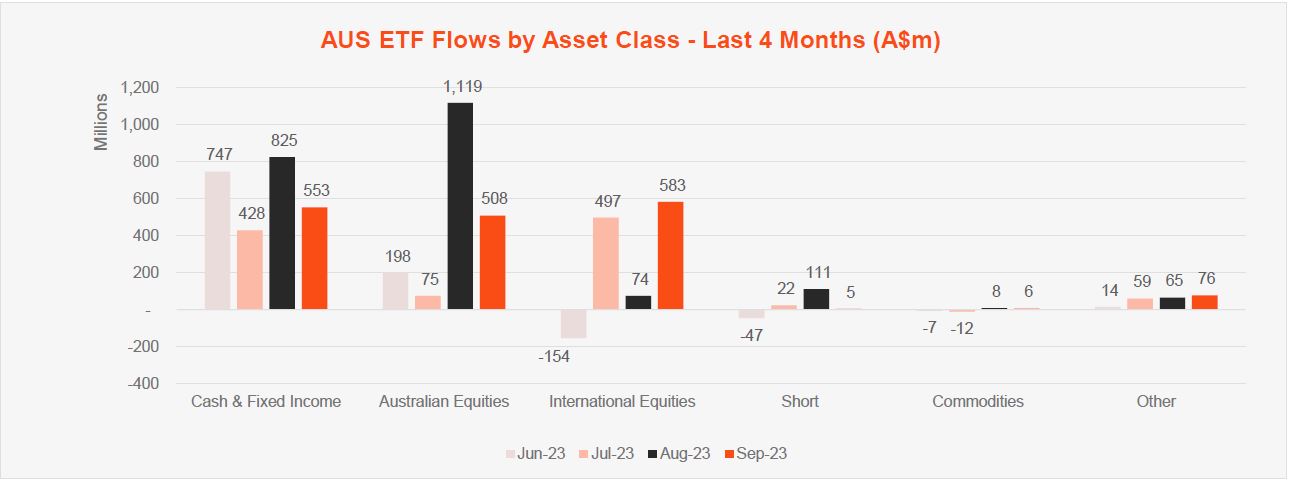
Top 5 category inflows (by $) – September 2023
| Broad Category | Inflow Value |
| International Equities | $582,641,062 |
| Australian Equities | $508,148,070 |
| Fixed Income | $475,245,385 |
| Cash | $78,162,605 |
| Multi-Asset | $43,254,425 |
Comment: For only the second time in the last 12 months, we saw a return to meaningful inflows in the International equities ETF segment, which was the highest category for new money ($583m). Australian equities also had strong inflows ($508m), and it appears as though ETF investors are making a return to equity investing after focusing heavily on Fixed Income exposures for the majority of the year to date.
Source: ASX, CBOE
Top sub-category inflows (by $) – September 2023
| Sub-category | Inflow Value |
| Australian Equities – Broad | $408,422,025 |
| Australian Bonds | $289,369,893 |
| International Equities – Developed World | $253,281,657 |
| International Equities – US | $213,222,231 |
| Global Bonds | $175,619,140 |
Top sub-category outflows (by $) – September 2023
| Sub-Category | Inflow Value |
| Australian Equities – Large Cap | ($43,527,379) |
| Australian Equities – Short | ($19,421,259) |
| Oil | ($15,717,460) |
| International Equities – E&R – ESG Lite | ($8,595,741) |
| Other | ($6,285,448) |
Comment: Like last month, there were very little outflows at a category or sub-category level this month, with ETF investors largely choosing to hold or add to their positions, in aggregate.
*Past performance is not an indicator of future performance.
1. Since February 2023, the ASX started reporting additional data on a CHESS-only basis. The primary use of such data is that it excludes, amongst other things, the FuM and Flows in ‘dual class’ Active ETFs and potentially provide a more accurate picture of exchange traded activity.
UTIP
Inflation-Protected U.S. Treasury Bond Currency Hedged ETF
keyboard_arrow_down
Invest in a portfolio of inflation-protected US Treasuries
US10
U.S. Treasury Bond 7-10 Year Currency Hedged ETF
keyboard_arrow_down
Generate income and defend your portfolio with US Treasury bonds
URNM
Global Uranium ETF
keyboard_arrow_down
Access leading companies in the global uranium industry
BBUS
US Equities Strong Bear Currency Hedged Complex ETF
keyboard_arrow_down
Opportunity to profit from, or protect against a declining U.S. sharemarket
Explore
ETF industry