

Tom Wickenden
7 minutes reading time
The broader Australian equity market has suffered two consecutive financial years of negative earnings growth. In fact, from the end of FY23 to FY25, earnings at the ASX 200 level fell 13%1 – this is in stark contrast to the remarkable growth experienced in the US led by mega cap technology companies.
However, this underwhelming headline for the ASX 200 masks strong pockets of growth under the surface of the Australian equity market. For instance, the Australian Information Technology (IT) sector has achieved a higher rate of earnings growth than its S&P 500 counterpart over this same two-year period2. In FY25, the Australian IT sector grew earnings by a commendable 26.4%, trailing only the complementary Communication Services sector.
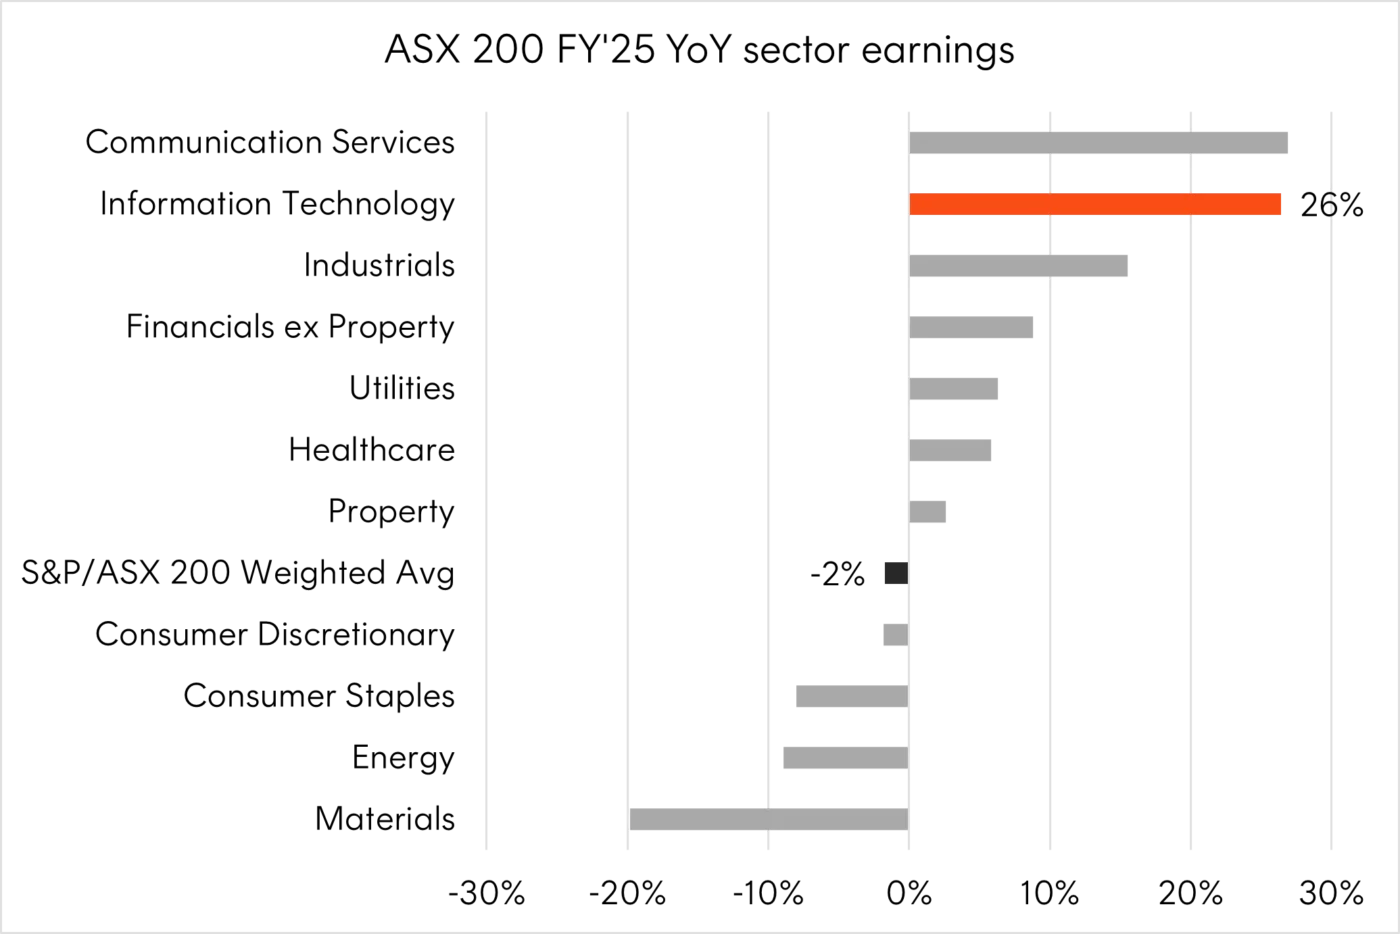
Source: FactSet data. As at 1 September 2025.
Ultimately, the poor earnings growth of the ASX 200 has come down the market’s makeup. Namely the concentration in lower growth blue chip companies and, over recent years, the suffering materials sector.
While our IT sector has recorded strong earnings growth, and returns, it only represents 3% of the weight of the ASX 200 – this compares to 20% for Materials and 35% for Financials3.
So, is there a strong case for Australian investors increasing their allocation to local technology names?
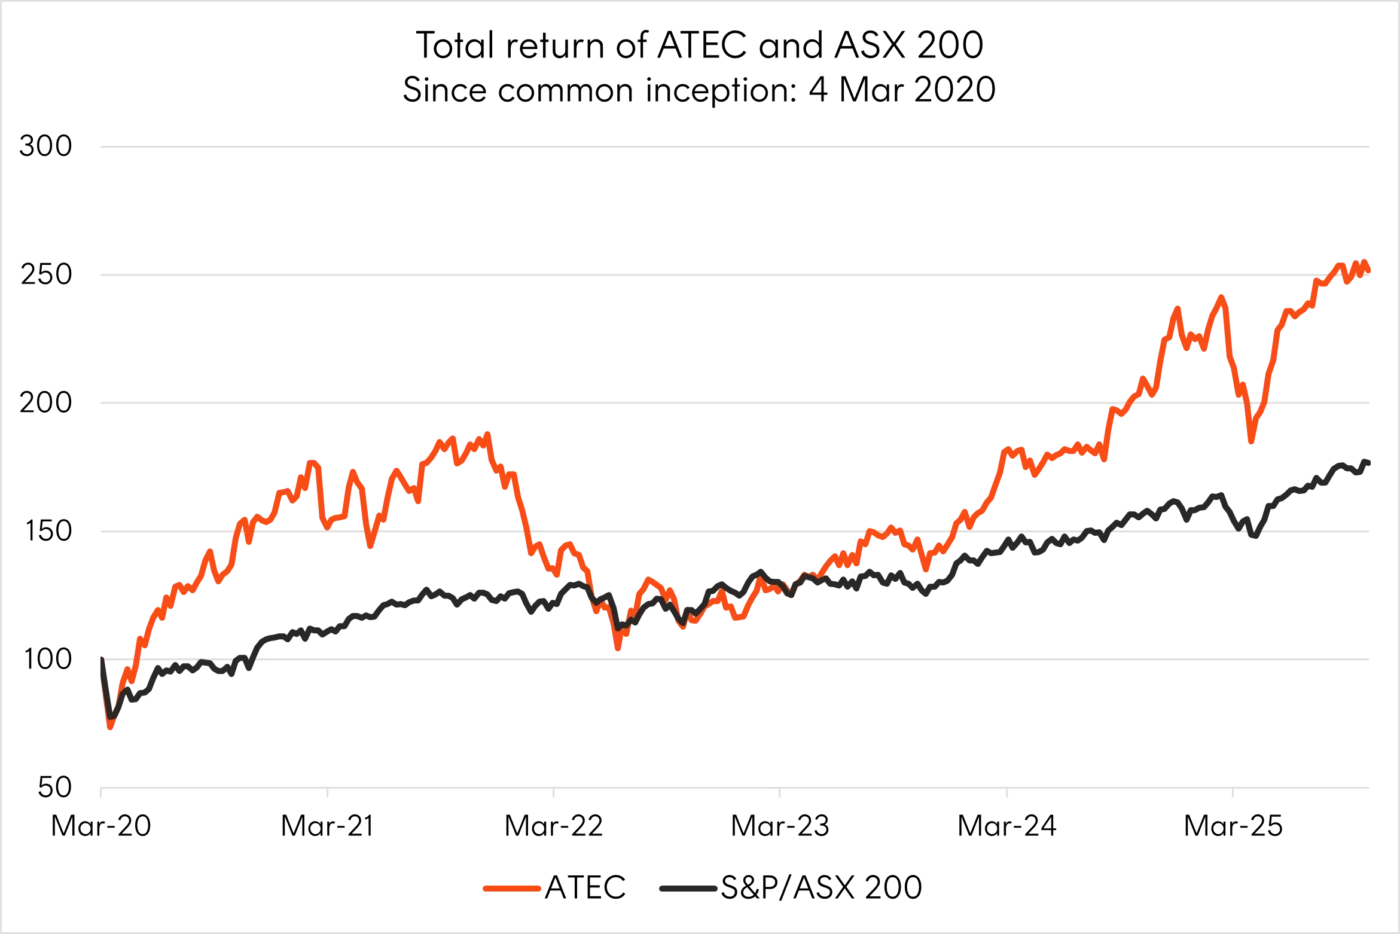
Source: Bloomberg. 4 March 2020 to 14 October 2025. ATEC represents the live performance of Betashares S&P/ASX Australian Technology ETF. You cannot invest directly in an index. Past performance is not an indicator of future performance.
Seeking out strong earnings growth in the Australian market
From an earnings perspective, earnings being the main driver of long-term equity performance, Australian technology appears well placed to continue its run of strong growth.
Earnings growth has been broad across the Australian technology companies with 75% reporting positive earnings growth for FY25 and over 30% of companies reporting growth of 50% or more4. By comparison more than half of the companies in the ASX 200 not in the IT sector reported negative earnings growth over the same year5.
Over the next two years, the companies in the S&P/ASX All Technology Index are expected to grow earnings above 25%, not only outpacing the ASX 200 by three times, but also at a higher rate than the US IT sector6.
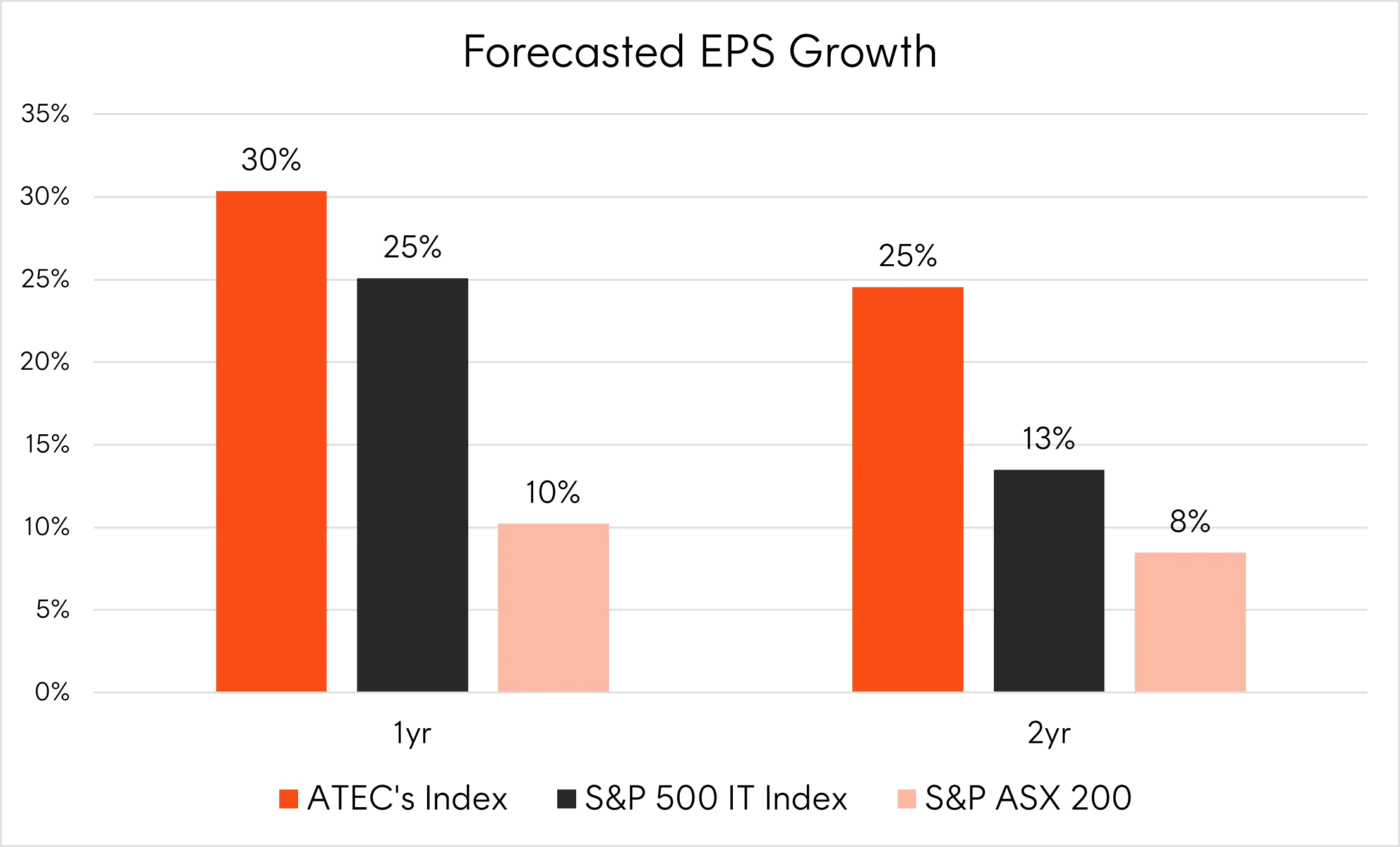
Source: Bloomberg. As at 15 October 2025. Bloomberg analyst consensus forecasts. Actual results may differ materially from forecasts.
Australia’s monetary policy setting is expected to be another key driver of this growth. The Reserve Bank’s shift toward a rate-cutting cycle has created conditions that are typically supportive for Australia’s mid and small cap technology companies.
Relative to large caps, these businesses are generally earlier in their lifecycle and are still expanding their product ranges and customer bases, leaving them more reliant on external capital to fund growth and more sensitive to borrowing costs. Consequently, easing cycles have historically favoured mid and small cap performance, relative to their large cap counterparts.
Tomorrow’s global technology leaders
The ASX technology sector already contains household names in Xero, a global leader in accounting software, CarSales, the leading car marketplace in Australia with international expansion well underway, and Life360, the US founded ASX listed location servicing app operating in 170 countries with 71 million monthly users7.
But it equally has a growing list of companies that could be tomorrow’s technology giants.
ATEC Top 10 holdings:
|
Name |
Industry |
|
Computershare |
Financial Services & Capital Markets |
|
Xero |
Accounting & Financial Management |
|
Pro Medicus |
Healthcare & Medical Imaging |
|
WiseTech |
Logistics & Supply Chain |
|
Carsales.com |
Automotive |
|
Technology One |
Enterprise Resource Planning |
|
Life360 |
Consumer Safety & Location Services |
|
REA Group |
Real Estate & Property |
|
NEXTDC |
Data Centres & Cloud Infrastructure |
|
SEEK |
Employment & Recruitment |
As at 15 October 2025. No guarantee any of these companies will remain in the portfolio or be a profitable investment.
Two examples of innovative companies growing into global leaders in Australia’s technology sector are WiseTech and Pro Medicus.
WiseTech – The future of global logistics today
WiseTech serves over 17,000 logistics companies across 195 countries, including 46 of the top 50 global third-party logistics providers and 24 of the 25 largest global freight forwarders. WiseTech’s flagship software, CargoWise, has progressed from serving small and medium freight forwarders to becoming close to the industry standard operational platform for freight forwarding, with its solutions offering logistics companies the opportunity to replace outdated legacy software with a highly efficient, automated, and integrated platform. The company delivered strong H1 2025 results with revenue of $381.0m (up 17%) and EBITDA of $192.3m (up 28%), achieving a 50% EBITDA margin8.
Among six top 25 Global Freight Forwarders using CargoWise since fiscal year 2011, container volumes grew by 82% through FY24, compared to 12% for the remaining top 25 forwarders not using the platform during that period9. The company maintains industry-leading customer retention with annual attrition below 1% for 12.5 consecutive years and 99% recurring revenue for CargoWise10.
Pro Medicus – Radiology reenvisaged
Founded in 1983, Pro Medicus has grown from a small Australian medical imaging software provider into a global leader in radiology IT solutions, servicing major US academic hospitals, healthcare networks, and imaging practices worldwide with its flagship Visage 7 platform. In H1 2025, the company reported record results with revenue of $97.2 million (up 31.1%) and net profit after tax of $51.7 million (up 42.7%)11. Pro Medicus achieved an EBITDA margin of 75% and EBIT margin of 71.9%, remains debt-free with cash and financial assets of $182.3 million (up 17.7%), and declared a fully franked interim dividend of 25 cents per share12.
Pro Medicus’ Visage software enables radiologists to view and interpret medical images at unprecedented speed, approximately 60 to 70% faster than legacy systems, significantly improving diagnostic efficiency and patient outcomes. This cloud-native platform replaces fragmented legacy systems with a single integrated solution, allowing healthcare organisations to handle massive imaging datasets across hospital networks and geographies.
The company now holds 9% of the US radiology market (up from 7% in 2024 and 4% five years ago) and has achieved a 100% customer retention rate since 2009 with customer volumes growing four to seven times faster than the industry average13. Pro Medicus future growth is leveraged to global aging populations and the likelihood of increased radiology needs in years to come.
Investment implications
Australian investors likely have a low exposure to Australia’s technology sector given it has just a 3% weight in the ASX 200.
For those looking to allocate to the sector, Betashares partnered with S&P in 2020 to launch the S&P/ASX Australian Technology ETF (ASX: ATEC). ATEC provides exposure to leading ASX-listed companies in a range of tech-related market segments such as information technology, consumer electronics, online retail and medical technology.
ATEC has returned, on average, 17.26% p.a. since its inception on the 4th of March 202014.
You can find more information about ATEC on its fund page here.
Sources:
1. Source: Factset. As at 1 September 2025. ↑
2. Source: Bloomberg. As at 15 October 2025. ↑
3. As at 15 October 2025. ↑
4. Source: Bloomberg. Australian technology companies included in the S&P/ASX All Technology Index. As at 15 October 2025. ↑
5. Source: Bloomberg. As at 15 October 2025. ↑
6. Source: Bloomberg. As at 15 October 2025. Bloomberg analyst consensus forecasts. Actual results may differ materially from forecasts. ↑
7. Source: Life360 company reports ↑
8. Source: WiseTech company reports H1 2025. ↑
9. Source: WiseTech company reports H1 2025. ↑
10. Source: WiseTech company reports H1 2025. ↑
11. Source: Pro Medicus Limited Interim Results ↑
12. Source: Pro Medicus Limited Interim Results ↑
13. Source: Pro Medicus Limited Interim Results ↑
14. As at 30 September 2025. Past performance is not an indicator of future performance. ↑