
Tom Wickenden
6 minutes reading time
Global markets grew on cautious optimism during September. All eyes were on the Fed, who delivered a 25bps rate cut, resuming their cutting cycle that had been on pause since the December meeting. Meanwhile the broader Australian market fell from all-time highs set in August – but the headline return figure of the ASX200 masks plenty of movement going on below the surface.
In this edition of charts of the month we take a deep dive into some of the factors that drove the Fed’s rate cut, why the Australian market might be at the start of a broader rotation, the case for gold miners to keep outperforming and look at Asian tech’s valuation gap.
1 – The Fed cuts with all eyes on employment
The last time the Fed cut interest rates with inflation as high as 2.7%, remembering that they target a 2% level, was October 2008 in the midst of the Global Financial Crisis (GFC). September’s cut came at a time when inflation still sat at 2.9%.
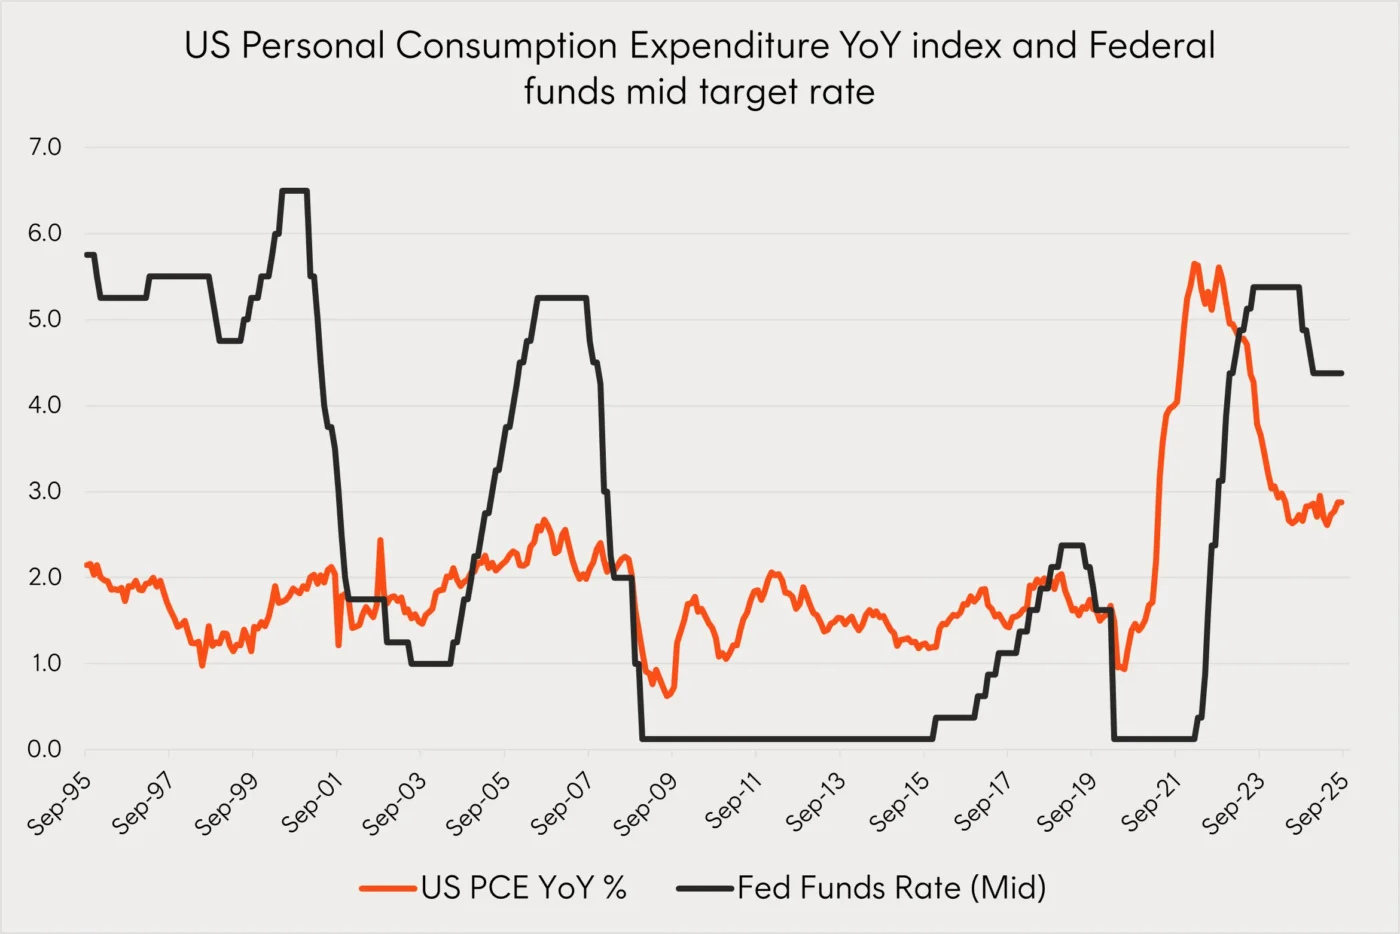
Source: Bloomberg, Betashares. September 1995 to September 2025. Personal consumption expenditures (PCE), also known as consumer spending, is a measure of the spending on goods and services by people of the United States.
This points to a potential shift from inflation to employment as the biggest swing factor for rate decisions. The unemployment rate is still relatively low at 4.3%, well below the long run 5.7% average1.
However, September marked the crossing of US job openings and US unemployed persons for the first time since the Covid-19 pandemic meaning there are less jobs available today than those who are looking for them.
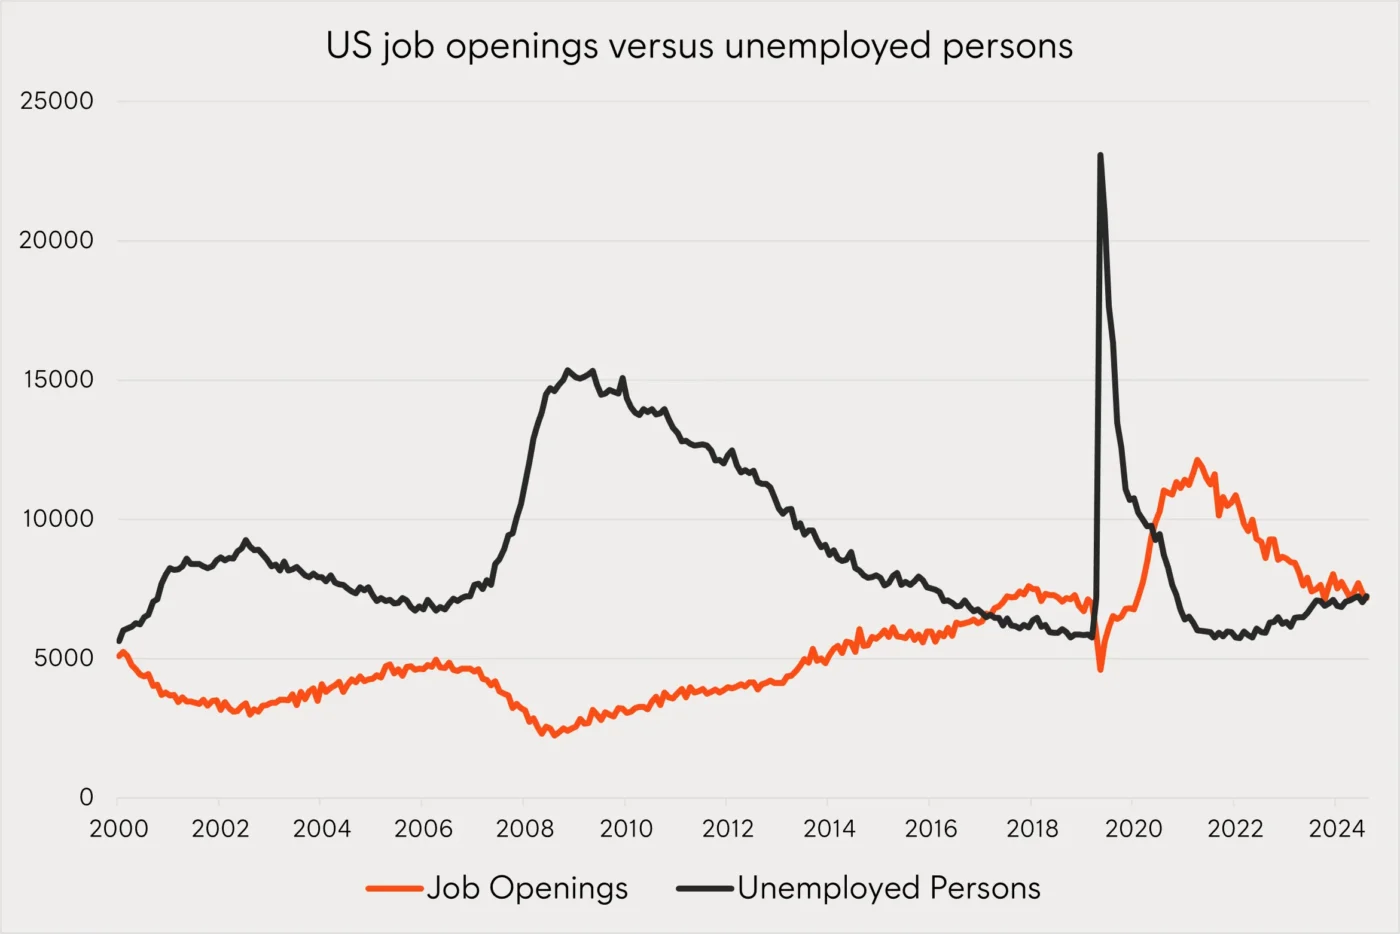
Source: Bloomberg, Federal Reserve Bank of St. Louis, Betashares. December 2000 to September 2025.
And sealing the Fed’s decision were the preliminary revisions to prior year US Payroll numbers. The figures point to US job growth being revised down by 911,000 persons – a record revision suggesting the job market has been much weaker than initially thought over recent years.
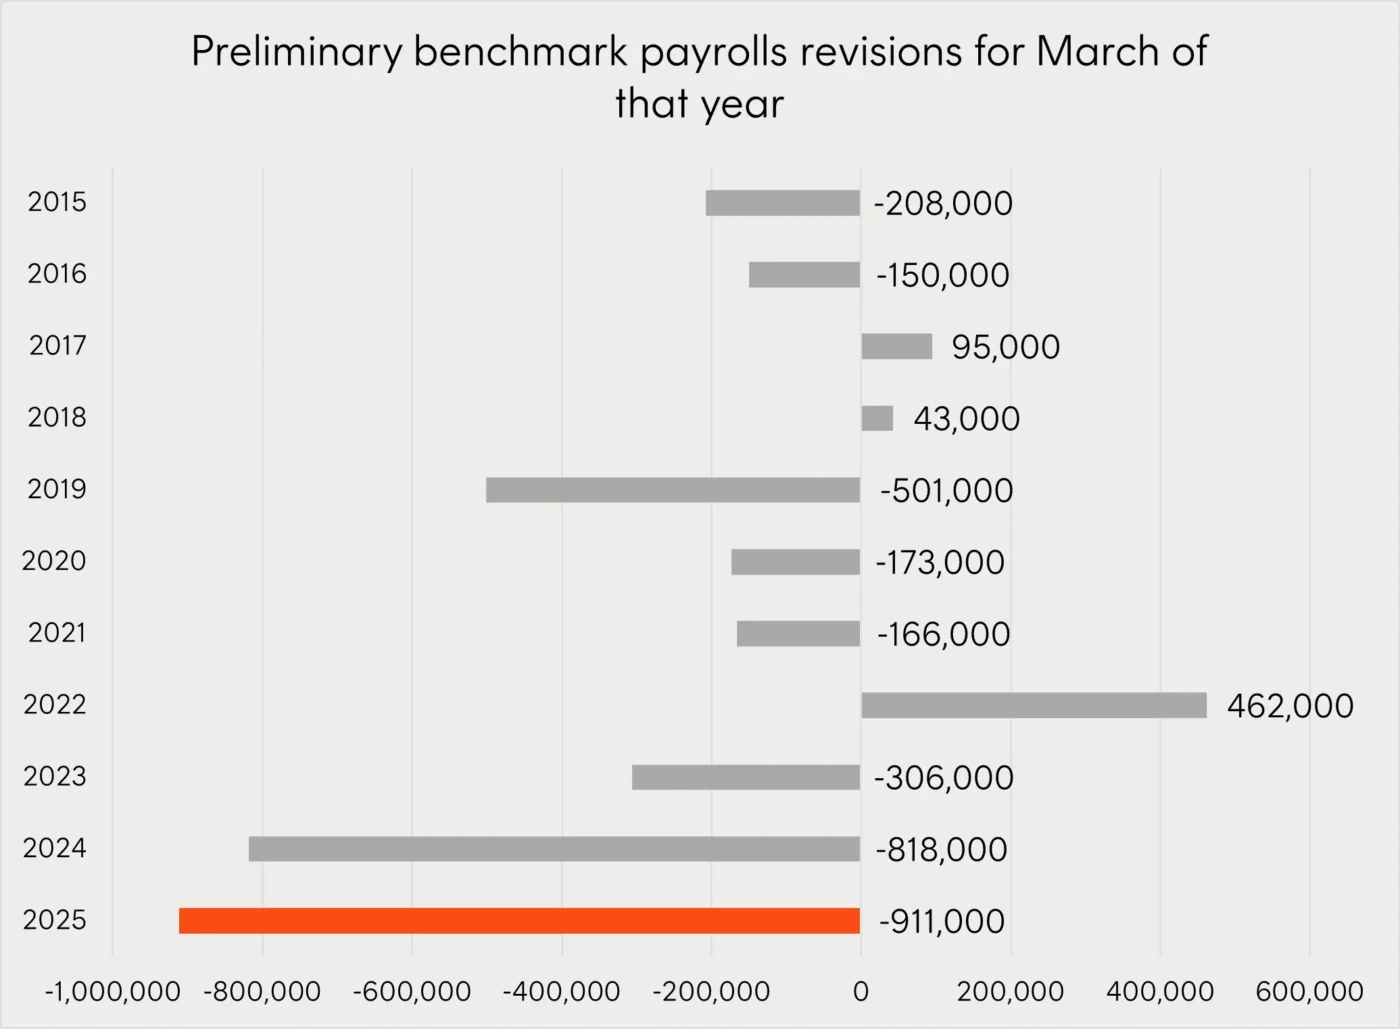
Source: Bureau of Labor Statistics. 2015 to 2025.
All-in-all there are a few charts we are keeping an eye on for the future direction of Fed policy and the US economy, but this month it was employment data stealing the show.
2 – Australian rotation?
The ASX 200 reached an all-time high on August 21 breaching the 9,000 level for the first time. This came amidst the corporate earnings season which saw the index record a third consecutive year of earnings declines with a -1.7% drop at the index level.
However, as we have pointed to for a number of years now, there are very strong pockets of earnings growth in the Australian market. The Communication Services and Information Technology sectors have been amongst some of the highest in the index for earnings growth however they only make up a collective 6% in the ASX 200.
|
Sector |
FY’25 YoY earnings |
|
ASX200 Communication Services |
26.90% |
|
ASX200 Information Technology |
26.40% |
|
ASX200 Industrials |
15.50% |
|
ASX200 Financials ex Property |
8.80% |
|
ASX200 Utilities |
6.30% |
|
ASX200 Healthcare |
5.80% |
|
ASX200 Property |
2.60% |
|
S&P/ASX 200 Weighted Avg |
-1.70% |
|
ASX200 Consumer Discretionary |
-1.80% |
|
ASX200 Consumer Staples |
-8.00% |
|
ASX200 Energy |
-8.90% |
|
ASX200 Materials |
-19.80% |
Source: FactSet data. As at 1 September 2025.
With stronger earnings growth and less exposure to the suffering blue chip Material’s companies Australia’s small- and mid-caps begun outperforming during the full year reporting season. With the prospect of further rate cuts the market environment could be ripe for this rotation to continue.
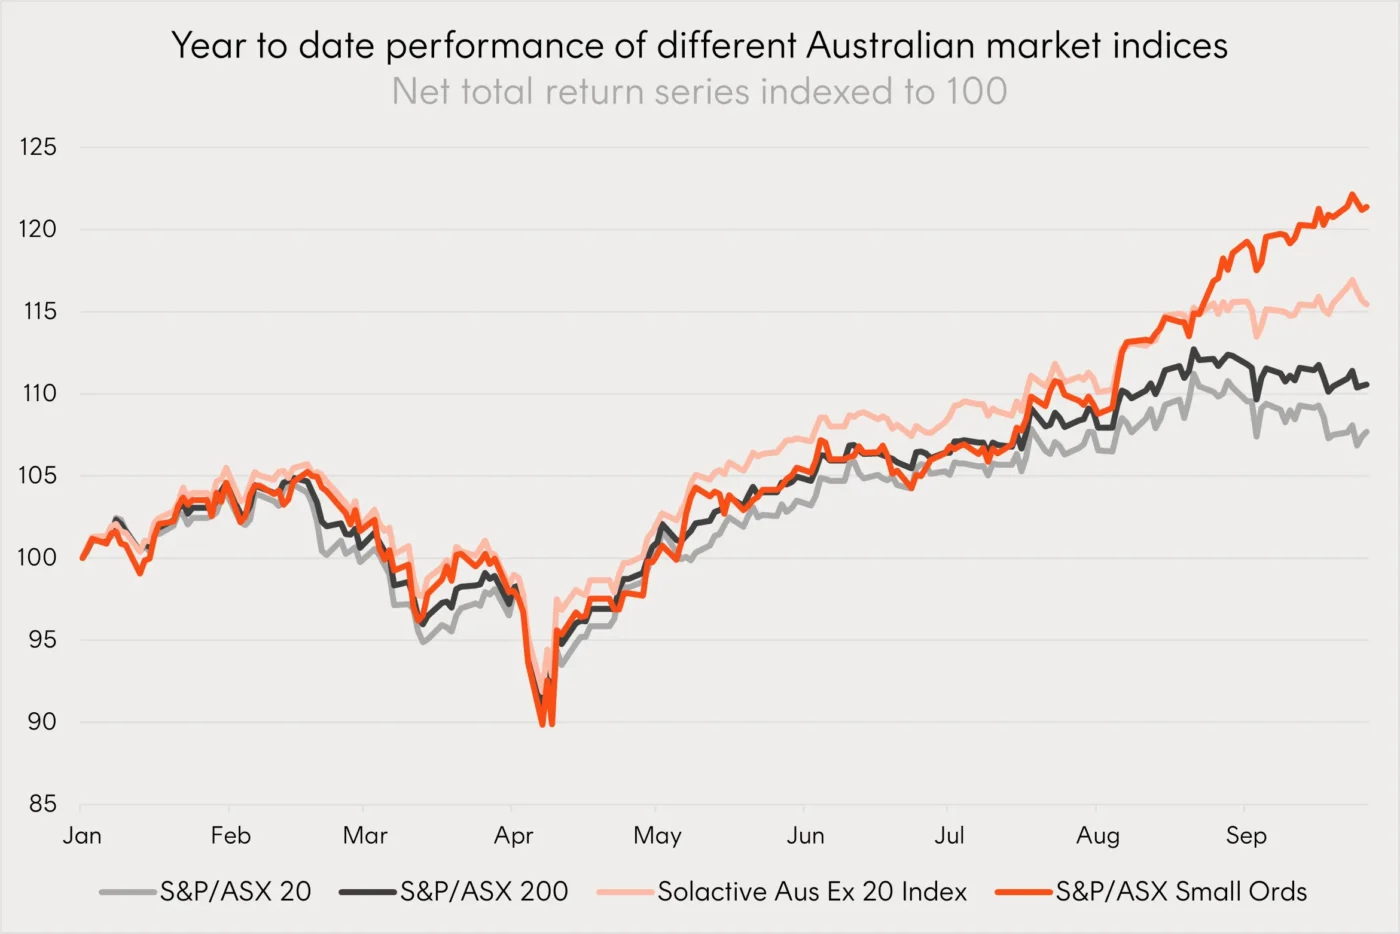
Source: Bloomberg. 1 Jan 2025 to 26 Sept 2025. You cannot invest directly in an index. Past performance is not an indicator of future performance.
3 – Gold miners join the rush
Gold mining ETFs, including Betashares Global Gold Miners Currency Hedged ETF (ASX: MNRS), have been amongst the best performing this year. In the past 2 months alone MNRS has returned 40% taking the year-to-date figure to 111%2.
The surging gold price, reaching all time high after all time high this year, has been headline news while the gold miners may have been largely underappreciated. Trading on low valuations and operationally leveraged to the higher gold price gold miners may continue to benefit it gold holds its current levels. Structural support for the gold price has come from global central bank buying, with gold holdings as a percentage of international reserves now higher than US treasury holdings.
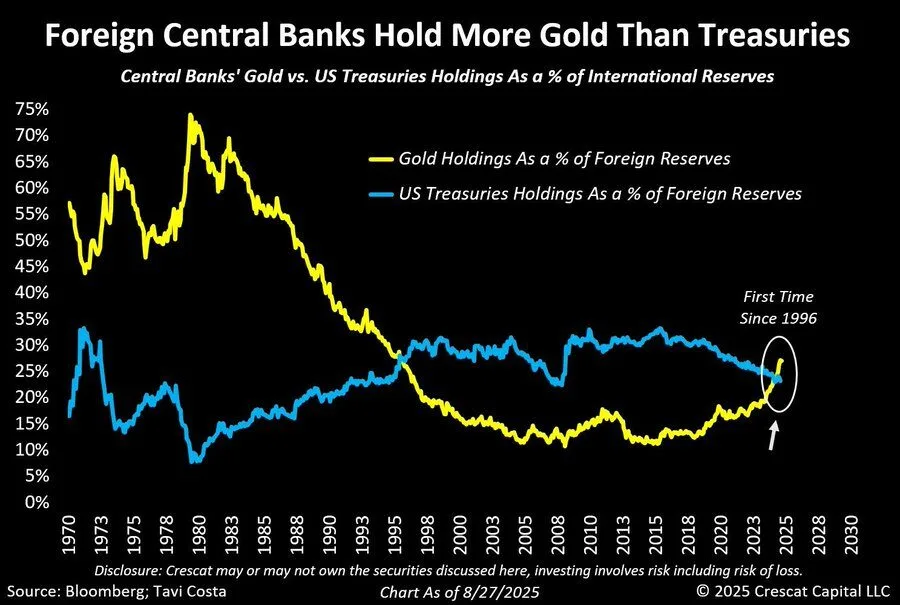
Source: Bloomberg; Tavi Costa, Crescat Capital. As at 27 August 2025.
4 – Mind the gap for Asian tech
Asian technology companies, as measured by Betashares Asian Technology Tigers ETF (ASX: ASIA), have also continued their strong run having returned 42% over the past 12 months3
A key investment case for Asian technology companies continuing to outperform is their low valuations compared to US tech counterparts. The big US tech companies have arguably justified their high valuations through a decade of consistent strong earnings growth – their Asian counterparts have some catching up to do here. Nevertheless, starting from a lower base, if Asian technology can continue to show promise there is still plenty of room to catch up to the valuation premiums offered to technology companies in the US and elsewhere.
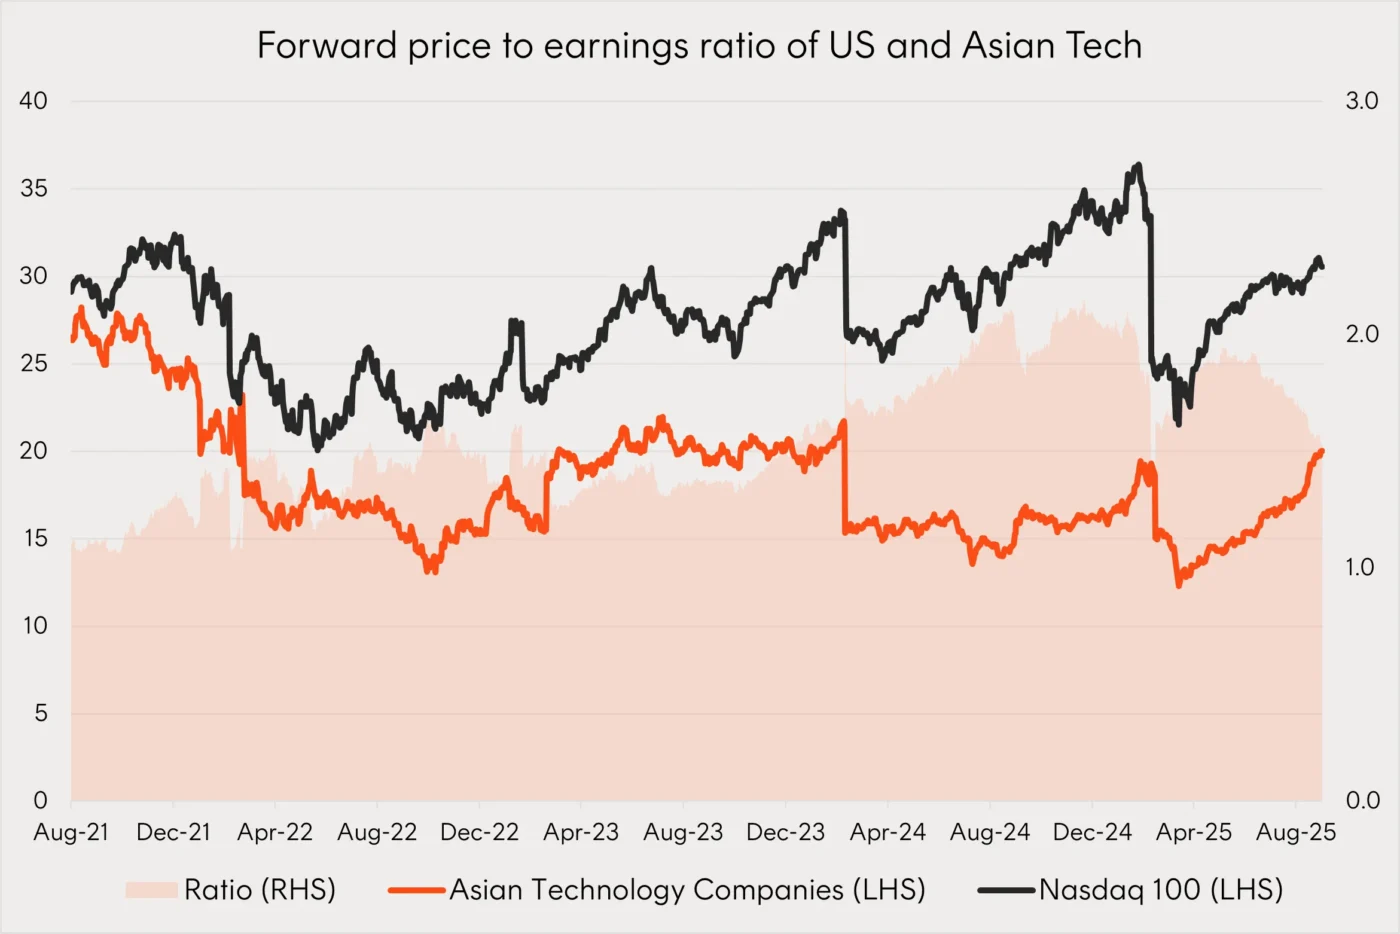
Source: Bloomberg. August 2021 to September 2025. Asian Technology Companies represented by the Solactive Asia Ex-Japan Technology & Internet Tigers Index. Past performance is not an indicator of future performance.
That’s all for this edition of Charts of the Month. For more investment and market insights, visit the Betashares Insights page here.
Investing involves risk. The value of an investment can go down as well as up. An investment in each Betashares fund should only be considered as part of a broader portfolio, taking into account an investor’s particular circumstances, including their tolerance for risk. For more information on the risks and other features of each Betashares fund, please see the relevant Product Disclosure Statement and Target Market Determination, available at www.betashares.com.au.
Sources:
1. Source: Bloomberg. 1948 to 2025. ↑
2. As at 29 August 2025. Past performance is not an indicator of future performance. ↑
3. As at 29 August 2025. Past performance is not an indicator of future performance. ↑