

Chamath De Silva
9 minutes reading time
- Fixed income, cash & hybrids
What really matters for US rates?
As we enter the second half of 2025, bond markets find themselves at an interesting juncture. Central banks globally are well into their easing cycles, yet long-term yields remain elevated. For Australian investors, this creates opportunities, particularly with further rate cuts on the horizon and yield curves now quite steep. A good place to start is US rates and the US economy, which will largely set the broader tone for global and Australian bond markets. The coming months will no doubt bring its share of headlines – from the ongoing trade negotiations to the anticipation of a new Fed Chair when Powell’s term expires next year. But for bond investors, it’s ultimately the US labour market that will dictate the overall direction.
Since the start of the year, fed funds futures have repriced in a more dovish direction, with around 100 basis points of further cuts priced over the next 12 months. The temptation is to connect this shift to political factors – Trump’s public criticism of Powell and speculation about a more compliant successor when his term expires in May 2026. In reality, the dovish shift in market pricing can easily be explained by the weaker US labour data, such as declining job openings and a softer payroll report, including July’s large downward revision. Notably, despite all the speculation about Powell’s replacement and potential political pressure for aggressive easing, markets aren’t pricing any “monster cut” for the June 2026 FOMC meeting (the first with the new Chair).
While it’s possible that the next Chair might tilt the dual mandate’s balance toward supporting employment over fighting inflation, the composition of the broader Committee won’t change that much over the medium term, and we’d likely see a response if inflation were to sustainably re-accelerate. It’s this persistence of two-sided inflation risks that suggest while the front end of the curve may be anchored be a softer labour market and a Fed that will look to get back towards a “neutral” policy setting fairly quickly, longer-term yields are unlikely to collapse unless the US enters a recession, putting a floor under 10-year Treasuries even as the Fed continues to ease.
Chart 1: Fed Funds Futures curve and evolution of market pricing since 31-Dec-2024
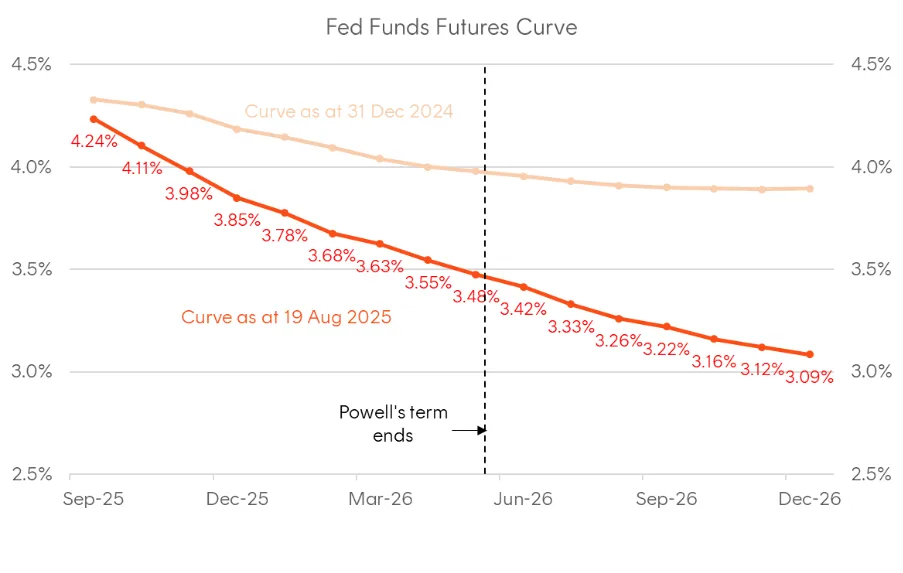 Sources: Bloomberg, CME; As at 19 August 2025
Chart 2: US Treasury curve and year-to-date evolution
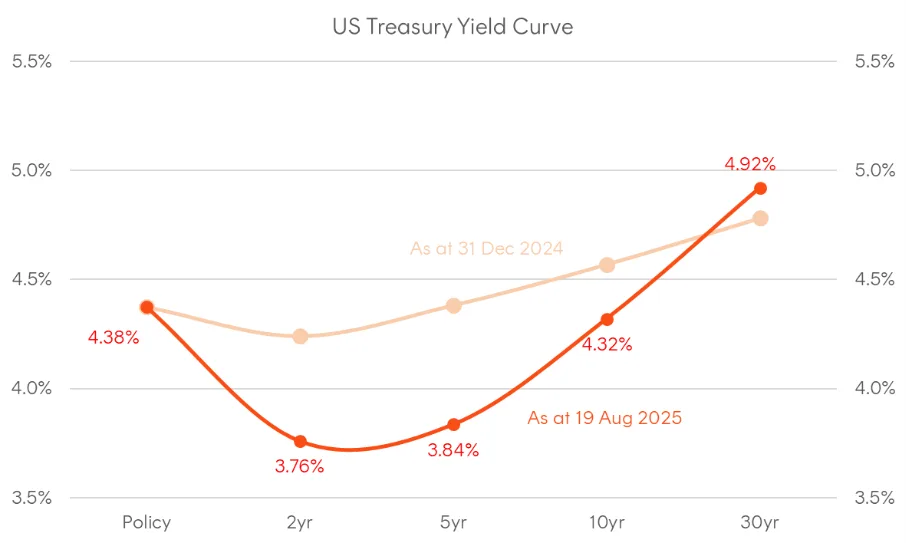 Sources: Bloomberg; Fed; As at 19 August 2025
Lower policy rates, steeper curves, and what’s priced in over the (very) long-term
With rate cutting cycles well progressed across much of the developed world, it’s interesting to see long-term yields are still around decade highs. The Fed, ECB and Bank of England have all cut rates between 100 and 200 basis points this cycle, yet 30-year yields have generally risen, with UK gilt yields around their highest levels in over 25 years. This steepening in global yield curves tells us something very important about what markets are pricing in. What’s embedded in every yield curve is also a forward curve, meaning that not only do we know the interest rates for various maturities today, but also what markets are pricing in for rates in the future.
Chart 3: Range of selected policy rates and 30-year sovereign yields over the past 10 years
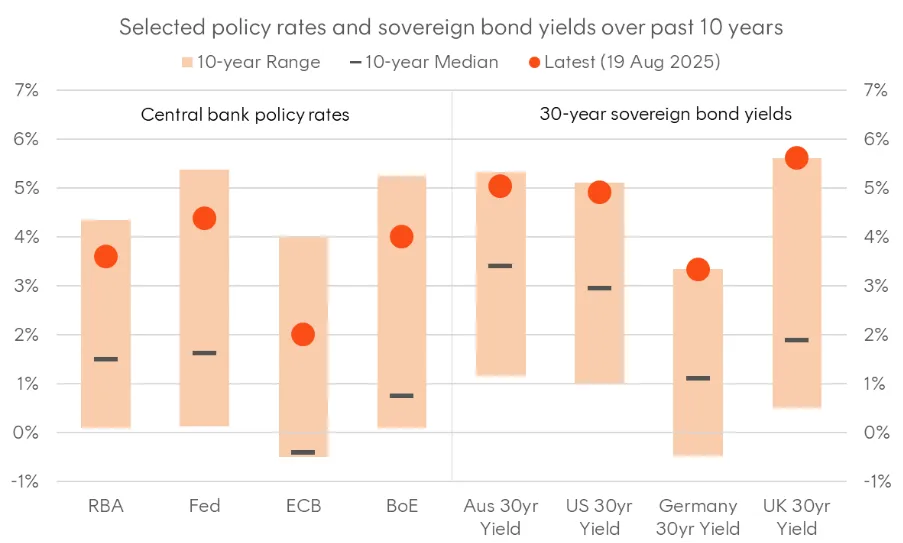
Sources: Bloomberg, RBA, BoE, Fed, ECB; Between 19 August 2024 and 19 August 2025
Looking at nominal curves for Australia, the US, and the UK, we see 10-year/10-year forward yields are arguably at extreme levels. This is the market’s pricing of 10-year yields in 10 years’ time, implied by the levels 10-year and 20-year yields. For Australia and the US, this measure is hovering between 5.5%-6.0%, while for the UK it’s around 6.5%. By this metric, UK government bonds have experienced the most aggressive repricing anywhere in the global fixed income universe.
There are several factors potentially driving this, including fiscal concerns – especially for the US and UK, perceptions of greater inflation risks over the long-term, and perhaps a less favourable view of sovereign bonds as portfolio diversifiers. Another potential driver has been the normalisation of policy by the Bank of Japan (BoJ) as it adjusts to unusually high levels of inflation in Japan during post-pandemic period. While policy tightening so far has been gradual, the long-end of the Japanese Government Bond (JGB) market has been very quick to front-run what’s expected to be a prolonged period of rising rates and a major scaling back of BoJ purchases, with the 10y10y JGB yield just below 4%. Given Japan’s role as one of the world’s largest savings pools and largest holder of foreign fixed income, more attractive domestic yields will naturally motivate some degree of repatriation flows back into the JGB market, and this dynamic likely contributing to the broader steepening pressure across global yield curves.
Chart 4: Implied 10-year/10-year forward yields implied from 10-year and 20-year sovereign yields
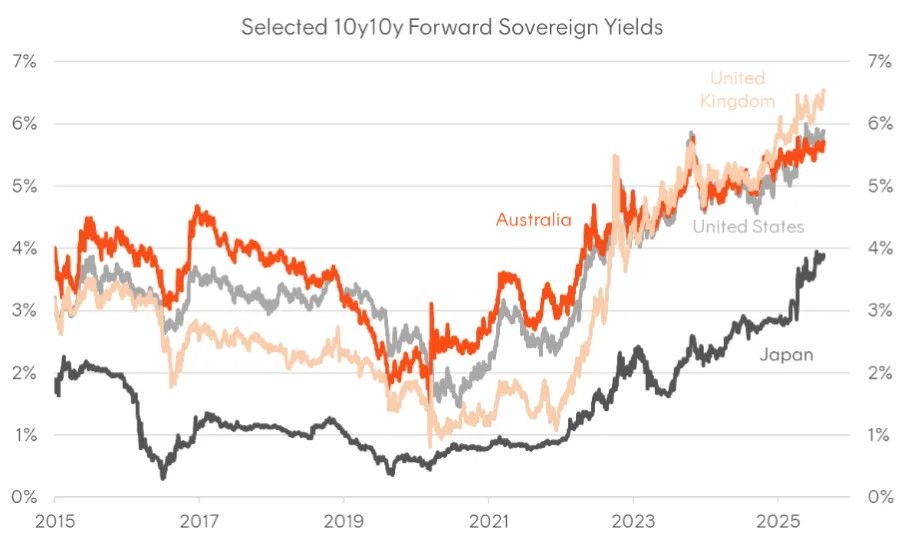 Source: Bloomberg; as at 19 August 2025
However, taking a step back, these adjustments arguably present significant value for long-term bonds. Most economists don’t believe that policy rates will average anywhere near those levels over the long run, assuming inflation remains broadly within target bands, which implies a generous risk premium for taking on duration.
Taking stock of the RBA’s easing cycle and where to find value in Australian bonds now?
After delivering 75 basis points of cuts this year, the RBA is guiding toward additional easing amid continued downward revisions to its forecasts, with market pricing suggesting the cash rate will reach 3% by early 2026. The most striking aspect of the Bank’s recent forecast revisions has been the significant downward adjustment to GDP and productivity growth estimates. While the RBA Governor has been careful to characterise the productivity downgrades as cyclical rather than structural in a recent press conference, the persistent weakness in productivity has become the dominant concern for policymakers. This will likely remain an ongoing challenge, given Australia’s unfavourable demographics and the absence of political will or mandate for major structural reform, meaning the RBA may be forced to progressively revise down its estimate of the real neutral rate. In this scenario, a “neutral” nominal cash rate might settle well below 3%, assuming inflation remains contained.
Chart 5: Policy rates and market-implied expectations
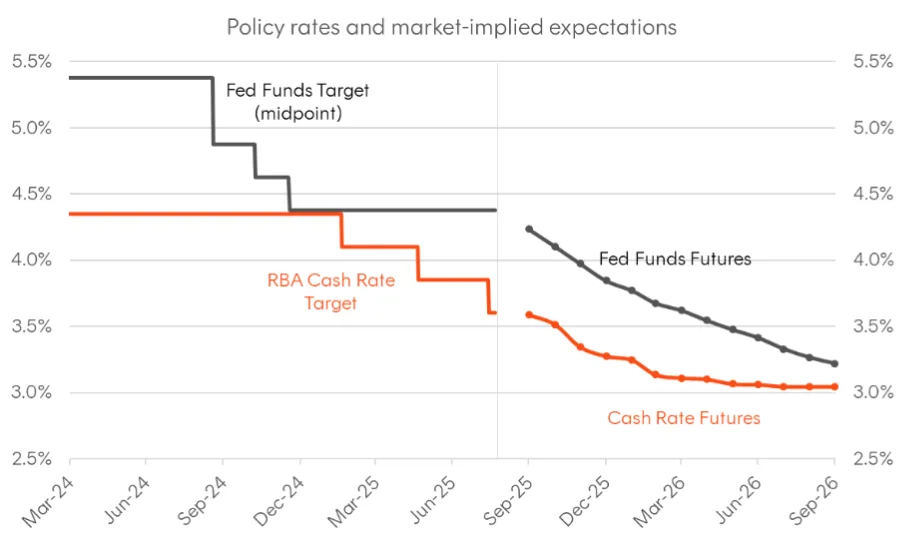 Sources: Bloomberg, RBA, Fed, CME, ASX. As at 19 August 2025
Yet despite front-end yields already reflecting this easing cycle, Australian fixed income markets are offering compelling value, especially further out the curve amid the global steepening impulse spillovers from weakness in long-term US Treasuries, UK Gilts, and JGBs. While the cash rate has fallen 75 basis points, the curve has “pivot steepened” rather than shifted uniformly lower. Short-end yields have declined as expected, but long-end yields have risen.
Chart 6: Year-to-date changes in Australian interest rates by maturity
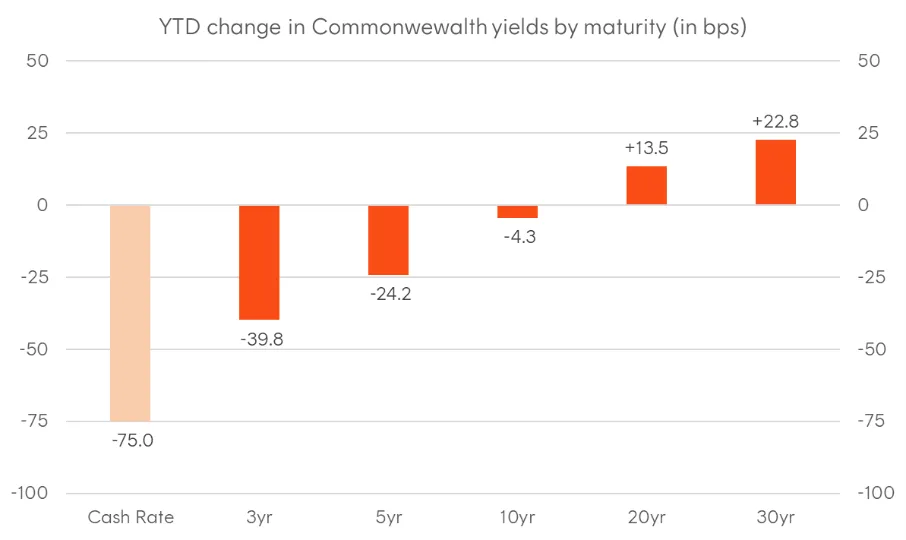 Source: Bloomberg, RBA. As at 19 August 2025
Because of this steepening, the 10-year Commonwealth government bond yield remains well above the current cash rate and sits significantly higher than where the cash rate is expected to be in twelve months’ time. This steep curve means investors can capture meaningful yield pickup and curve rolldown by extending duration – a particularly attractive proposition as the easing cycle progresses. The value also extends beyond just the shape of the curve. When viewed through the lens of swap spreads – a good metric for comparing relative value over time for different sectors, investment grade Australian bonds are trading at attractive levels relative to their 10-year ranges. Commonwealth bonds, state government securities, and supranational and agency paper all offer spreads that sit comfortably above their decade medians. As for corporate credit, although spreads are at the tighter end of the historical range, if the US economy can avoid a recession, we’re unlikely to see a catalyst for a major spread widening and corporate bonds keep outperforming.
Chart 7: Evolution of selected Australian interest rates; 1-year forward cash rate implied from cash rate futures
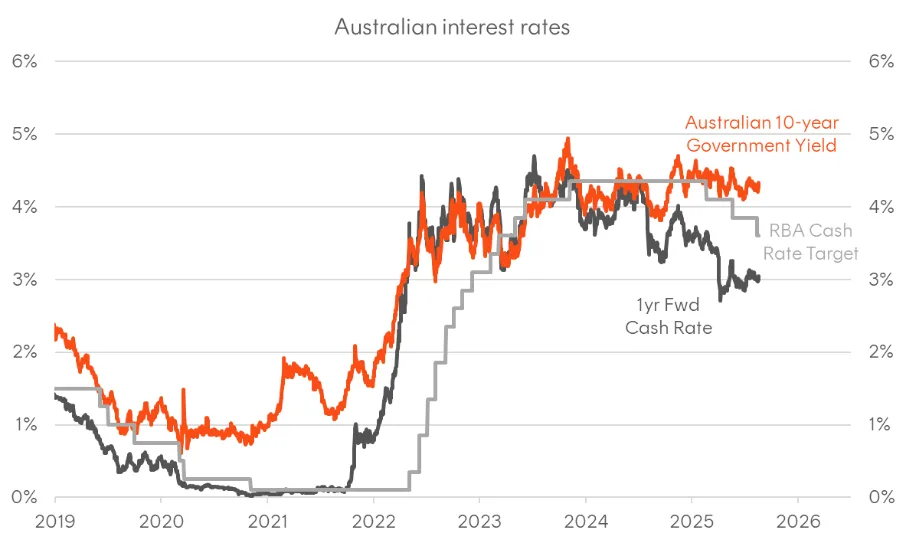 Sources: Bloomberg, ASX; As at 19 August 2025
Chart 8: Australian credit spreads vs swap (asset swap spreads) for various sectors; 5-10-year maturities. Based on relevant Bloomberg AusBond sub-index
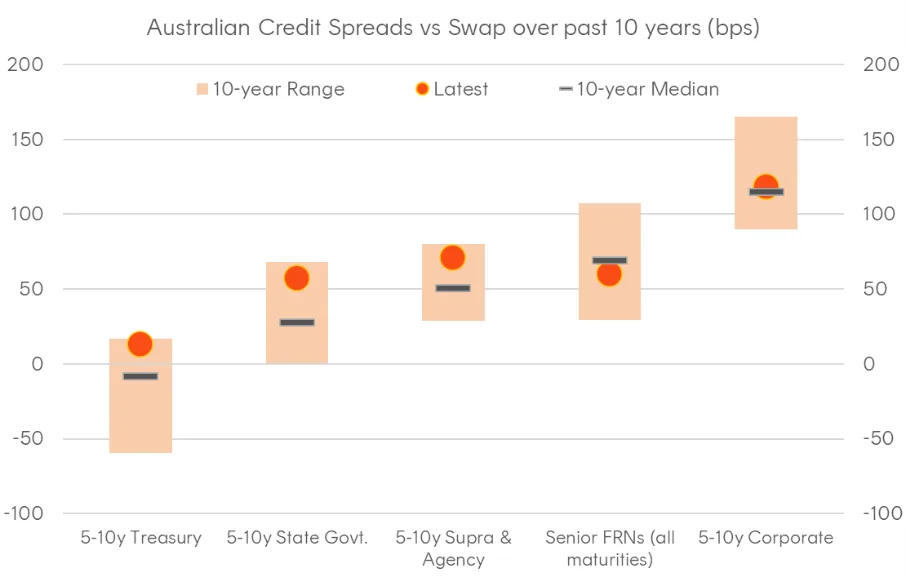 Source: Bloomberg; As at 19 August 2025
Key ETF ideas
The RBA recently guided towards further rate cuts on the back of some marginally dovish forecast revisions. Rate cuts generally provide a tailwind for duration, especially when the yield curve is at a steep starting point. The Australian long-end is well placed to perform well on the back of a combination of carry, rolldown, and increasingly, portfolio insurance amid extended equity valuations and a structural growth picture for the Australian economy that’s looking increasingly suspect.
- OZBD Australian Composite Bond ETF is designed to be a core portfolio allocation for fixed income. The portfolio is well diversified across Australian government and investment grade corporate fixed rate bonds benefitting from a constructive duration and credit outlook.
- OZBD provides investors the benefits of active management, but in a much more cost-effective package through rules-based, enhanced indexing (in partnership with Bloomberg), with a management fee of just 0.19%.
In corporate credit, while spreads remain towards the tighter end of their historical range, the absence of a US recession would limit the likelihood of a major widening. In that scenario, corporate bonds could continue to deliver relative outperformance.
- The underlying portfolio of HCRD Interest Rate Hedged Australian Investment Grade Corporate Bond ETF focuses on Australian 5–10-year investment grade corporate bonds, where we see outsized excess return potential (spreads and curve rolldown) relative to credit risk, whilst hedging out the main source of volatility – being the interest rate risk.
- Since inception HCRD has been a top performer in its Australian investment grade credit income peer group returning, on average, 9.4% p.a.1
As at 31 July 2025. HCRD’s inception date was 14 November 2025. Past performance is not an indicator of future performance. ↑