

Same hedge, different tax outcome: one key consideration when comparing global bond ETFs

Chamath De Silva
10 minutes reading time
Related articles

This information is for the use of licensed financial advisers and other wholesale clients only.
Commentary from the Betashares portfolio management desk by Head of Fixed Income Chamath De Silva, providing an overview on fixed income markets.
- Powell delivered what the doves want in the short-term, but is there a hawkish twist over the horizon?
- Japan hikes for the first time in 17 years and finally leaves negative rates behind, but will normalisation be short-lived?
- Credit spreads are tight but could tighten further still.
The US neutral rate revisited
With the BoJ, RBA, and the FOMC out of the way and quarter-end rapidly approaching, it’s a good time for another bond market update. While there’s a fair bit to talk about, I’ll start with what I think is the most notable development from last week’s otherwise dovish FOMC: the upward revision to the long run ‘dot plot’ estimate, the first such move since 2018.
Although much of the attention and price action focused on Powell’s rhetoric regarding rate cuts (still on the cards to start in June) and the balance sheet (the pace of the run-off likely to slow), the upgrade of the FOMC’s long-run fed funds rate estimate (to 2.625% from 2.50% previously) may possibly be the most impactful. It’s the first clear admission from an official policy release that the Committee is entertaining the idea of a higher neutral rate than 2.5% in the post-covid environment. As I’ve said before, if we expect a soft landing, then it’s evidence that the US economy is structurally stronger today than in the pre-COVID years, necessitating a higher real neutral rate.
We can think about the neutral rate at the level of policy where the economy is operating at trend, inflation is at target, and the labour market is consistent with full employment. It’s also a situation where bond investors demand some term premium for exposure to duration, and the curve is upward sloping (given, at a neutral policy setting, we shouldn’t have cuts priced into forward rates). Assuming the inflation target remains around 2%, then we should, at a minimum, be expecting a neutral real rate of 1%, bringing us closer to 3% as the baseline policy rate. In addition, at a ‘neutral’ policy setting, we should expect the yield curve to be upward sloping, and history suggests that the 10-year Treasury yield should average around 150 basis points above the Fed Funds target, which points to 4.5% being fair value. Of course, it’s possible that the neutral real rate is higher than 1%, and right now the US economy is humming along above trend rates of growth with real policy rates and real yields closer to 2%. If the bond market eventually comes around to the view that the current stance of policy is not actually restrictive but accommodative, then the curve will need to steepen, and steepen aggressively.
In Australia, the RBA’s decision and press conference were both non-events to me, but last week’s very hot employment report, which included a drop in the unemployment rate to 3.7% (from 4.0%) has broken the recent trend of labour market weakness raises questions about where the neutral rate is here. We’re now almost two years into policy normalisation, and the “long and variable lags” should’ve mostly worked their way through to the household and corporate sectors. While our economy isn’t producing the same growth numbers as the US, the resilience of the household sector – seen as particularly vulnerable – has surprised on the upside, and it doesn’t seem that the RBA has a compelling reason to start cutting imminently, beyond currency considerations in the event the Fed eases.
Chart 1: Various estimates of the real US neutral rate
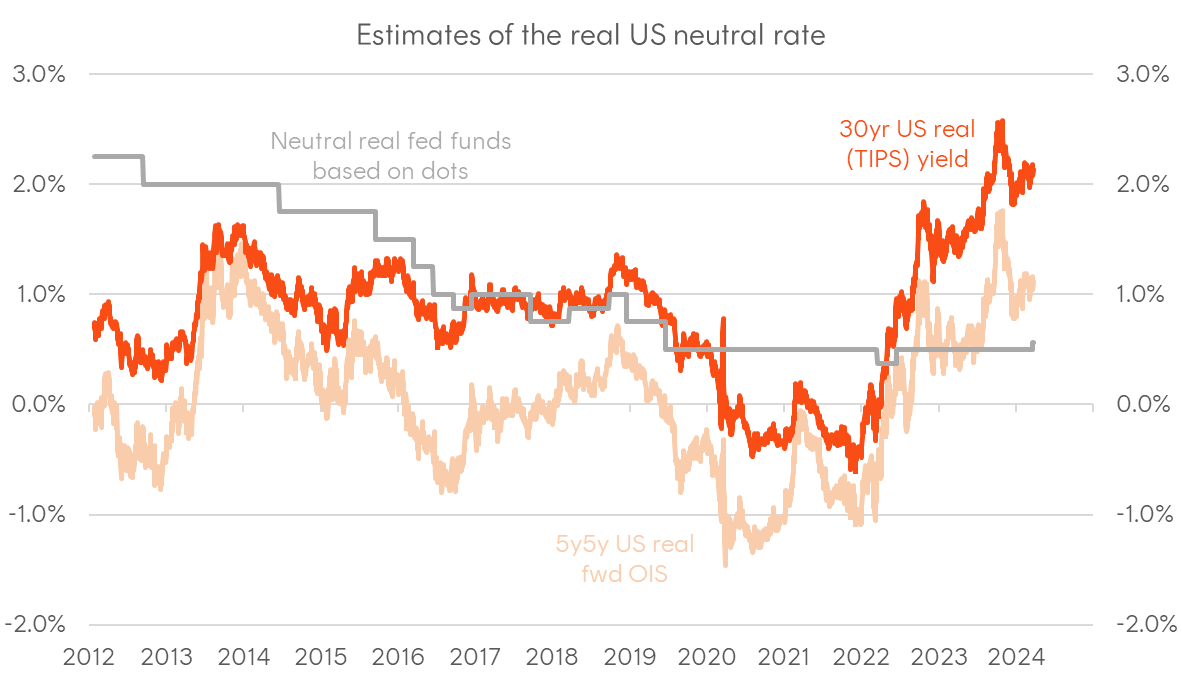
Sources: Bloomberg, Betashares. Median FOMC estimate of long-run fed funds rate minus 2% inflation target, 30-yr real yield on US TIPS; 5yr5yr forward overnight index (OIS) swap rate.
Chart 2: Measures of US inflation (year-on-year)
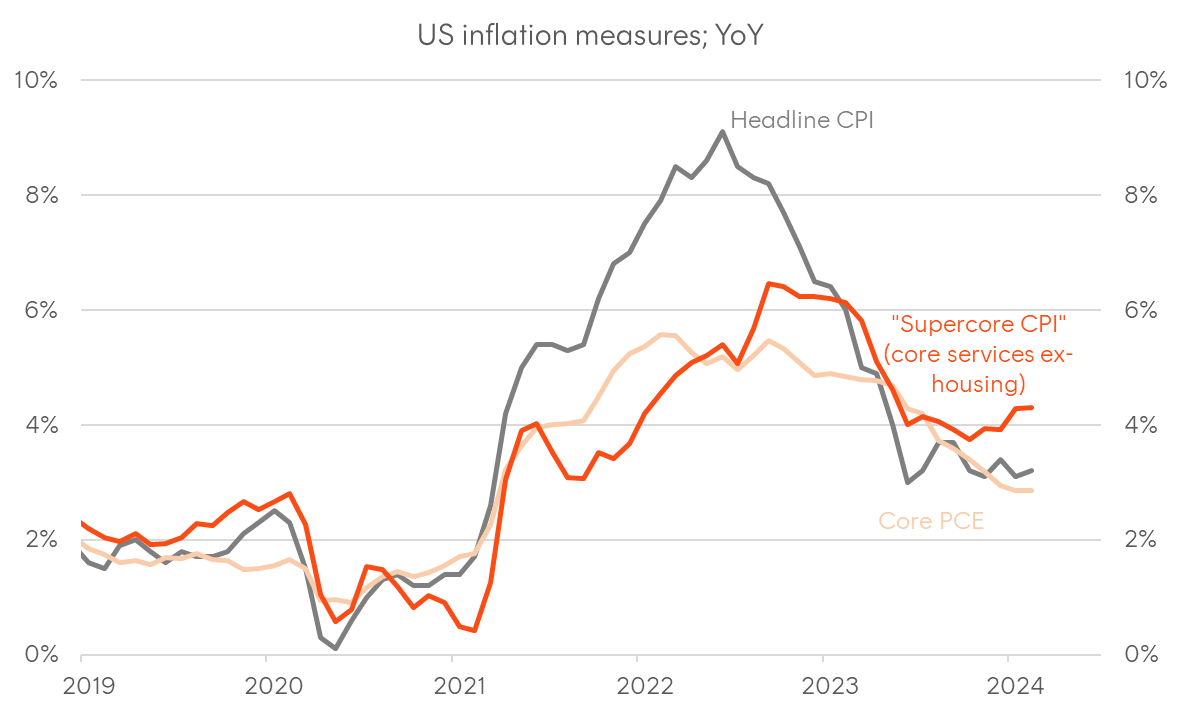
Sources: BEA, BLS, Bloomberg.
Chart 3: Citi Economic Surprise Indices
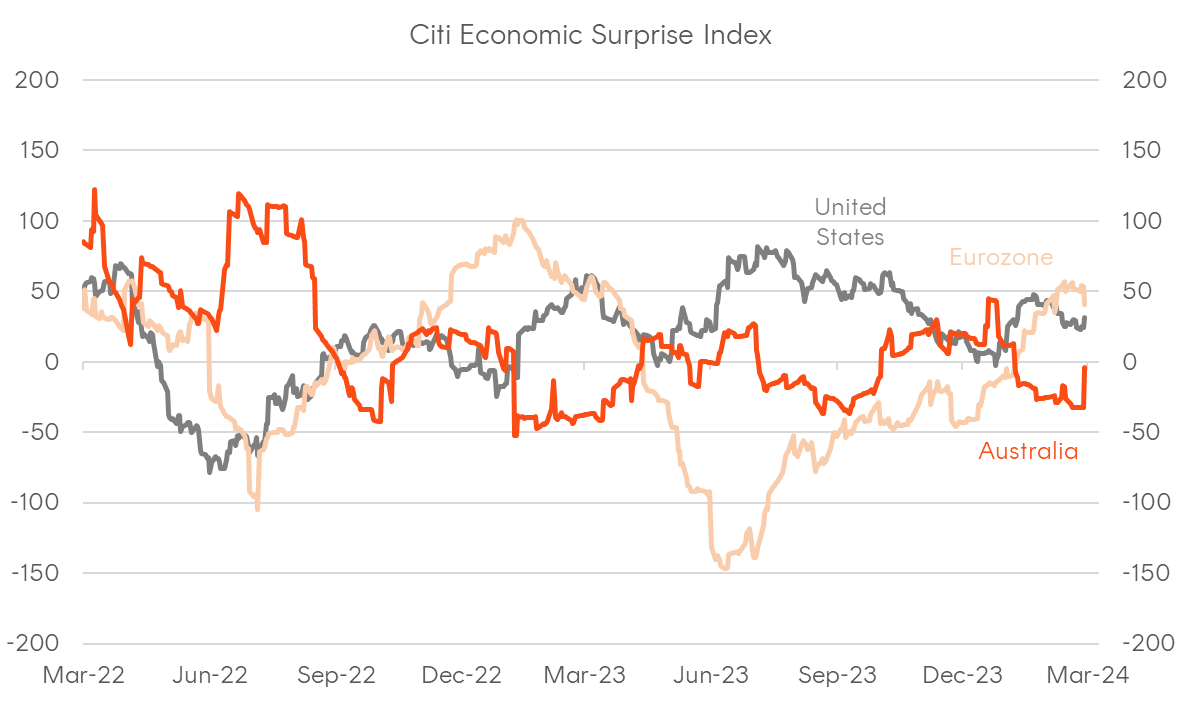
Source: Citi.
Is Japan leaving secular stagnation behind?
On the topic of the Bank of Japan’s (BoJ) first rate hike in 17 years last week (to +0.10% from -0.10% previously), I might start by contrasting it with Switzerland’s rate cut only two days later (to 1.5% from 1.75%), the first developed central bank to officially ease policy this cycle. Both Japan and Switzerland have been dealing with demographic challenges and deflationary pressures over the past 30 years, and both central banks were early adopters of negative interest rate policy (‘NIRP’). However, the post-COVID period has seen a pretty big divergence in both the relative stance of policy and their respective currencies, with the CHF/JPY around 60% higher from early 2020 levels, as the franc remained well supported on a combination of SNB hikes, the currency being a geopolitical haven, and experiencing relatively subdued inflation pressures, while the JPY was the funding currency de jure in a gigantic policy divergence trade and a crude oil importer against a backdrop of growing energy insecurity. The end of NIRP is highly symbolic, but is it really evidence of Japan finally leaving secular stagnation behind or just a counter-trend inflationary cycle driven by a more volatile global supply chain? Comparing inflation data across different regions in recent years points to Japan lagging European trends, which means further rate hikes from the BoJ might be limited.
On the BoJ decision itself, while the BoJ did announce an end to Yield Curve Control (YCC) and ETF and J-REIT purchases at its meeting —technically hawkish tilts—the market took it in its stride, with the yen remaining under pressure and Japanese equities buoyant. Price action suggests that either the normalisation will be slow, might end sometime soon, or even that rate normalisation is irrelevant while the BoJ keeps liquidity ample by maintaining the current pace of JGB purchases. As it stands, I personally feel we have the green light to remain constructive on Japanese assets hedged back to higher-yielding currencies, with hedging to AUD delivering almost 5% p.a. of positive carry via FX forwards. When the JPY sell-off unwinds, it will be dramatic, given how “cheap” the JPY appears on a PPP basis, but I see no sign of it over the immediate horizon while the BoJ keeps the liquidity taps open and a US recession gets pushed further into the future.
Chart 4: Japanese and Swiss CPI, year-on-year
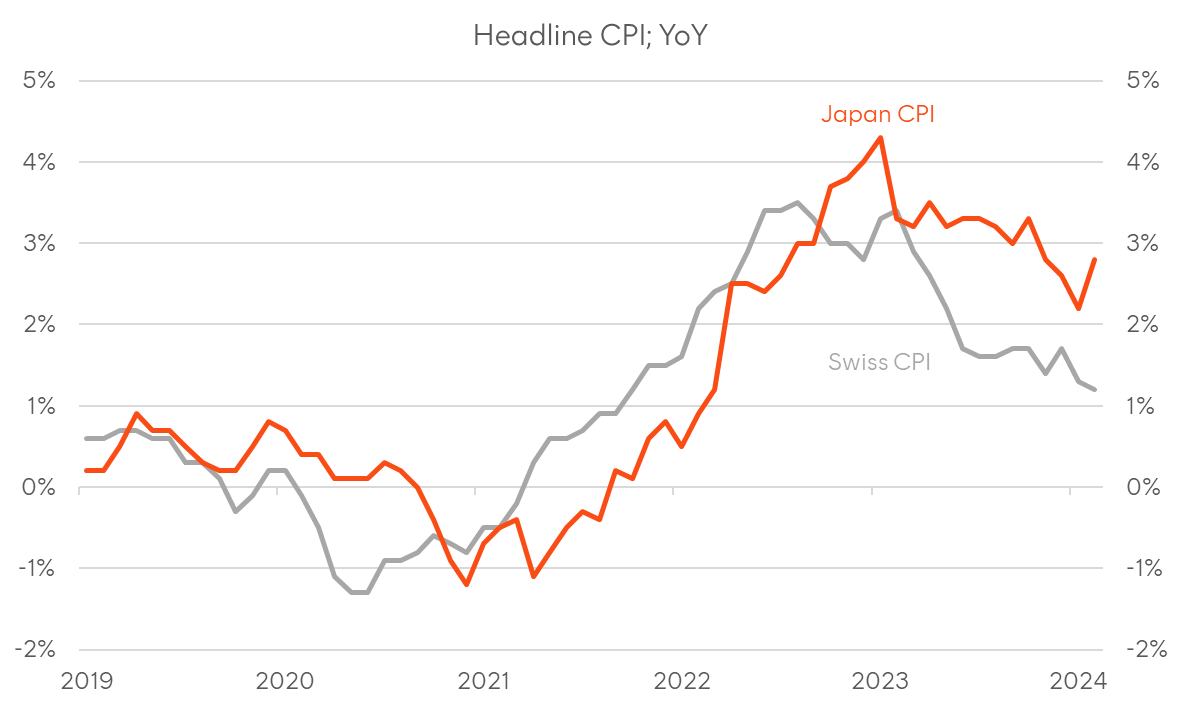
Sources: Federal Statistics Office of Switzerland, Ministry of Internal Affairs & Communication.
What’s happening in credit? 2021 redux
One of the major developments over the past 3-4 months has been the dramatic easing in market-based measures of US financial conditions. Such indices, like the one produced by Goldman Sachs—which take a combination of short and long-term rates, credit spreads, equity valuations, and the level of the broad USD—are pointing to the most accommodative conditions in 2 years. Bloomberg’s Financial Conditions Index, which takes a broader set of risk premia measures, is even approaching all-time accommodative levels. Given all this, it was interesting to see Powell clearly state in the FOMC Q&A that he sees policy as still being restrictive and doesn’t appear dissuaded in commencing a cutting cycle by the “animal spirits” clearly building across risk assets. It does beg the question, though… what measures of financial conditions are actually relevant in determining the Fed’s reaction function? They’re clearly not too concerned about risk assets currently. If we look at ‘real economy’ variants, like the Fed’s Senior Loan Officers’ Opinion Survey (SLOOS), it’s still hard to see a story of restrictive conditions there. In fact, outside of nominal and real yields, I’m struggling to find any indicators of financial conditions pointing to policy being restrictive, and arguably no better example is what’s going on in the primary market for corporate credit.
I recently heard the argument that in contrast to an inverted US yield curve being evidence of restrictive policy and a predictor of recession, it’s now potentially causing financial conditions to become (more) accommodative by incentivising debt financing. At present, the average yield on US investment-grade corporate bonds (5.29% at the time of writing) remains below the effective Fed funds rate, meaning large corporates can simply issue debt and reinvest the proceeds in money market securities and, in theory, could receive an EPS boost (assuming no change in the policy environment or bond market). This has given rise to a goldilocks environment for DCM desks where corporates are incentivised to issue debt, while investors that are focused on outright yields (rather than spreads) are still motivated to buy, which is helping spreads compress despite the supply backdrop.
Those who spend more time following US equities would noticed similarities with the mania in markets in early 2021, with even the IPO market finally coming back to life after a 2-year hiatus. While not exactly equivalent, credit markets are following a similar trajectory, with IG and HY spreads now back around cycle tights, with even the lowest quality and most recession-sensitive segment of junk bonds – CCC-rated credit—starting to outperform. Spreads in distressed and near-distressed debt are still much wider than the in early 2021, but it gives us a sense that the strength in credit markets could continue for some time, before valuations become egregiously silly, and the supply of new assets completely overwhelms demand. Until that time, we should expect strength in risk assets, including credit, to broaden out, and the equity markets that are relatively cheap to outperform.
One example is AUD senior IG credit, where spreads are trading well above USD equivalents—both vs swap and against the respective government curve. Part of the reason for the still-elevated spreads to Commonwealth government bonds was the widening in swap spreads during the RBA’s YCC program, which created artificial scarcity for government bonds vs synthetic forms of duration. In addition, yields in Australia were particularly volatile in the 2022/23 period, which pushed our local credit spreads wider as investors demanded a higher liquidity premium. With interest rate volatility likely to keep moderating and AUD swap spreads to keep compressing back towards the global norm of zero, I expect AUD IG credit to outperform most markets on a risk-adjusted basis.
Chart 5: Goldman Sachs US Financial Conditions Index
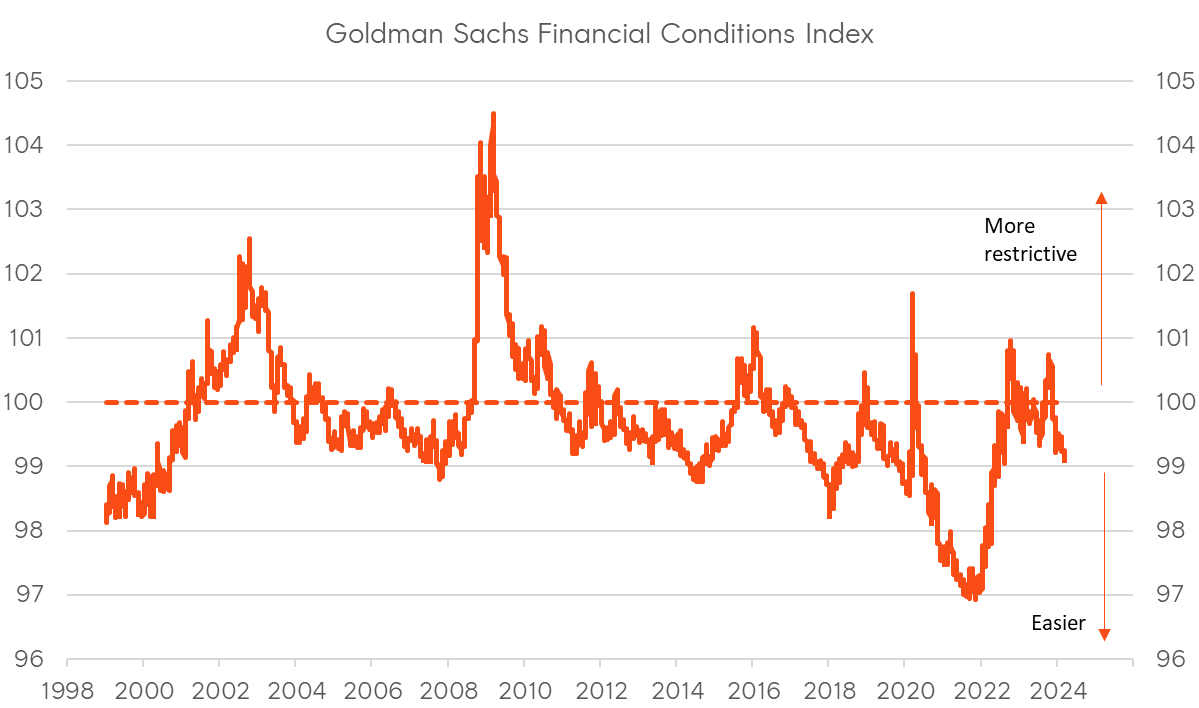
Source: GS.
Chart 6: US High Yield option-adjusted credit spreads (OAS)
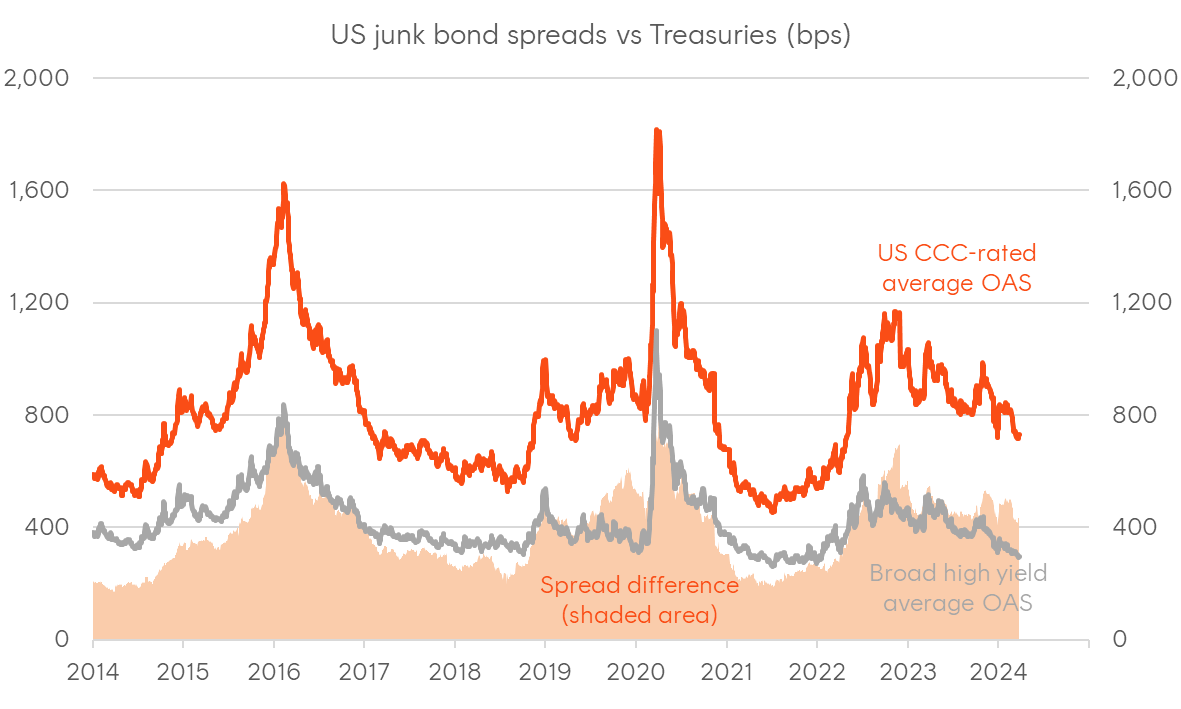
Source: Bloomberg.
Chart 7: Decomposition of AUD 5-10yr Corporate bond spread vs Govt
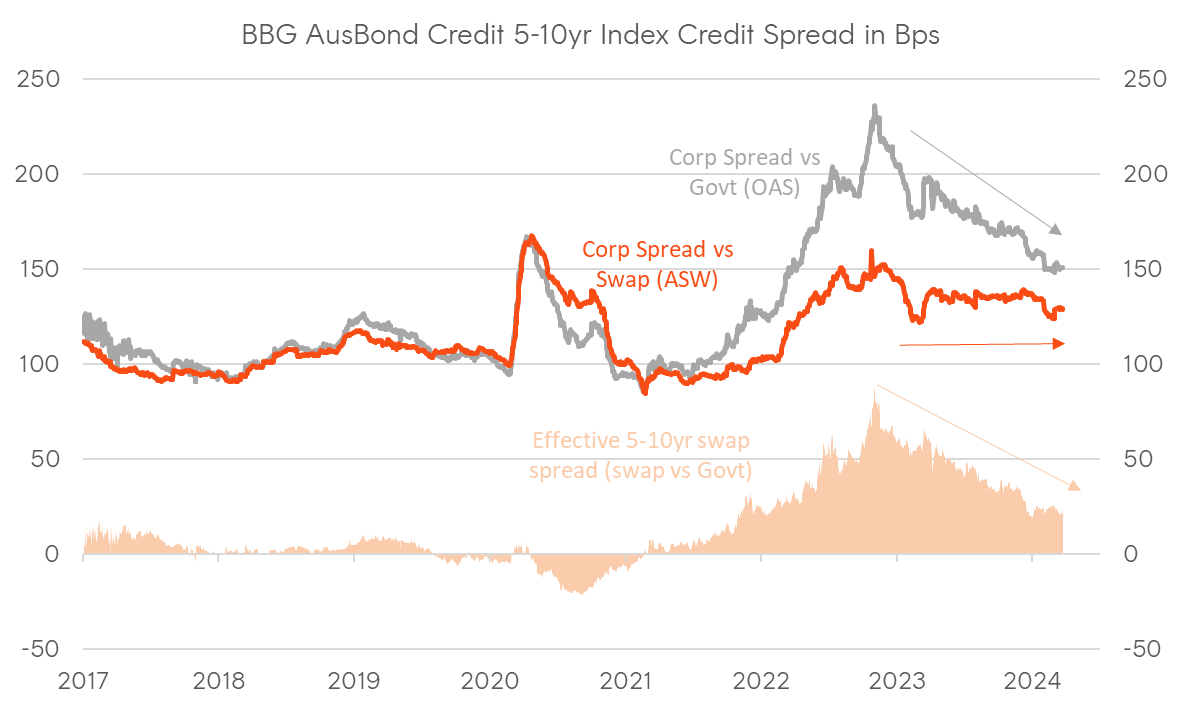
Sources: Bloomberg, Betashares.
Chart 8: AUD 5-10yr IG credit spreads vs US 5-10yr IG and US High Yield credit spreads;
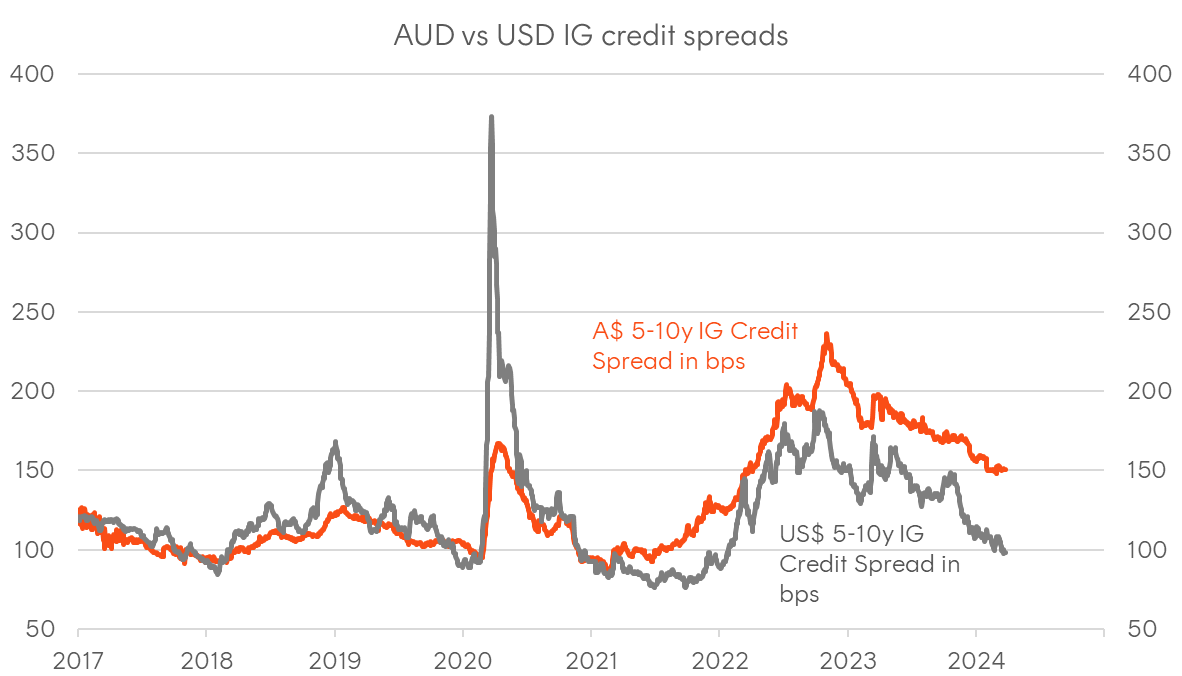
Sources: Bloomberg, Betashares.
Explore
Markets