

David Bassanese
7 minutes reading time
Major asset class performance
- Global equities continued to move higher in July, helped by further progress in US trade deals, a good Q2 US earnings season and still fairly resilient global economic growth. US-Iran military tensions have also evaporated for the time being.
- Australian equities also rose – broadly in line with global equities – despite disappointment over the failure of the Reserve Bank to cut the cash rate at the July policy meeting. A good Q2 CPI report, however, has markets now firmly believing in an August rate cut.
- Reflecting a small lift in global bond yields, global bond returns declined modestly while Australian bond returns were flat.
- Gold prices eased a little in July, reflecting a firmer US dollar and easing geopolitical and tariff-related risks.
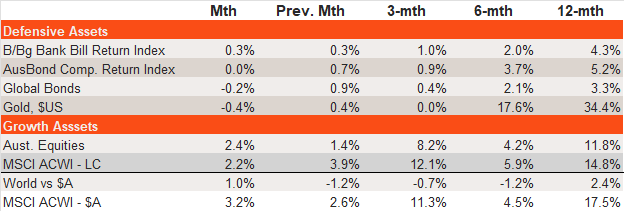
Source: Bloomberg, Betashares. Cash: Bloomberg Australian Bank Bill Index; Australian Bonds: Bloomberg AusBond Composite Index; Global Bonds: Bloomberg Global Aggregate Bond Index ($A hedged); Gold: Spot Gold Price in $US; Australian Equities: S&P/ASX 200 Index; Global Equities: MSCI All-Country World Index in local currency and $A currency (unhedged) terms. Past performance is not indicative of future performance.
Fixed-rate bond trends
- Local rate cut expectations eased back a little in July, although three rate cuts are still expected by end-2026. In the US, rate cut expectations also eased, although four rate cuts are still expected by end-2026.
- Local 10-year bond yields edged a little higher in July to 4.26%, although remain in the choppy sideways range that’s been evident since early 2024. With broadly steady bond yields, local fixed-rate bonds have marginally beaten cash over the past 6 and 12 months.
- The prospect of further rate cuts should lower bond yields and further boost bond returns relative to cash over the coming year.
- Local credit spreads narrowed further, unwinding the small increase earlier this year during the equity market correction – resulting in the resumption of corporate bond outperformance relative to government bonds.
- Easing economic risks bode well for a further narrowing in credit spreads even though they are now relatively tight by historical standards.
- The relative performance of local over global bonds remains in a choppy sideways range. The outlook for local versus global bonds remains relatively neutral.
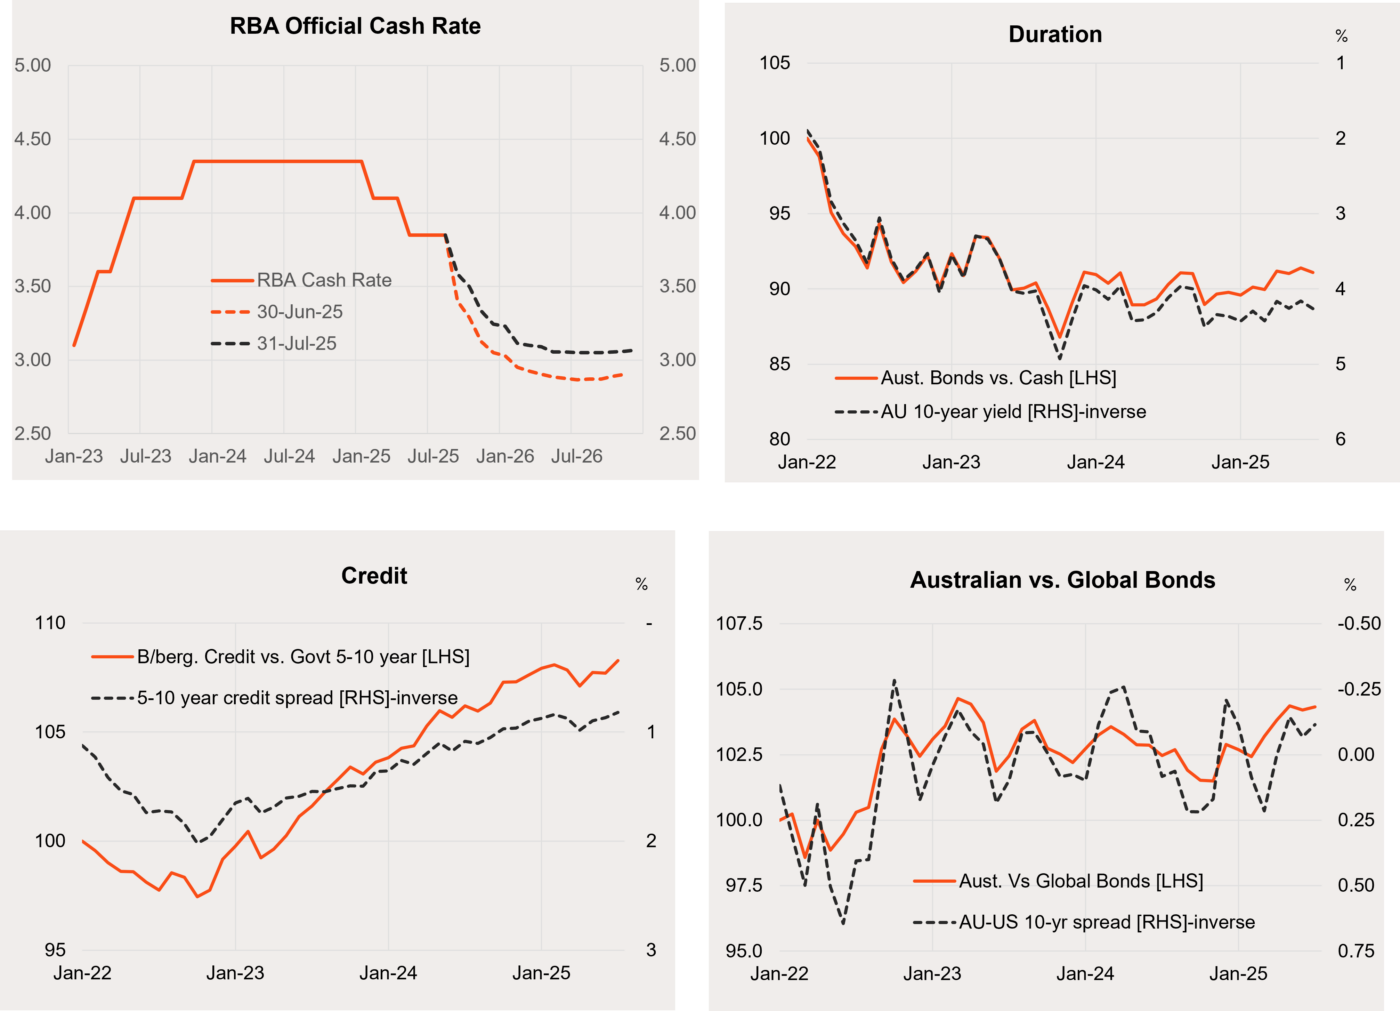
Source: Bloomberg, Betashares. Australian bonds: Bloomberg AusBond Composite Bond Index; Global Bonds: Bloomberg Global Aggregate Bond Index ($A hedged).
Global equity trends
- The MSCI All-World Price Index rose a further 2.1% in July – reaching a new end-month record high – after a solid 3.8% gain in June.
- After recent downgrades, earnings expectations for this year and next year stabilised somewhat in July, which allowed for a resumption of forward earnings growth. Current earnings expectations remain consistent with a solid 16% growth in forward earnings projected by end-2026.
- Valuations also edged higher in July, with the price-to-forward-earnings (P/E) ratio rising to a relatively high 18.9.
- With valuations still somewhat elevated, continued market gains are still possible, provided bond yields don’t rise much and/or the current bullish earnings outlook remains in place.
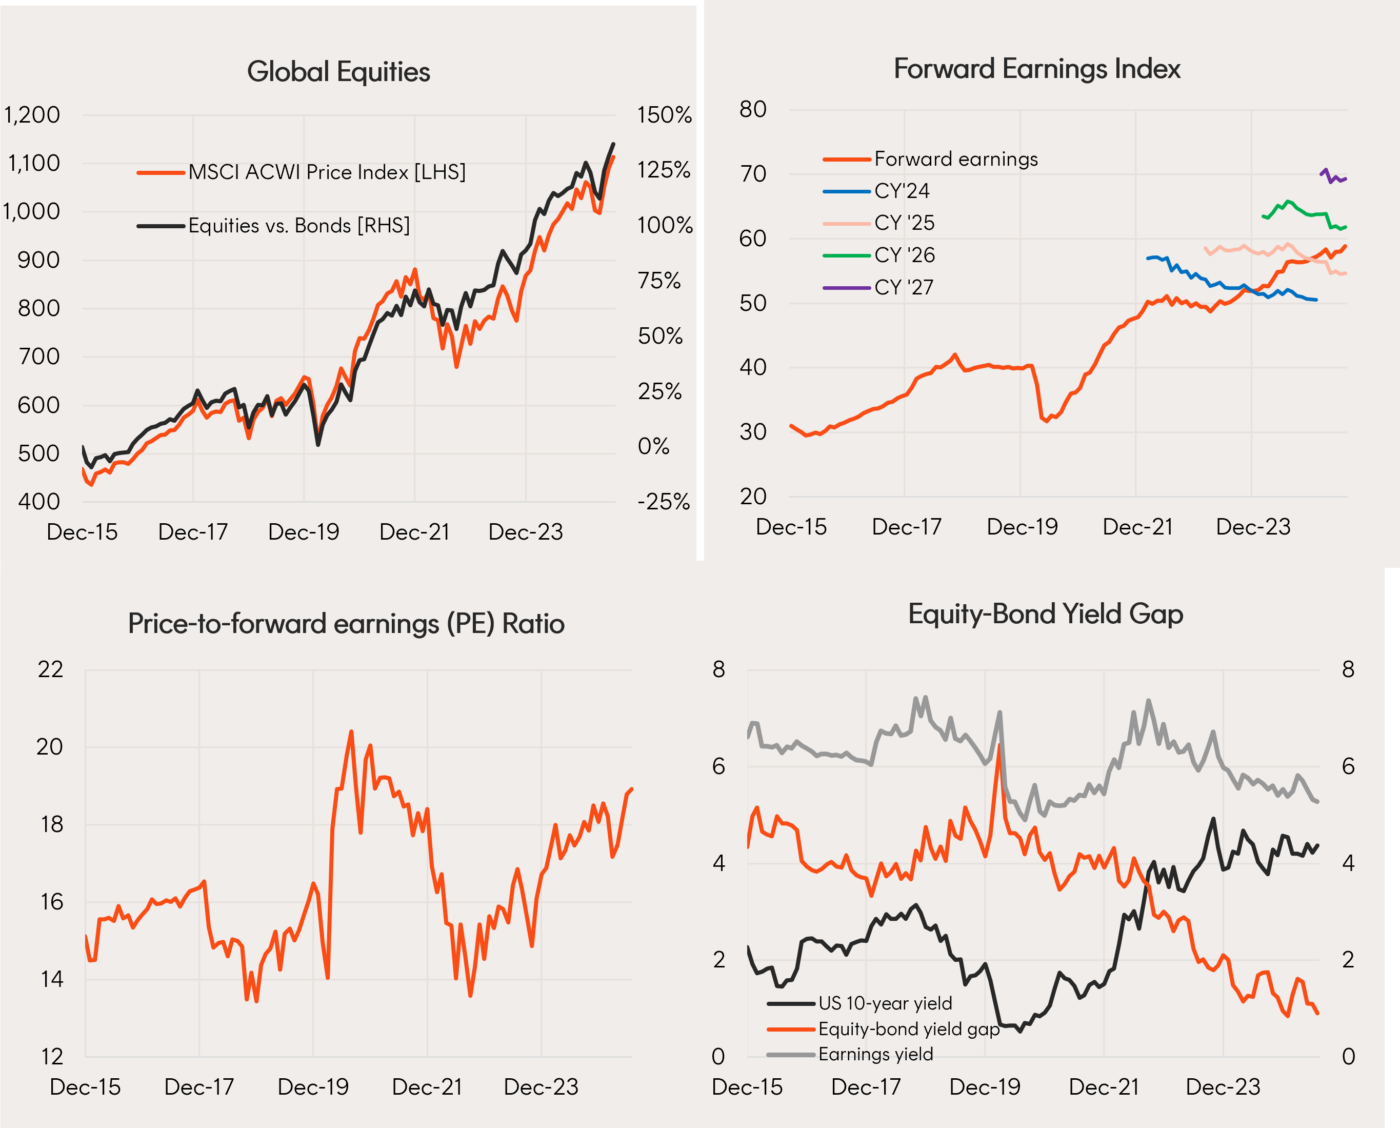
Source: Bloomberg, LSEG, Betashares. Global Equities: MSCI All-Country World Index. Global Bonds: Bloomberg Global Aggregate Bond Index ($A hedged). You cannot invest directly in an index. Past performance is not an indicator of future performance.
- Among select Betashares global equity ETFs, US technology HNDQ Nasdaq 100 Currency Hedged ETF has enjoyed a relative performance bounce in line with the market rebound in recent months. Financials – a key value sector – have continued to perform relatively well.
- By contrast, the strong relative performance of gold miners MNRS Global Gold Miners Currency Hedged ETF has since moderated somewhat, in line with the recent consolidation in gold prices.
- Healthcare DRUG Global Healthcare Currency Hedged ETF and quality (ASX: HQLT) remain in relative performance downtrends.
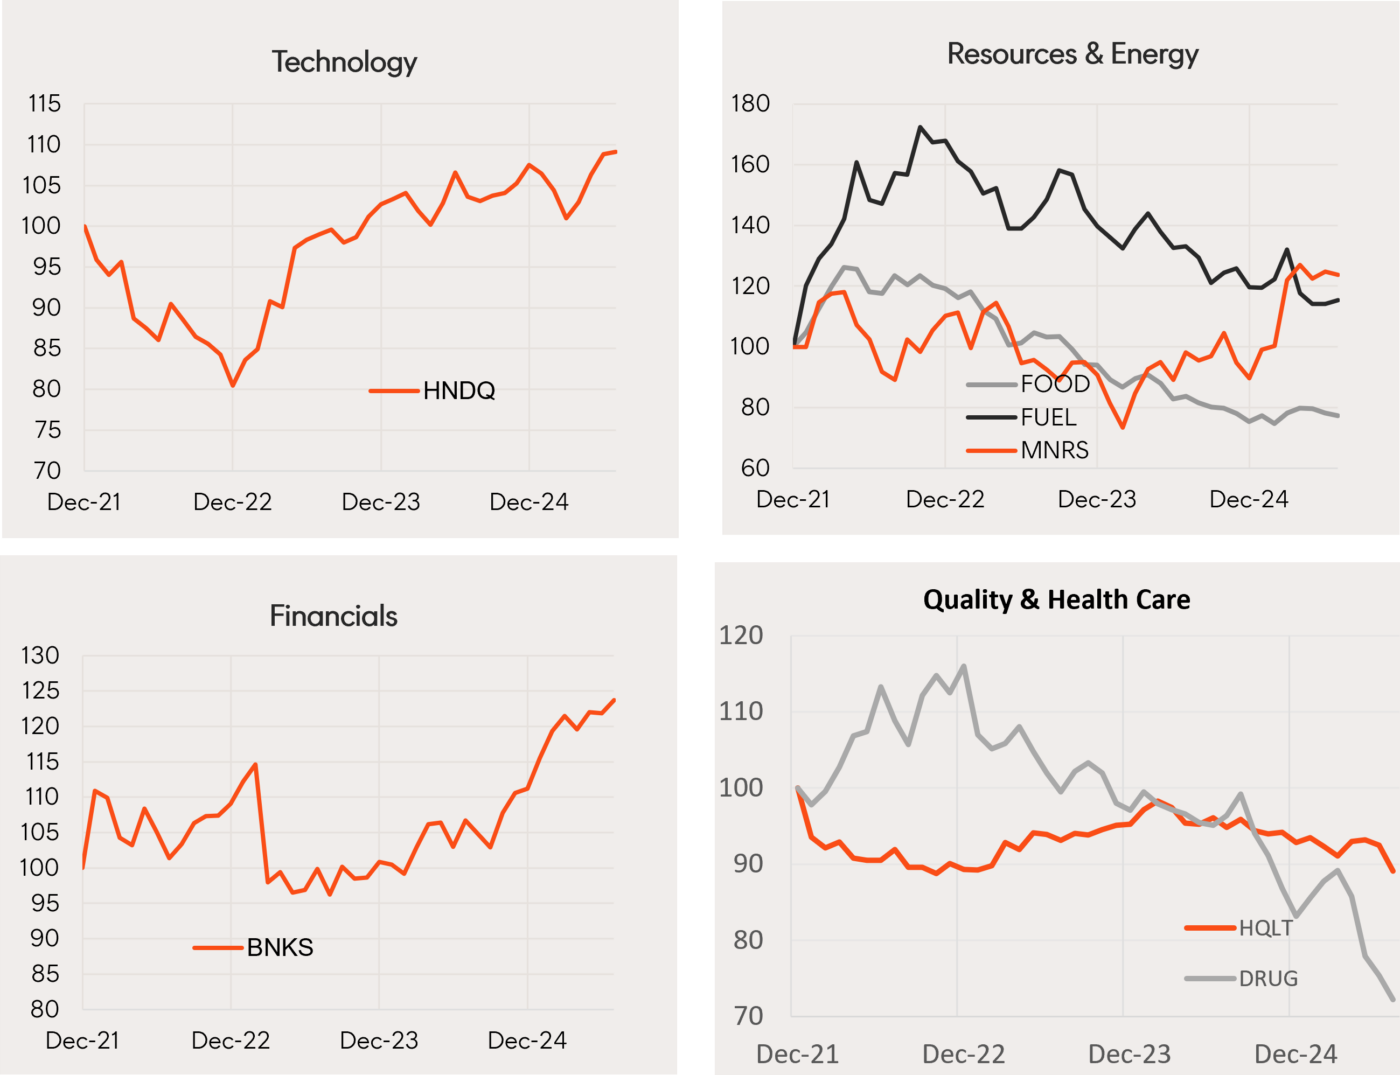
Source: Bloomberg, LSEG, Betashares. Relative performance versus the MSCI All-Country World Index (local currency terms) for the indices which the relative ETFs track. You cannot invest directly in an index. Past performance is not an indicator of future performance.
Australian dollar
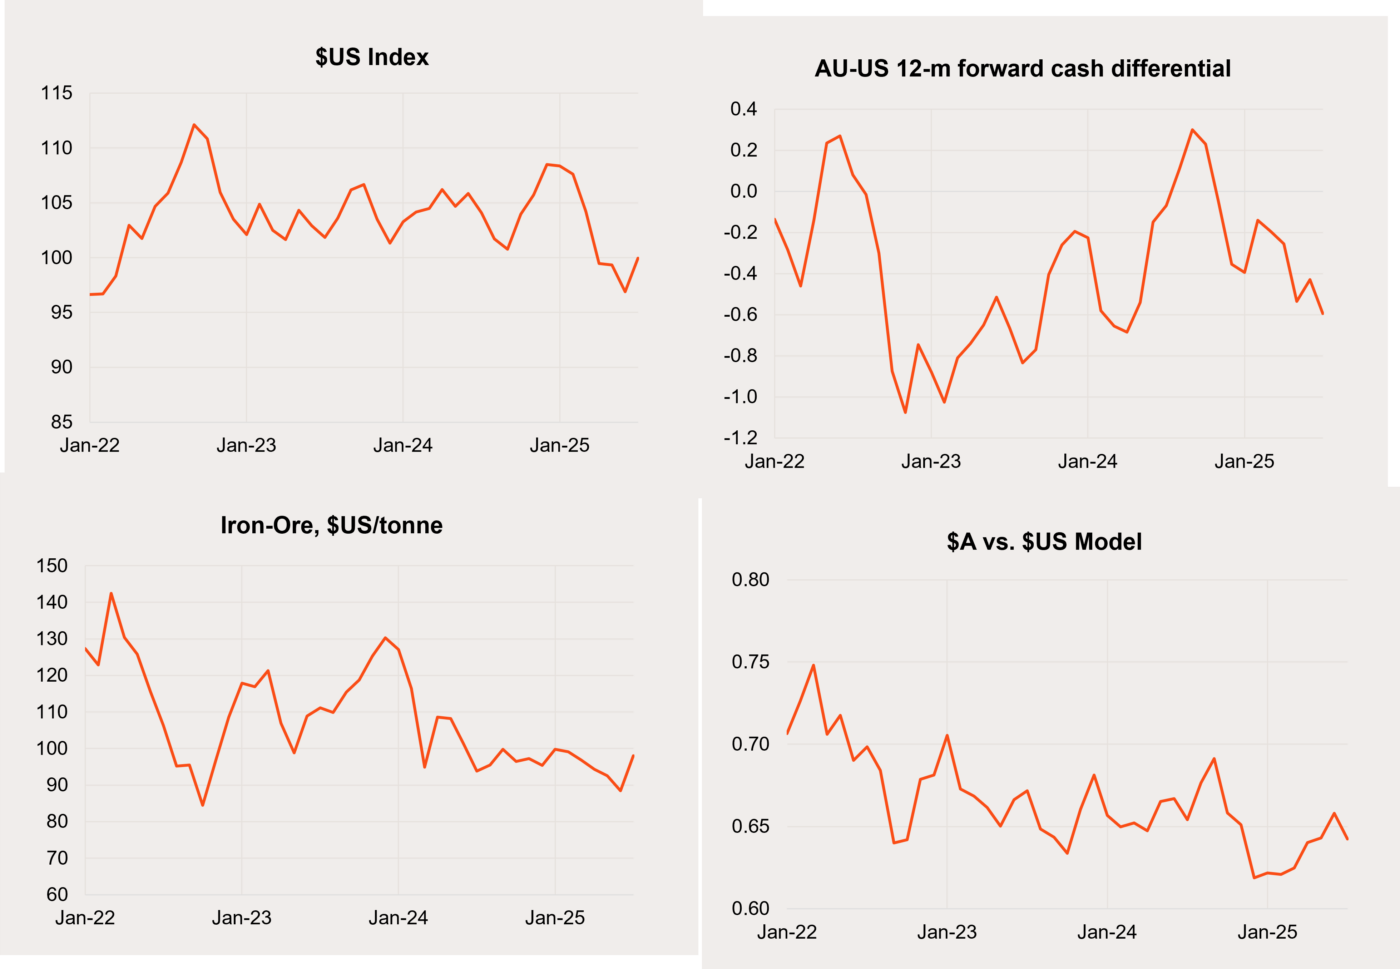
- The Australian dollar has been generally firm so far in 2025 despite a narrowing in short-term interest rate differential and easing iron ore prices. The main factor driving Australian dollar strength has been weakness in the US dollar – which in turn reflects Trump-related US economic uncertainty.
- The $A pulled back a little in July from US65.8c to US64.3c reflecting a bounce higher in the US dollar. After recent weakness, iron ore prices firmed in July reflecting some optimism around Chinese demand following the announcement of a major Chinese hydro-energy project.
- With tariff concerns easing, there is a risk of at least a short-run corrective rally in the US dollar in coming months. Bigger picture, however, the US dollar remains expensive based on long-run valuation metrics. This should favour a firmer Australian dollar over time.
Source: Bloomberg, LSEG, Betashares. Australian Equities: S&P/ASX 200 Index. Australian Bonds: Bloomberg AusBond Composite Index. You cannot invest directly in an index. Past performance is not an indicator of future performance.
Australian shares
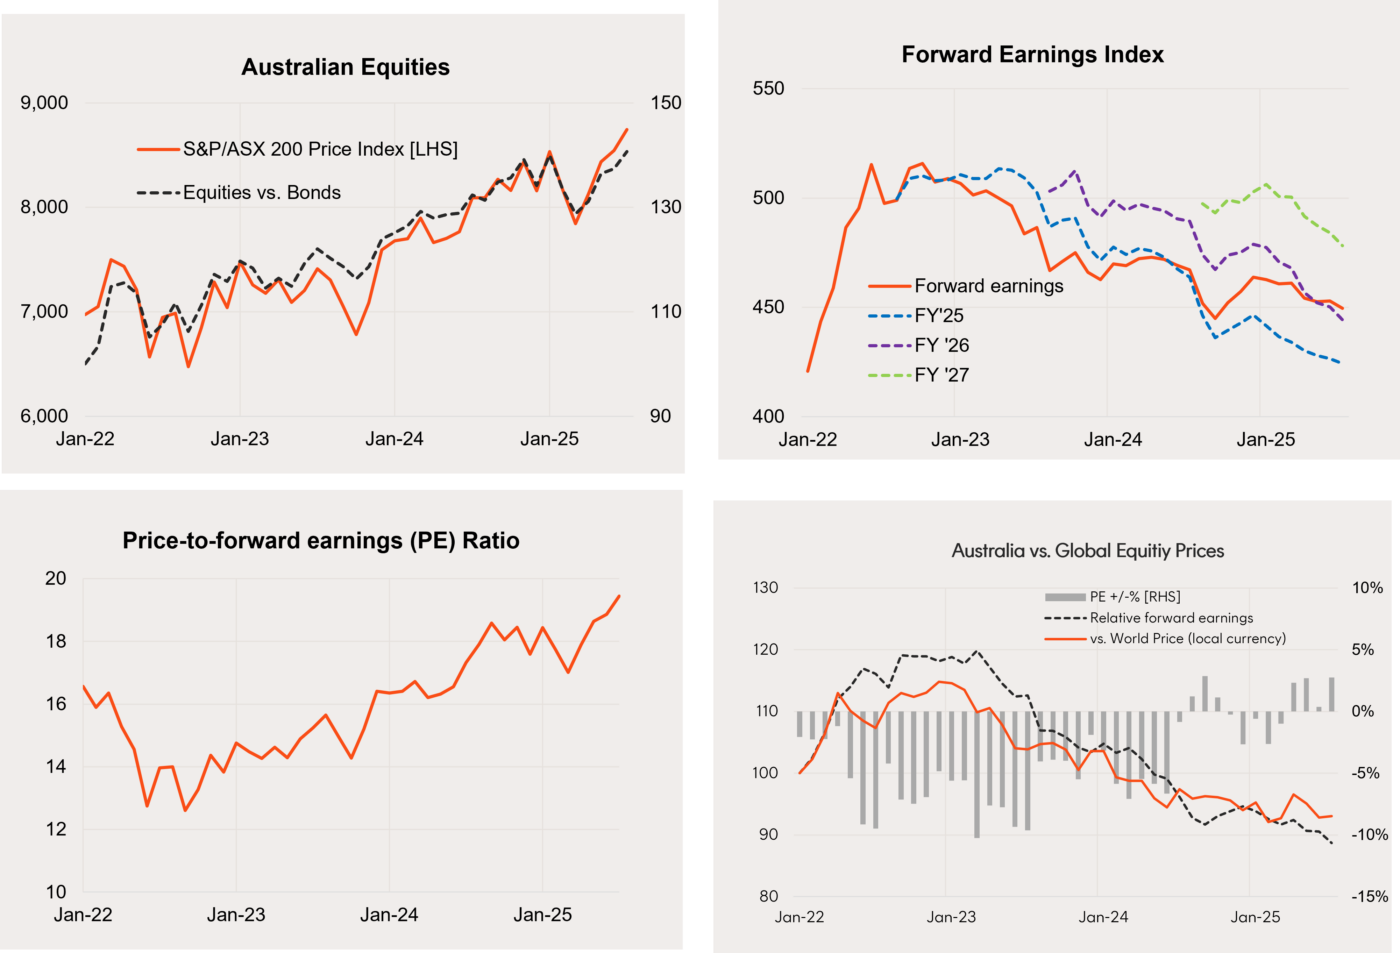
- The S&P/ASX 200 price index lifted a further 2.3% in July after a 1.3% gain in June.
- Further earnings downgrades led to a 0.8% decline in forward earnings in the month, though this was more than offset by a 3.1% gain in the the price-to-forward earnings (P/E) ratio, which is now at 19.4.
- As with global equities, Australian valuations are now above average. That said, Australian valuations have tended to average close to global valuations over the past decade or so and, with the global market on a P/E ratio of 18.9, Australian shares are neither overly expensive nor cheap by global standards.
- Current earnings expectations imply 6.4% growth in Australian forward earnings by mid-2026, which is less than the 11.6% expected for the overall global market. What’s more, Australian earnings expectations remain under downward pressure. Accordingly, Australian equities still seem likely to underperform global equities over the coming year.
Source: Bloomberg, LSEG, Betashares. Australian Equities: S&P/ASX 200 Index. Australian Bonds: Bloomberg AusBond Composite Index. You cannot invest directly in an index. Past performance is not an indicator of future performance.
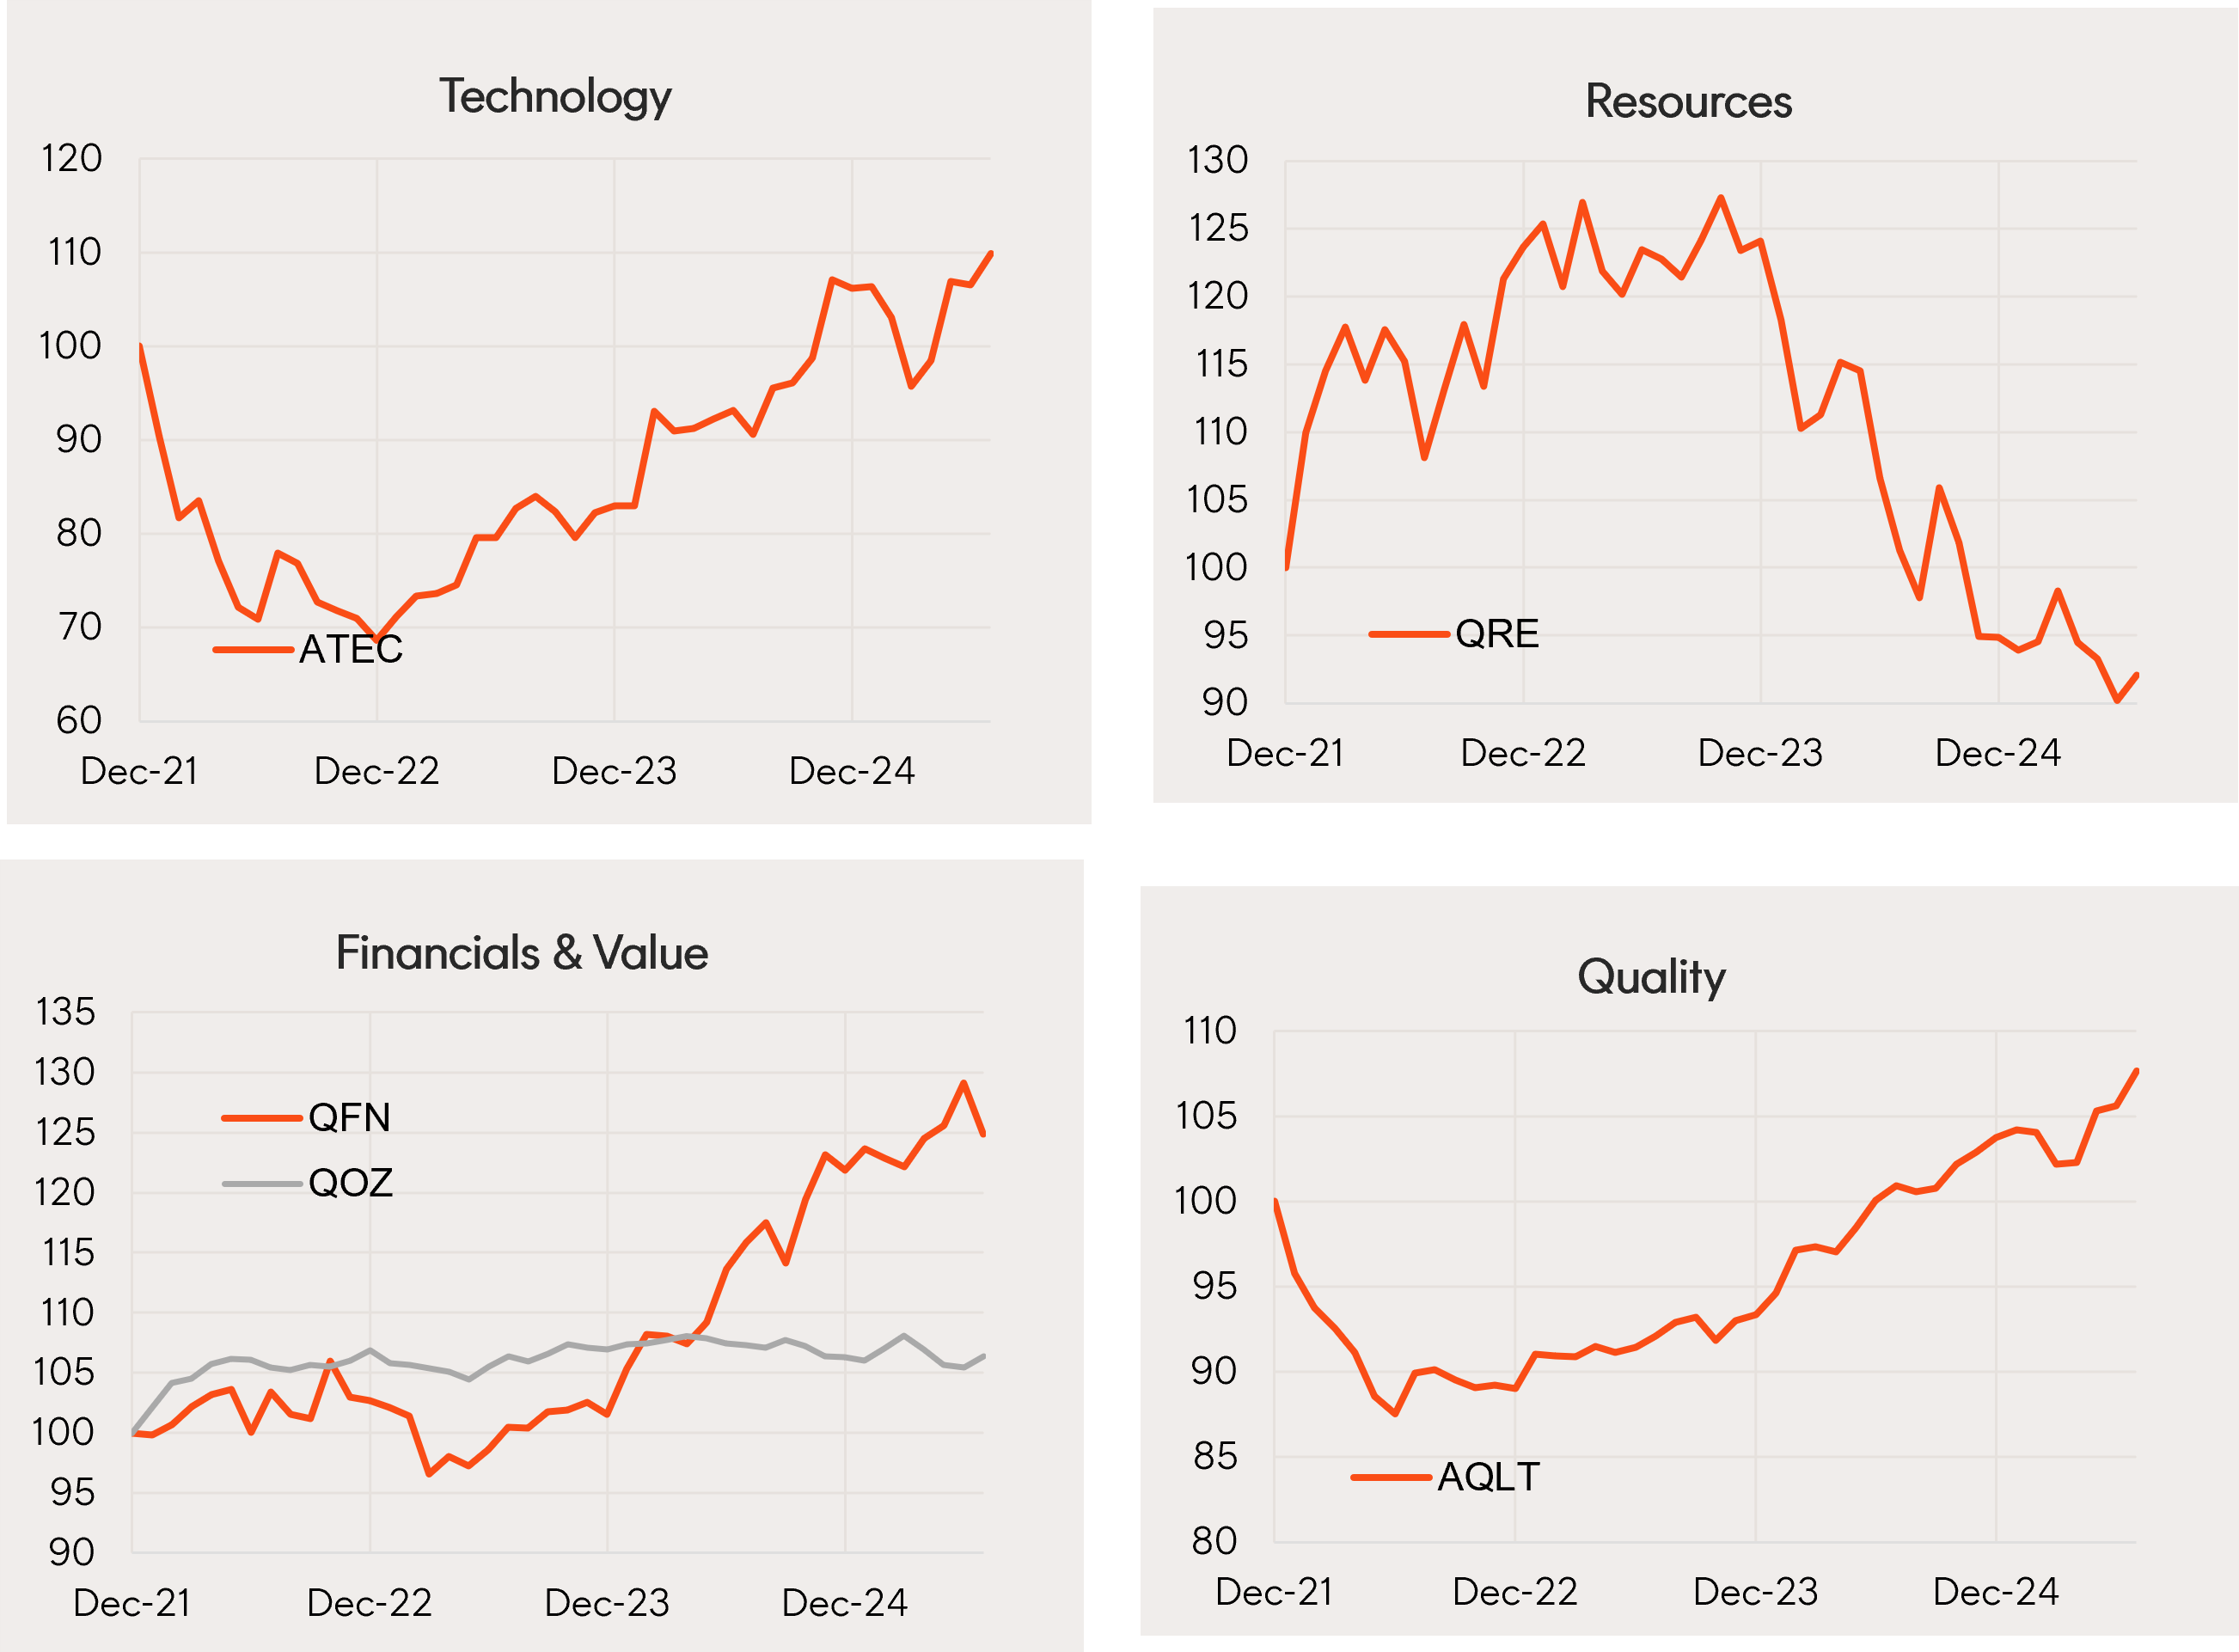
- A modest rotation toward resources and away from financial stocks was evident in July. That said, among select Betashares Australian equity ETFs, financials and quality AQLT Australian Quality ETF have generally held up well so far this year.
- Technology ATEC S&P/ASX Australian Technology ETF has also bounced back relatively strongly in the past few months.
- Performance among other ETFs has been relatively steady, although resources are still tending to underperform.
Source: Bloomberg, LSEG, Betashares. Relative performance versus the S&P/ASX 200 Index for the indices which the relative ETFs track. You cannot invest directly in an index. Past performance is not an indicator of future performance.