Investing in bonds under a new regime
6 minutes reading time
Financial intermediary use only. Not for distribution to retail clients.
Traditional equity benchmark indexes, like those that track the largest 200 companies on the ASX, allocate weight using a single metric – market capitalisation. The larger a company is and grows, keeping all else constant, the more weight it will receive in your portfolio.
This approach does have advantages, it benefits as winners run and grow bigger, and is a reflection of the stock market’s views of value. However, in doing so it is also vulnerable to distortions to market efficiency, such as fads and overcrowded trades. Could there be a better method?
QOZ FTSE RAFI Australia 200 ETF takes a different approach to portfolio construction that provides the potential to outperform the benchmark S&P/ASX 200 (ASX200). QOZ’s index has provided on average an additional 1.8% return per annum since available data from May 1992 (to June 2024).
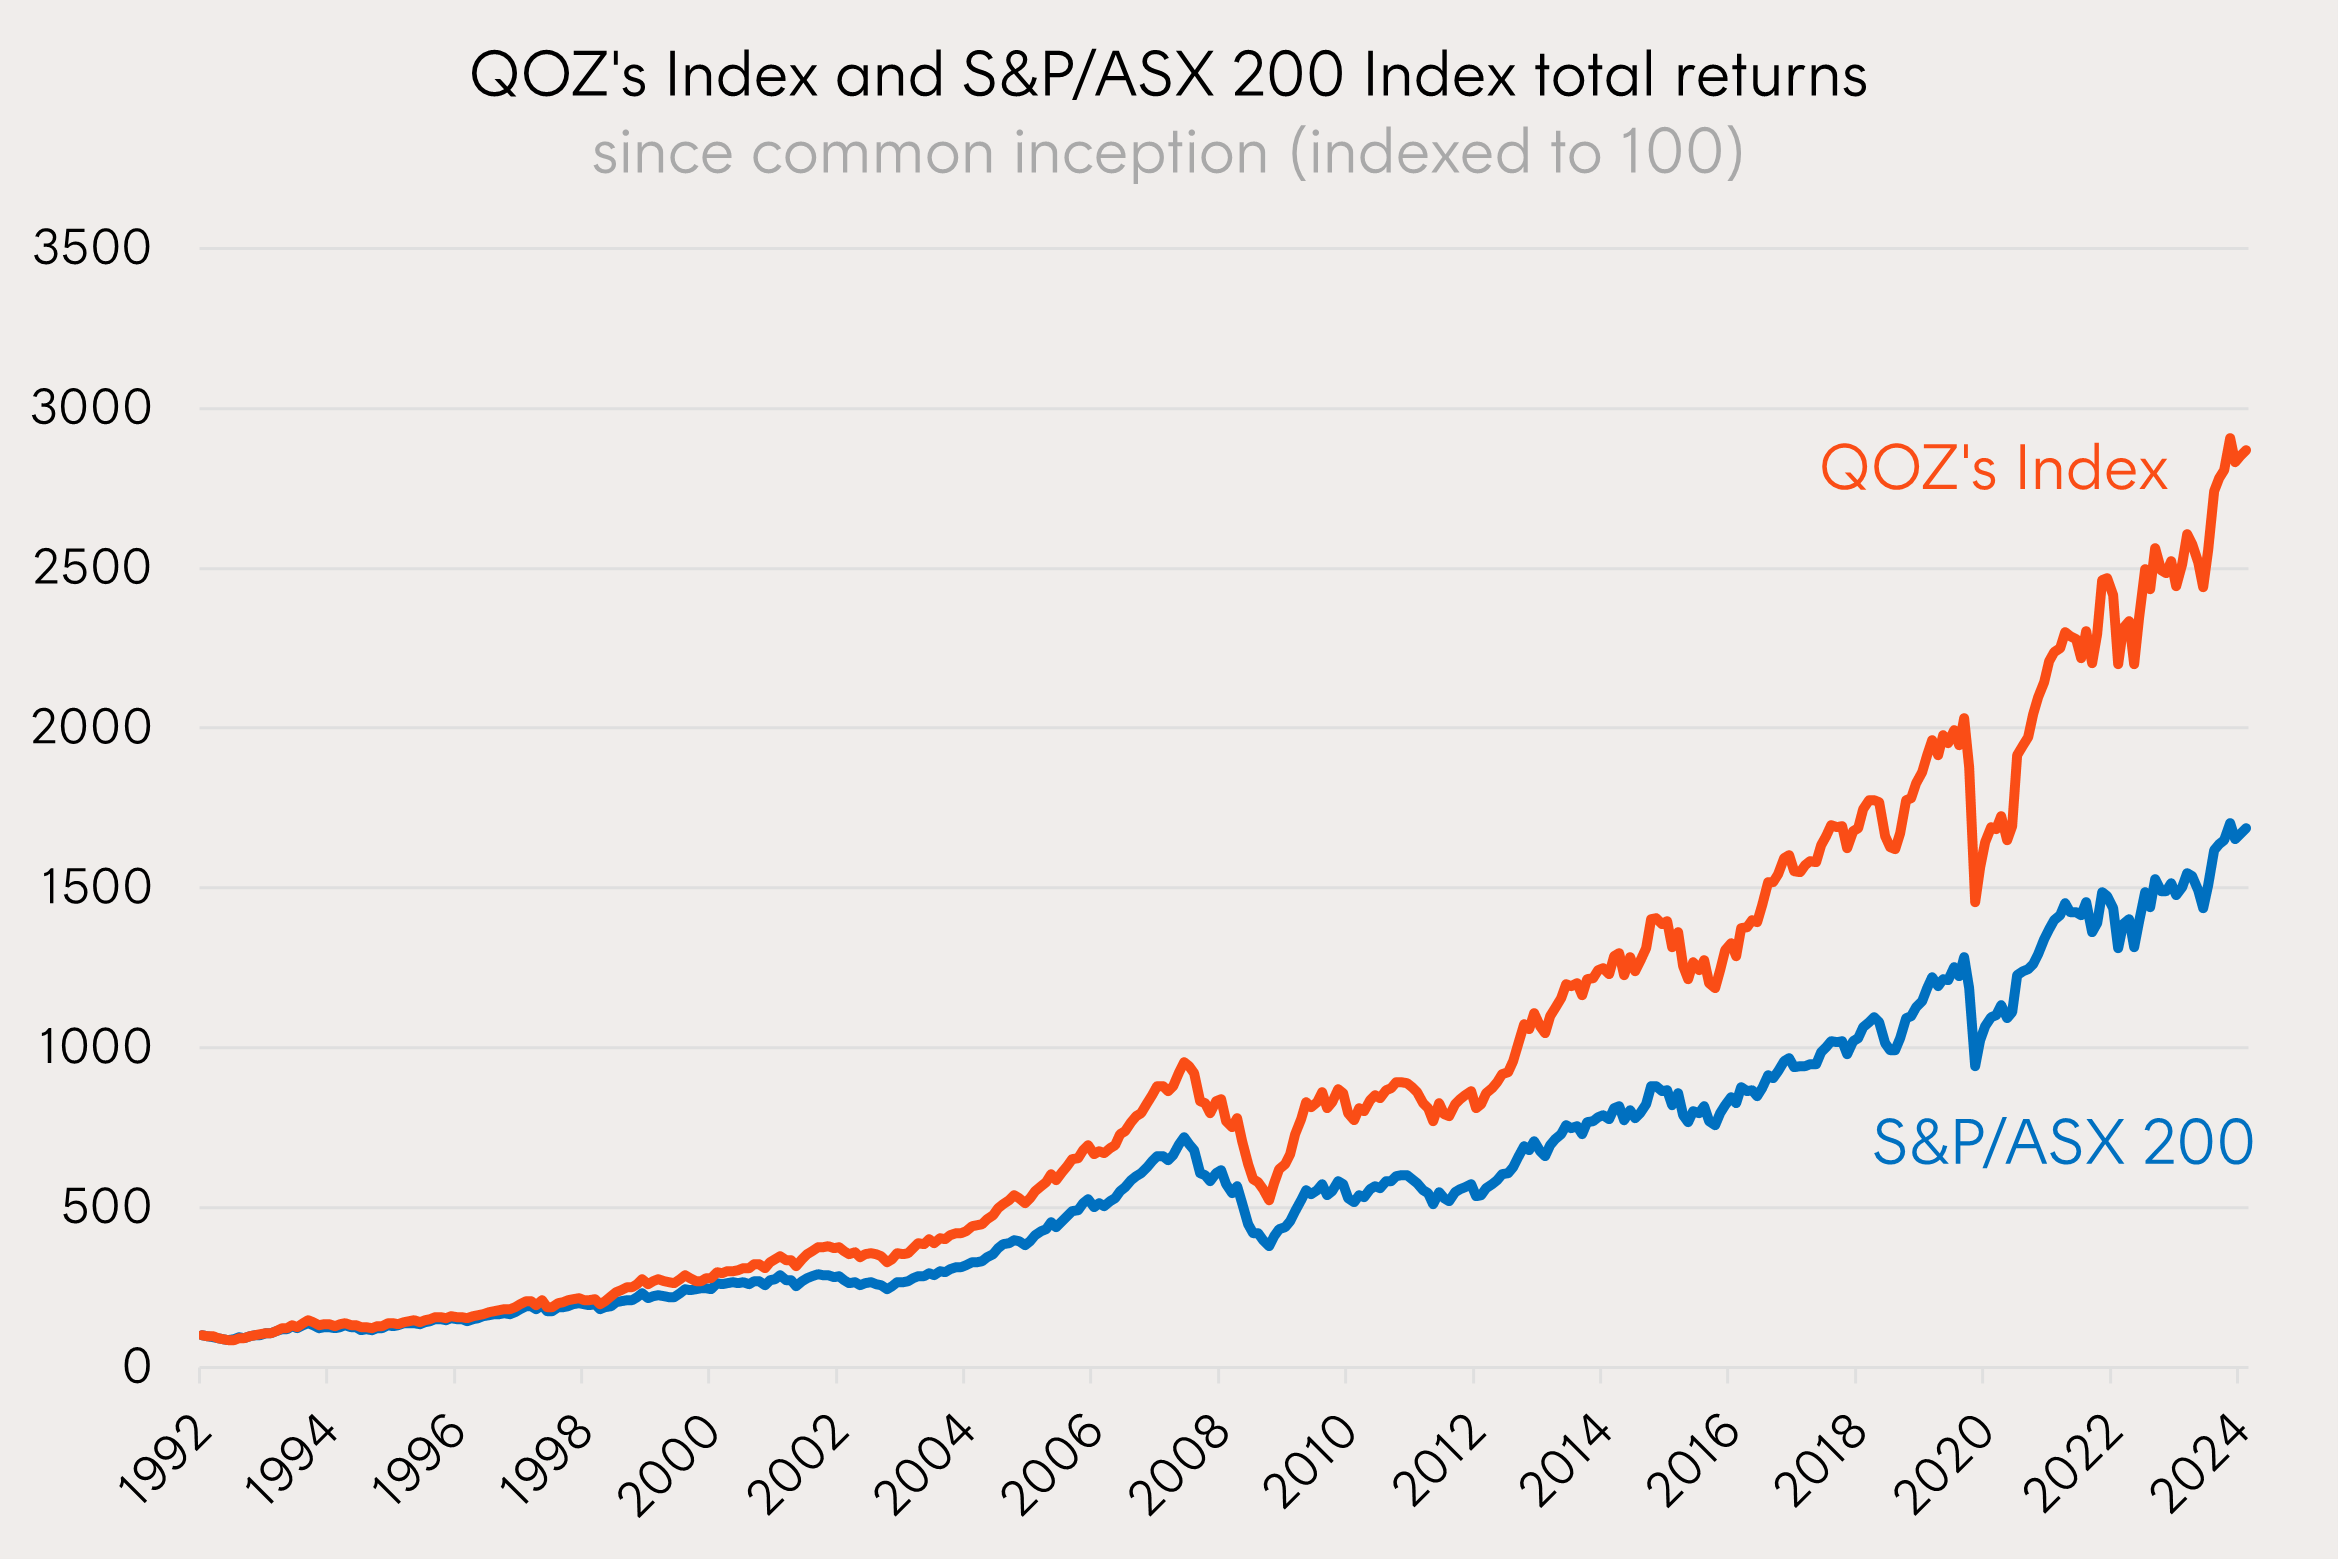
Source: Bloomberg, Betashares. As at 28 June 2024. Returns shown are index returns and do not take into account ETF management fees and costs. QOZ’s management fee is 0.40% p.a. You cannot invest directly in an index. Past performance is not an indicator of future performance.
Is size everything?
Understanding that passive indexes can be constructed to weight companies using almost any observable metric, we can look at alternatives to a company’s market capitalisation alone to construct a broad market exposure.
Intuitively, investors may be interested in giving a larger portfolio weight to companies that are generating higher levels of sales and cash flows. These metrics are the tangible results from successful business operations.
As Australian investors, with our favourable franking credit system, we may also want to place a higher weight on those companies paying the highest dividends.
And finally, a thought to a company’s book size, representing its financial health and stability and to identify value opportunities, may be beneficial.
This is exactly the approach that QOZ takes.
Taking companies listed on the ASX, QOZ’s index considers each companies sales, cash flows, dividends, and book values relative to the cohort and weights each company accordingly.
A very simple but intelligent approach than considering size alone.
QOZ’s index’ approach has not only provided long term outperformance above the ASX200 (see chart above) but has also led to other desirable characteristics, like more of these returns coming by way of franked distributions.
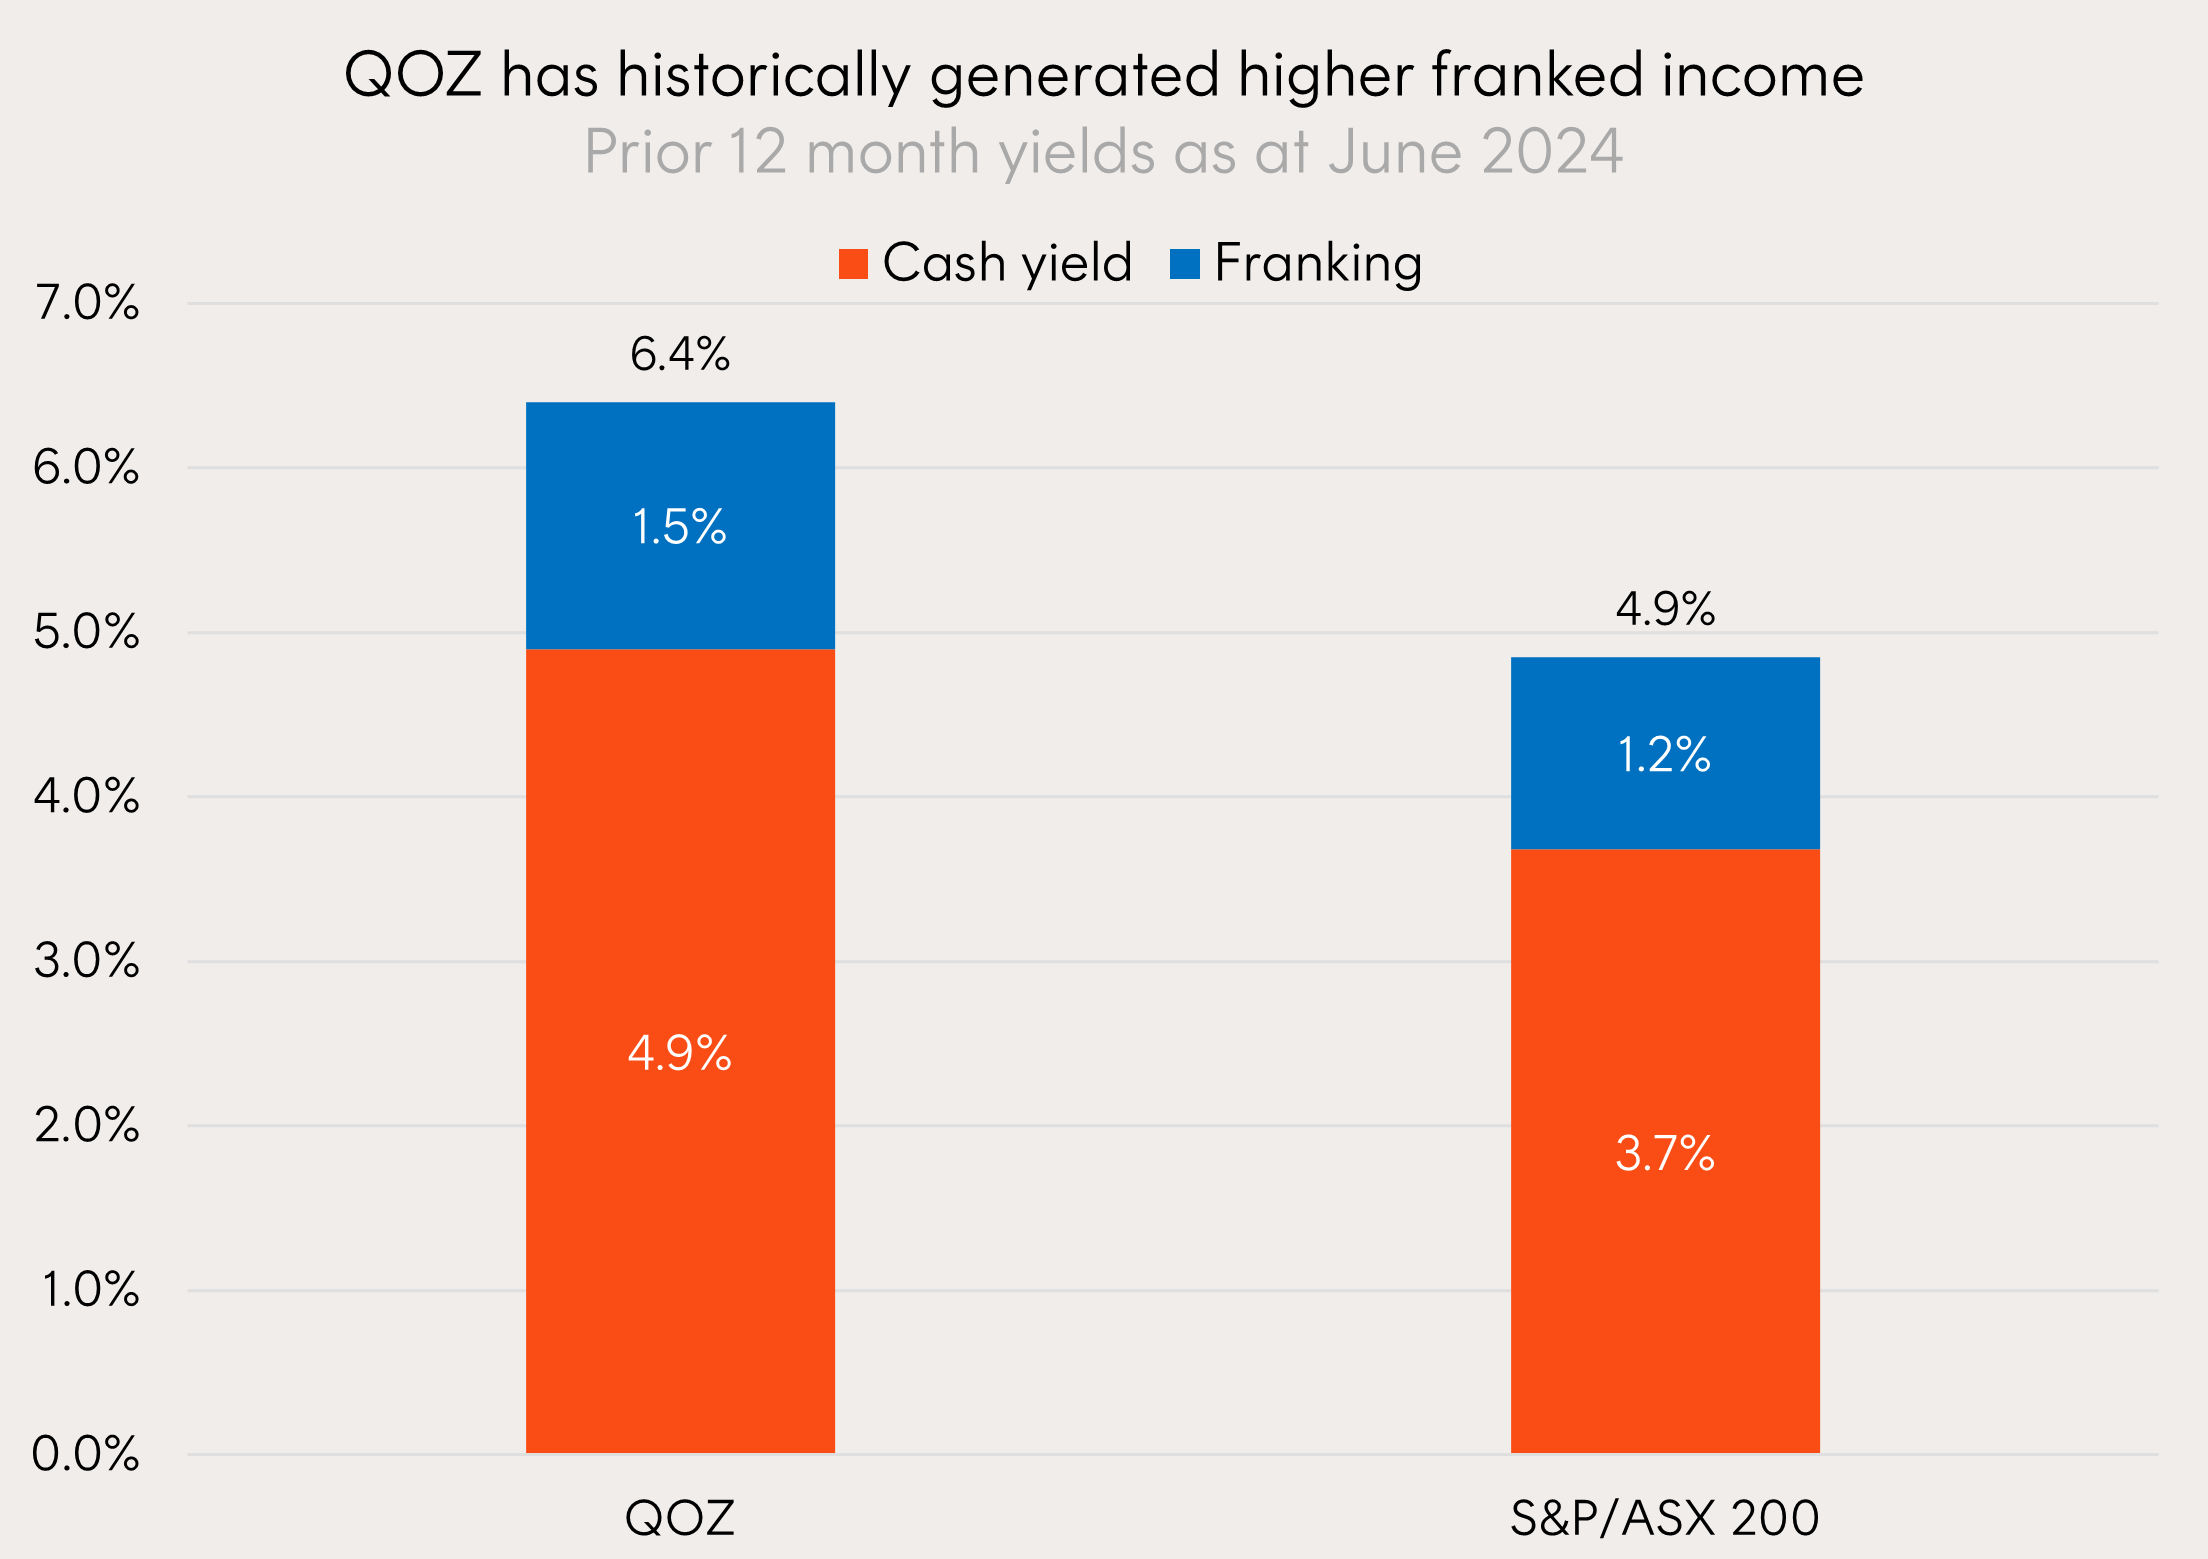
Source: Betashares, Bloomberg. As at 28 June 2024. QOZ’s yield is calculated by summing the prior 12-month per unit distributions divided by the closing NAV per unit at the end of the relevant period. Yield will vary and may be lower at time of investment. Franking level is total franking level over the last 12 months. Past performance is not indicative of future performance.
Buying low and selling high
Traditional market capitalisation-weighted indexes naturally increase their allocation in companies whose share prices have gone up and shrink their allocation to those that have fallen – with no consideration as to whether those share price changes were justified.
In contrast, by ignoring price, QOZ’s approach systematically benefits from a “buy low sell high” rebalancing philosophy.
When stock prices move in a manner that is not reflective of underlying fundamentals, QOZ’s index will generally sell the stocks that have had the greatest price performance and have become relatively “expensive”, taking profits, and reinvesting into securities whose prices have fallen and become “undervalued”.
In doing so, QOZ’s index historically has tended to hold and rebalance into less expensive stocks when compared to the S&P/ASX 200 – benefitting from mean reversion.
Using the last 12 month rebalance period as an example we can see the potential benefits of this strategy. Following QOZ’s March 2023 rebalance, the fund held an 8% overweight position to Australia’s financials sector and a neutral position to Australia’s materials sector, relative to the S&P/ASX200.
At this same time, a lot of market commentary and active managers were negative on the Australian financial sector, and particularly the prospects of Australia’s large, diversified banks, producing positive performance. Being passive, ruled based, and weighting based on underlying fundamentals QOZ’s strategy has the advantage of ignoring market noise.
In the twelve months following this rebalance the Australian financial sector returned 29% compared to 0% for the Australian materials sector.
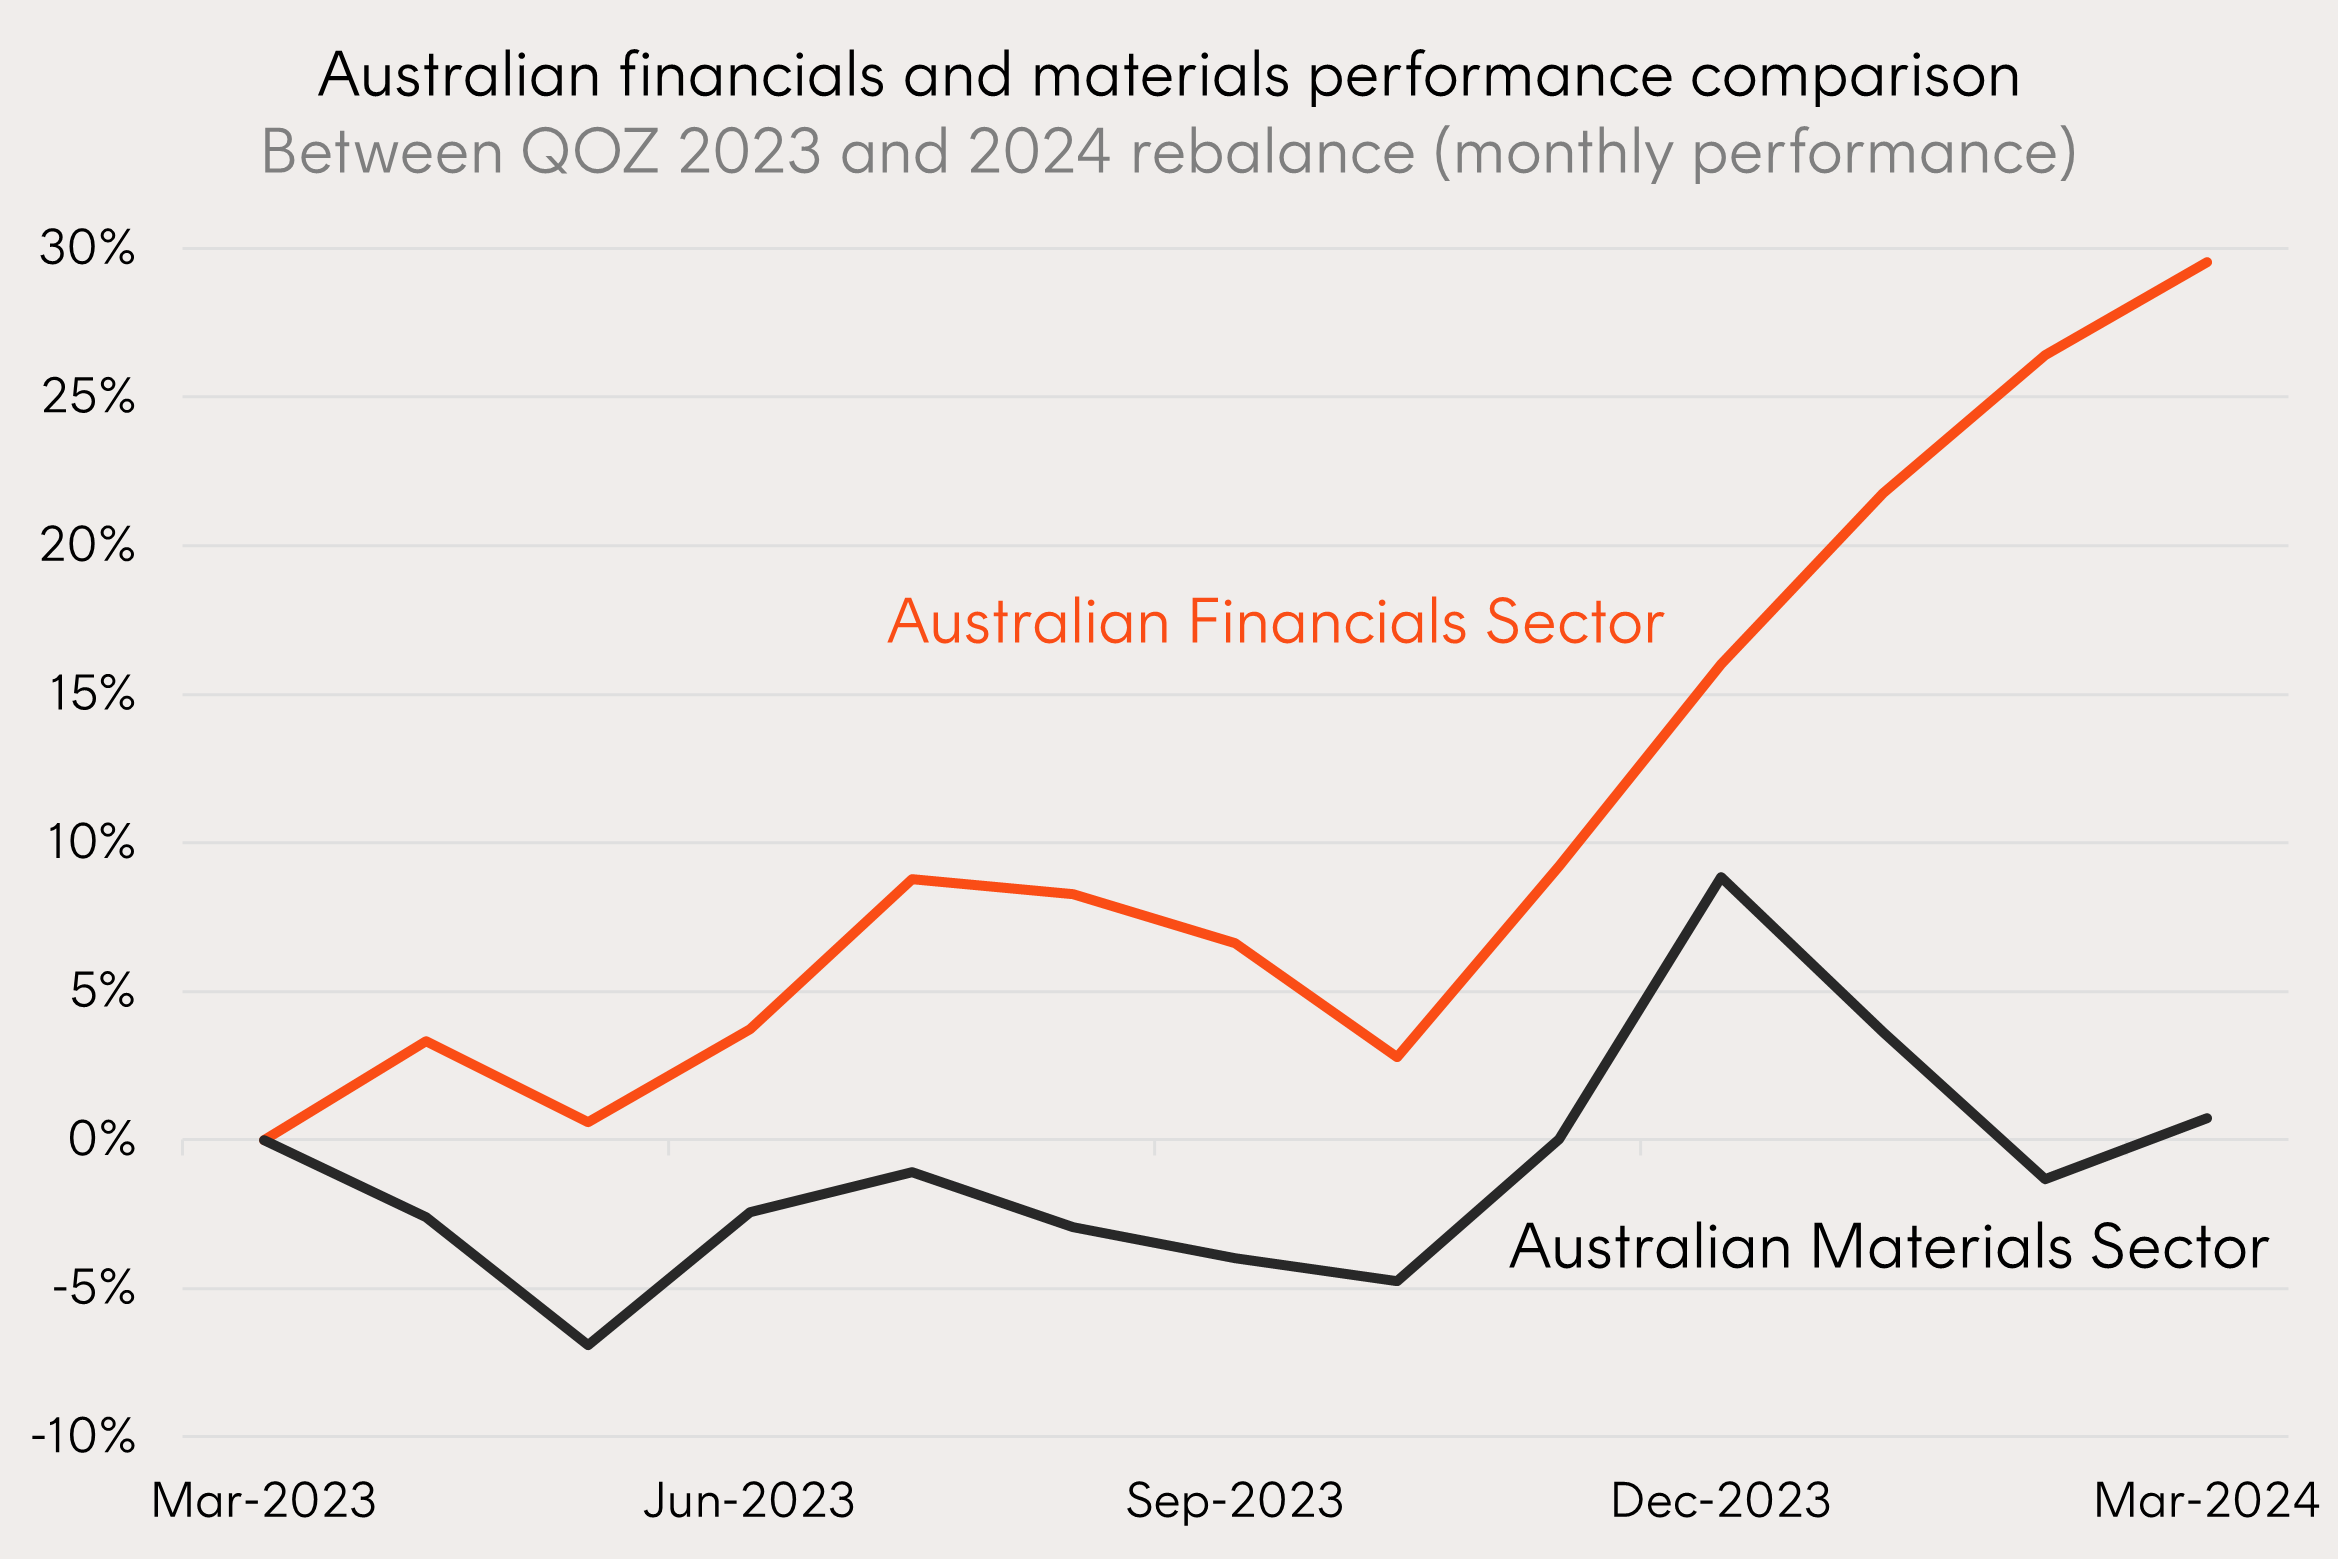
Source: Bloomberg. Australian Financials sector represented by the S&P/ASX 200 Financials Ex-A-REIT Index. Australian Materials sector represented by the S&P/ASX 200 Materials Index. You cannot invest directly in an index. Past performance is not an indicator of future performance.
In its March 2024 rebalance, QOZ’s index effectively took the profits from this outperformance, decreasing its exposure to Australian financials by 6% (led by a 1.4% decrease in the weight of CBA).
Rules based decisions like these have contributed to QOZ index’s long-term outperformance over the ASX200, shown below as excess returns between the annual March rebalances.
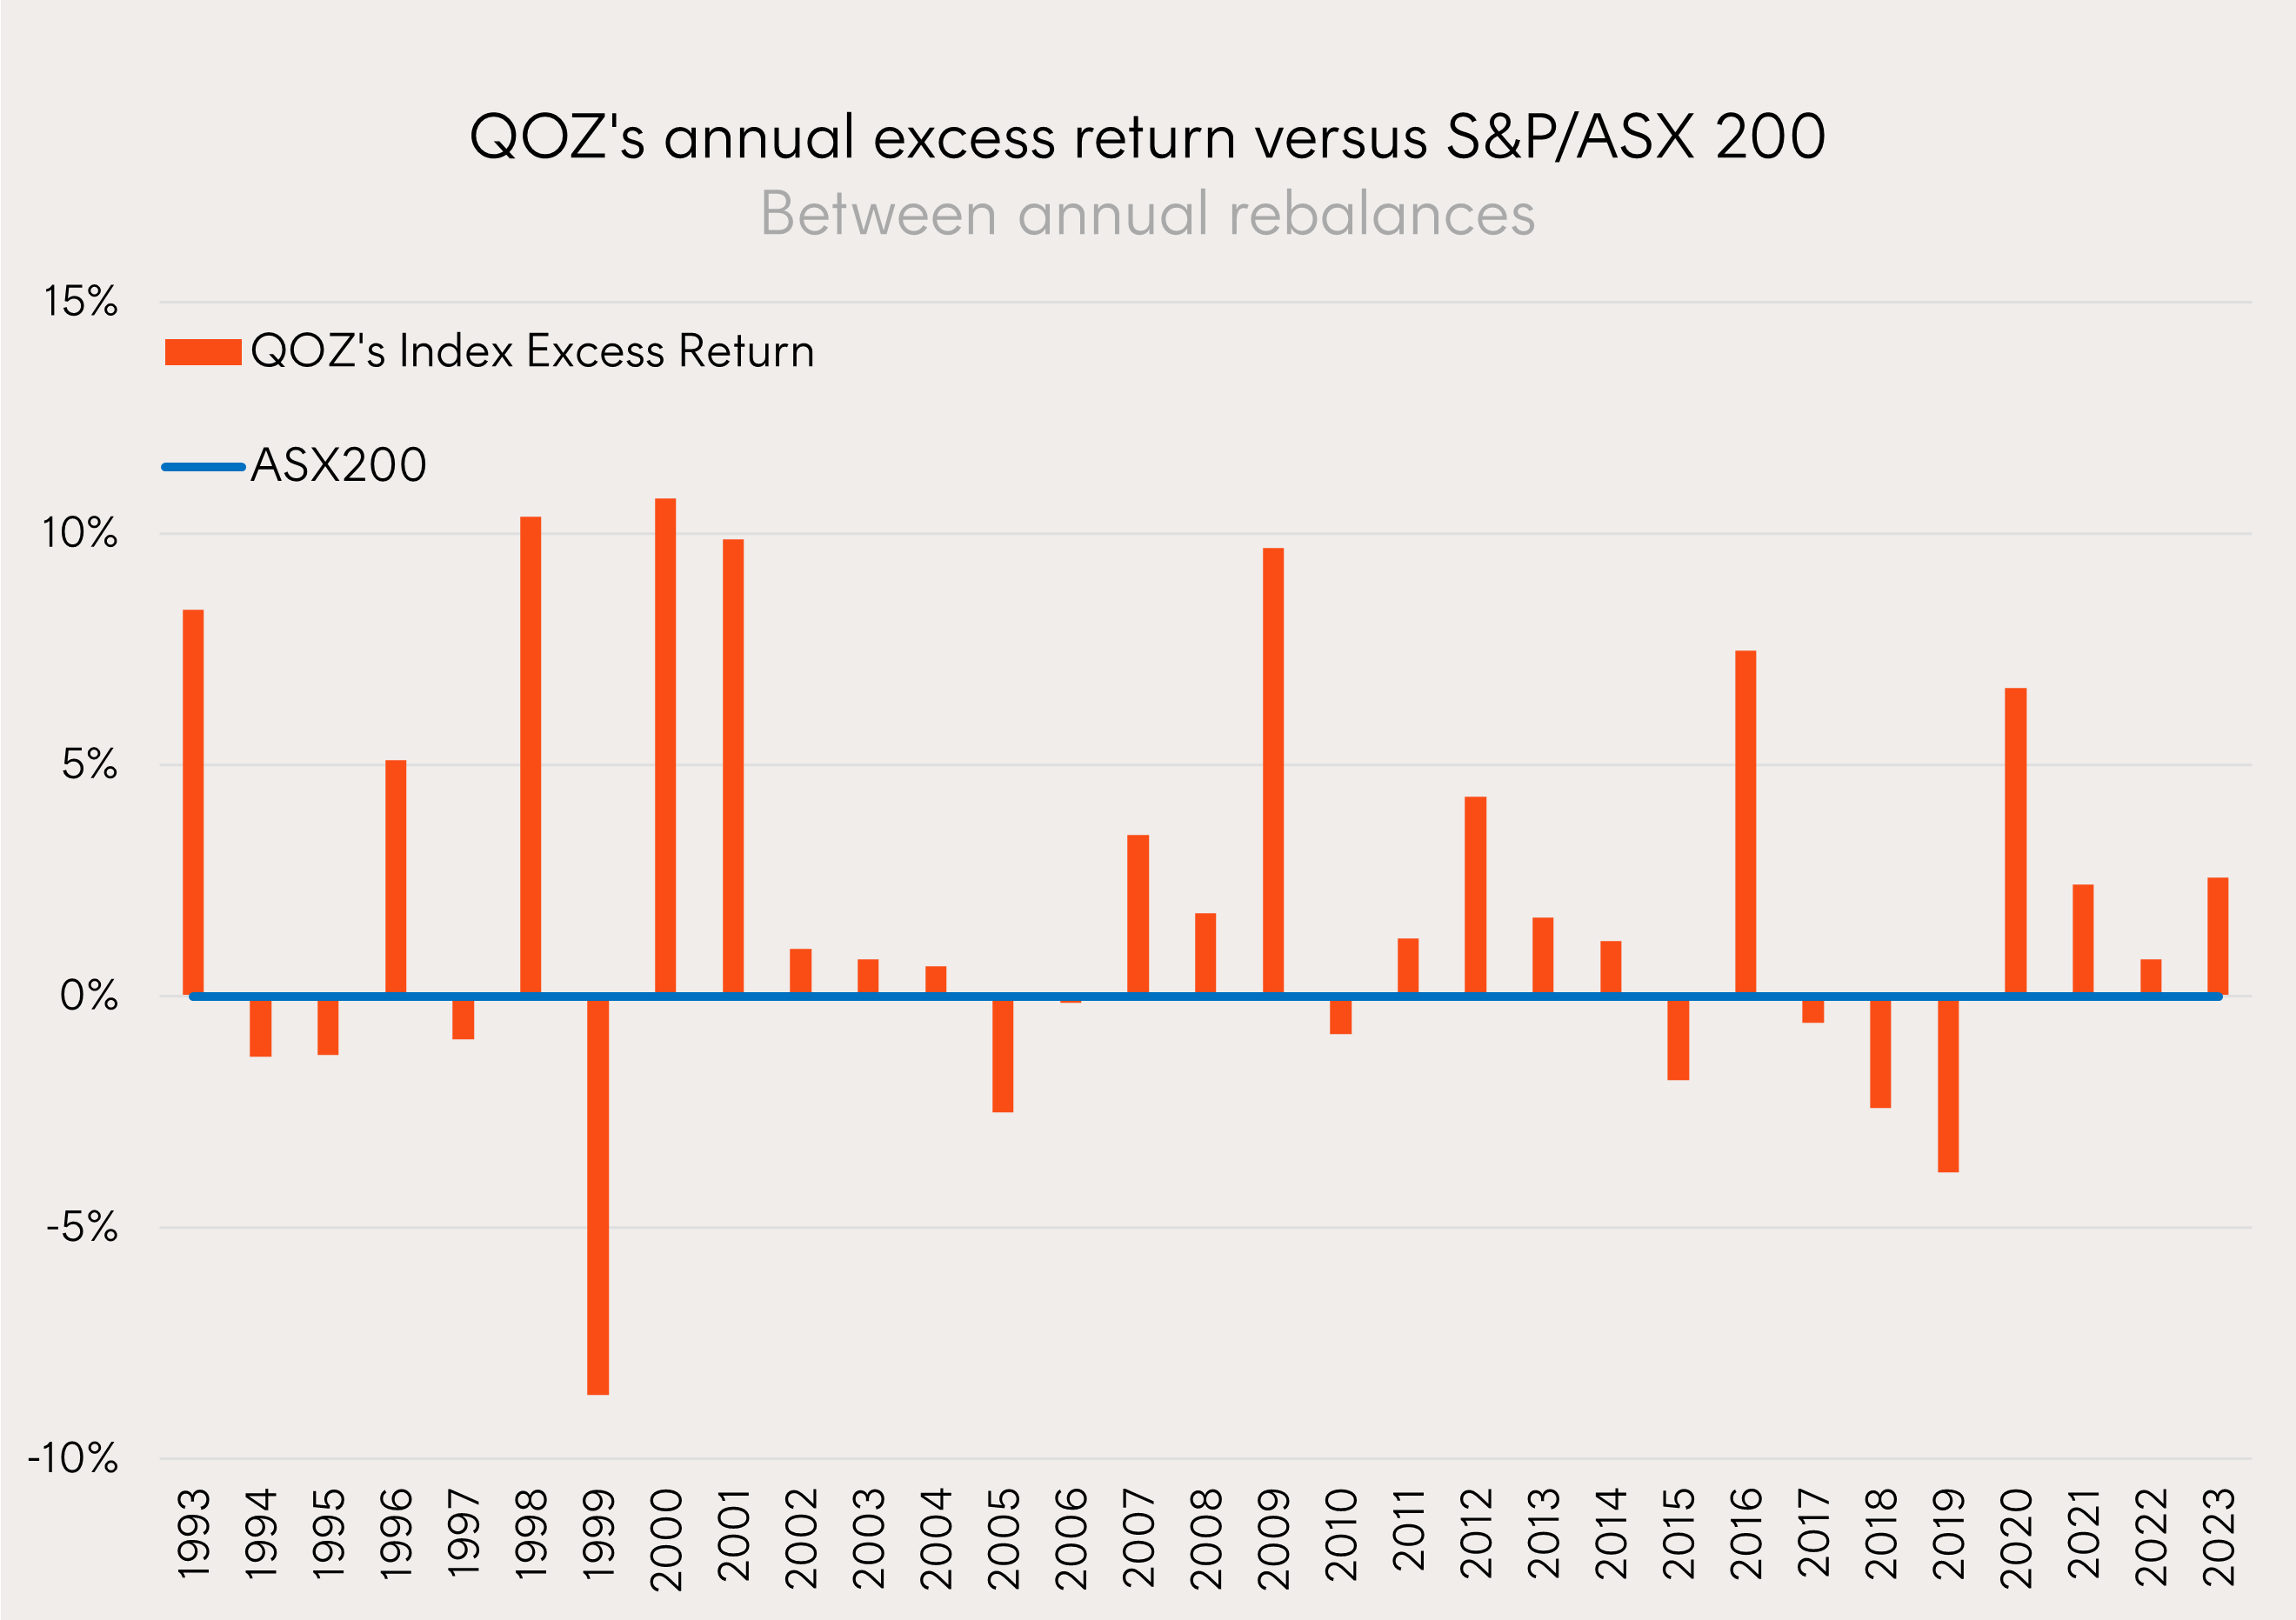
Source: Bloomberg, Betashares. Returns do not take into account QOZ’s management fees of 0.40% p.a. You cannot invest directly in an index. Past performance is not an indicator of future performance.
Notably QOZ’s index has outperformed over most annual rebalance periods, even in the absence of particularly strong pro-value or cyclical narratives which one may expect a strategy of this nature to require. This points to the fact that the strategy of rebalancing portfolio weights towards strong fundamentals rather than market capitalisation alone, can provide outperformance across market cycles.
Portfolio implementation
QOZ can be used by investors as a core Australian equities allocation with the potential to outperform the benchmark S&P/ASX 200. QOZ can also be considered for use as a lower cost alternative to active managers who may look to create portfolios in a similar manner.
For more information please each out or visit QOZ’s fund page here.
There are risks associated with an investment in QOZ, including market risk, security specific risk and sector concentration risk. Investment value can go up and down. An investment in the Fund should only be considered as a part of a broader portfolio, taking into account your particular circumstances, including your tolerance for risk. For more information on risks and other features of the Fund, please see the Product Disclosure Statement and Target Market Determination, both available at www.betashares.com.au.


