Betashares Australian ETF Review: July 2023

Ilan Israelstam
3 minutes reading time
Related articles
Better investing starts here
Get Betashares Direct
Betashares Direct is the new investing platform designed to help you build wealth, your way.
Scan the code to download.
Learn more
Learn more
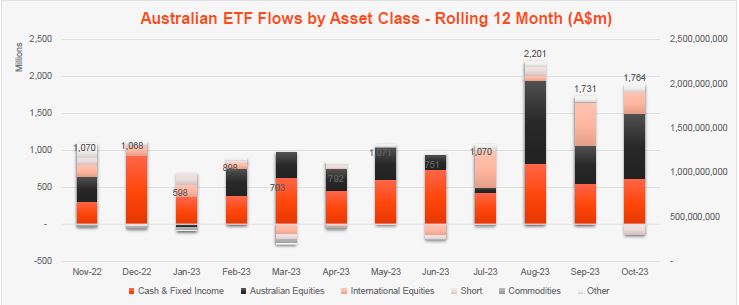
October 2023 Review: Second month of industry declines, as robust inflows not enough to offset sharemarket fall
The second highest net flows of the calendar year were not enough to combat a decline in asset values, as global sharemarket falls caused the industry to decline in October, in a very similar pattern to that experienced in the prior month.
Exchanged Traded Funds Market Cap
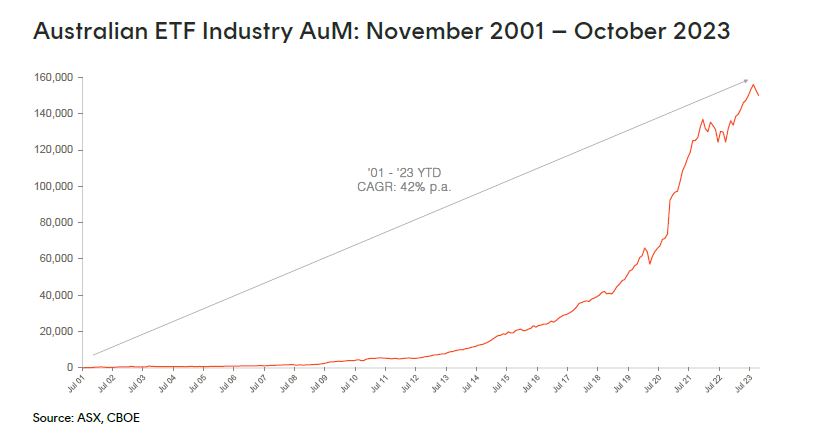
• Australian Exchange Traded Funds Market Cap (ASX + CBOE): $150.1B
• ASX CHESS Market Cap: $136.0B1
• Market Cap increase for month: -1.9%, -$2.8B
• Market cap growth for last 12 months: 14.0%, $18.4B
New Money
• Net inflows for month: $1.8B – 2nd highest net flows for 2023 to date
Products
• 349 Exchange Traded Products trading on the ASX & CBOE
• Only 1 new fund launched this month, as we launched a currency-hedged version of the FTSE 100 ETF, with the ASX code: H100.
• 2 closures this month, with Perpetual closing down their unlisted Global Innovation Fund which meant that the listed class (IDEA) similarly closed. In addition 1
Trading Value
• Trading value rose by ~10% in October, with ASX trading value of ~$10B for the month
Performance
• Cryptocurrency exposures were the best performers in October, followed by geared short Australian equities funds which rallied 10% for the month as the Australian sharemarket fell. With rising geopolitical tension we also saw gold exposures rise strong during the month.
Source: ASX, CBOE
Top category inflows (by $) – October 2023
| Broad Category | Inflow Value |
| Australian Equities | $881,882,798 |
| Fixed Income | $547,890,511 |
| International Equities | $288,924,951 |
| Cash | $70,663,720 |
| Listed Property | $58,325,102 |
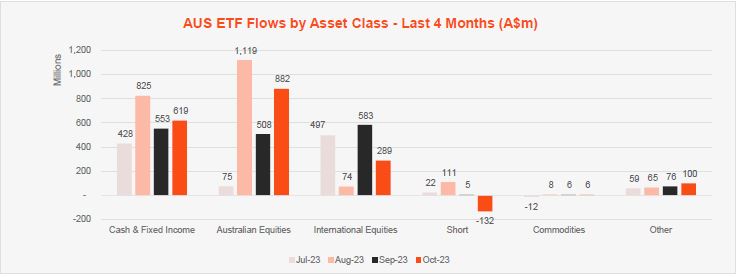
Comment: This month it was very much broad Australian equities exposures that led investor interest, with ~50% of the month’s flows ($882m) coming from this asset class. Fixed Income remained popular, and was the 2nd most popular exposure taking in ~$550m in new money.
Top sub-category inflows (by $) – October 2023
| Sub-category | Inflow Value |
| Australian Equities – Broad | $689,380,787 |
| Australian Bonds | $392,389,847 |
| Global Bonds | $166,403,667 |
| International Equities – Developed World | $159,379,613 |
| International Equities – US | $96,849,302 |
Source: ASX, CBOE
Top category outflows (by $) – October 2023
| Broad Category | Inflow Value |
| Short | ($131,999,193) |
| Currency | ($4,446,102) |
Comment: Outflows were low at a category level, with investors taking profits and selling out of short US and Australian equities products, which combined saw $132m of outflows.
Top sub-category outflows (by $) – October 2023
| Sub-Category | Inflow Value |
| US Equities – Short | ($88,727,867) |
| Australian Equities – Short | ($43,271,326) |
| International Equities – Sector | ($38,294,215) |
| International Equities – Asia | ($11,513,832) |
| Fixed Income – E&R – ESG Lite | ($7,768,722) |
*Past performance is not an indicator of future performance.
1. Since February 2023, the ASX started reporting additional data on a CHESS-only basis. The primary use of such data is that it excludes, amongst other things, the FuM and Flows in ‘dual class’ Active ETFs and potentially provide a more accurate picture of exchange traded activity.
H100
FTSE 100 Currency Hedged ETF
keyboard_arrow_down
Currency hedged exposure to 100 blue-chip companies on the London Stock Exchange
Explore
ETF industry