
Tom Wickenden
7 minutes reading time
Australian investors can rejoice at the growth their share market has offered over the past year. But they may want to take a closer look at how it got there and the path ahead.
The strong price appreciation of the ASX 200 has not been supported by underlying earnings, with the Australian market on track for a second year of negative earnings growth in FY251. At times during the past two years analysts expected earnings to grow in both FY24 and FY25. However, downward revisions and reported results led to the overall negative outcomes, with FY25 earnings expected to come in 17% below their peak expectations2.
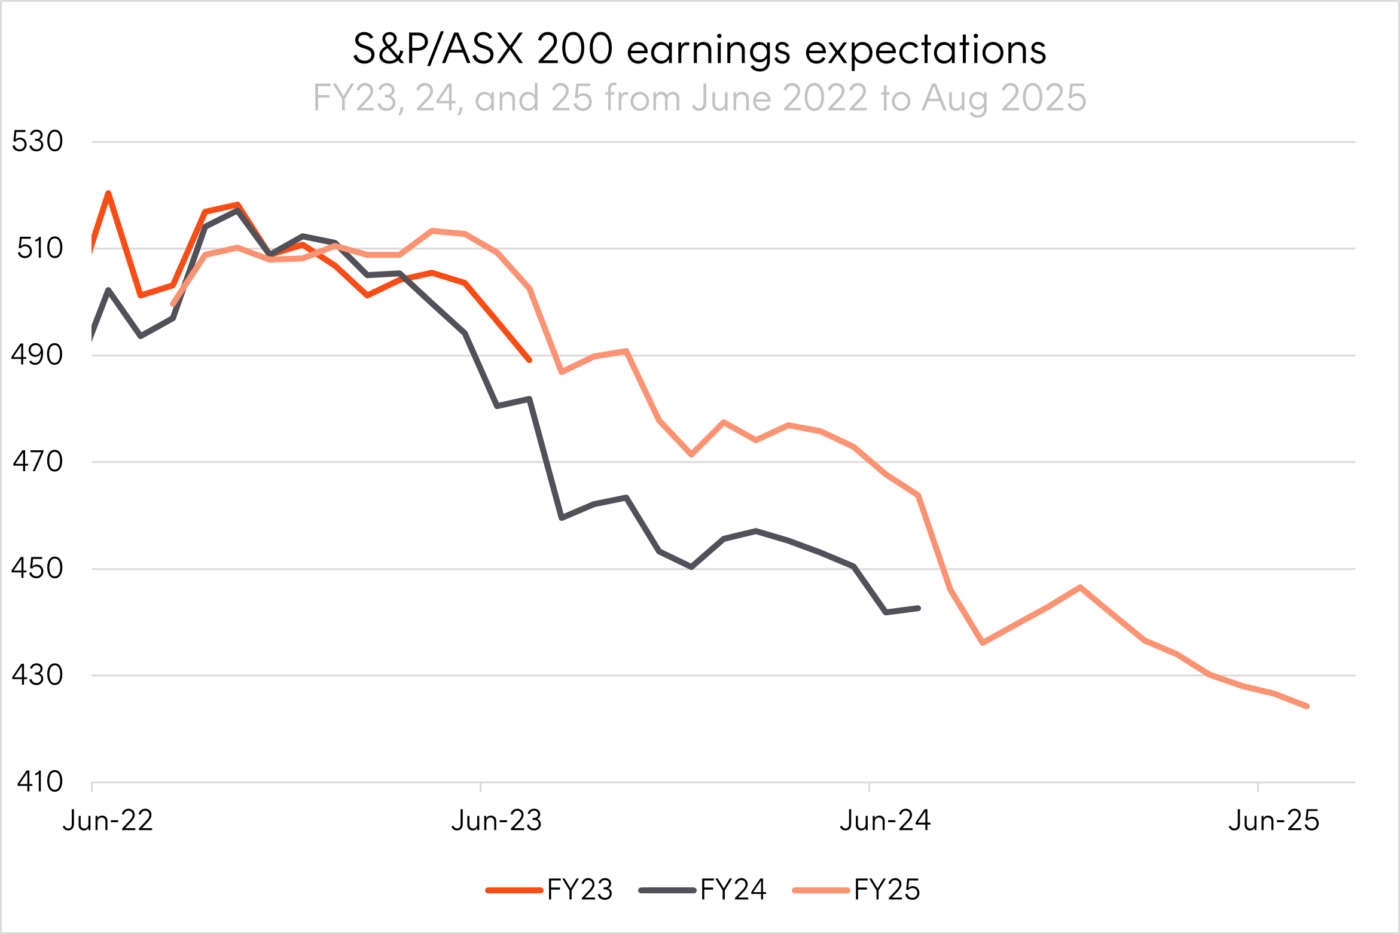
Source: Bloomberg. June 2022 to August 2025 Actual results may differ materially from forecasts.
The low earnings and downgrades for the ASX 200 have been a function of the market’s makeup.
The banks have been able to maintain their guidance but macro constraints, along with competition and margin pressures, are keeping growth subdued.
Meanwhile the materials sector, which carries a 27.7% weighting in aggregate earnings, has seen FY25 earnings decline 20% from peak expectations due to falling commodity prices, weak demand, and rising costs3.
This earnings environment coupled with the strong price appreciation has driven the ASX 200 to trade above a 20x forward price to earnings ratio4.
There have only been two other periods in the past 25 years that this valuation level has been breached – when economic conditions cratered after the GFC and COVID crash.
In both cases, significant upward revisions to forward earnings, as the economic environment improved, normalised valuations. Does this matter and can investors expect the same this time around?
|
Date |
Fwd P/E |
12-month Fwd EPS revision |
Fwd P/E after 12 months |
|
31/12/2009 |
21.2 |
38% |
15.0 |
|
29/01/2021 |
26.7 |
66% |
17.0 |
|
31/07/2024* |
18.4 |
0% |
20.0 |
Source: Bloomberg. Dates selected as month end peak forward p/e ratio during periods it was greater than 20x. S&P/ASX 200 forward p/e breached 20x on 30 Sep 2024. * July 2024 used as most recent month end to allow for 12 months of forward data, forward P/E on the S&P/ASX 200 breached 20x on 30 September 2024.
Without a normalisation of valuations, there is likely little room left for further valuation driven growth in the ASX 200. Based on current expectations forward earnings are expected to grow by 7% by mid-265.
While a catalyst for major upward revisions, like a China growth surge or AI driven broad productivity boost, is unlikely in the short term we do expect the RBA’s rate cuts will boost the economy and support these levels of earnings – ending the downgrade cycle.
This would leave Australia as a lower growth equity return destination compared to global markets, mainly due to the influence of strong expected growth in the US – particularly from Nasdaq 100 companies.
While the ASX 200 overall has seen poor earnings momentum, there are parts of the market that have been experiencing stronger earnings growth and have stronger outlooks – particularly communications, technology, and consumer sectors. These higher-growth industries are relatively small in Australia, however, and are crowded out at the index level by large weights to financials, energy, and materials.
The table below compares analyst forecasts for sector earnings growth in Australia versus the global average. “Earnings growth” refers to expected growth over the next 12 months, while “world” represents the global sector average. The “industry mix” column shows how much of Australia’s performance is explained by its sector make-up, and “industry competitiveness” indicates whether Australian companies within each sector are expected to grow faster or slower than their global peers.
In short, the weaker ASX 200 outlook reflects both an unfavourable sector mix and relative underperformance in some of its largest industries.
|
|
Australia |
World |
Shift-share |
|||
|
|
Earnings growth |
Industry weight |
Earnings growth |
Industry weight |
Industry mix |
Industry competitiveness |
|
Financials |
3.5% |
35.9% |
10.0% |
26.0% |
-0.2% |
-2.3% |
|
Comm & Tech |
12.5% |
3.0% |
13.6% |
23.7% |
-0.3% |
0.0% |
|
Eng & Mat |
3.6% |
32.8% |
14.0% |
10.3% |
0.4% |
-3.4% |
|
Other |
13.8% |
28.3% |
12.4% |
40.0% |
0.0% |
0.4% |
|
Total |
6.7% |
12.2% |
-0.1% |
-5.4% |
||
Source: FactSet. 8 August 2025. FactSet analyst consensus forecast. Actual results may differ materially from forecasts.
Given this backdrop, investors could target areas of the Australian market with strong fundamentals to help maintain the elevated returns of recent years. Australia’s highest quality mid-caps are one such area. Rather than waiting for these future leaders to grow to higher weights in the ASX 200, forgoing their returns in the meantime, investors could look to increase their exposures now.
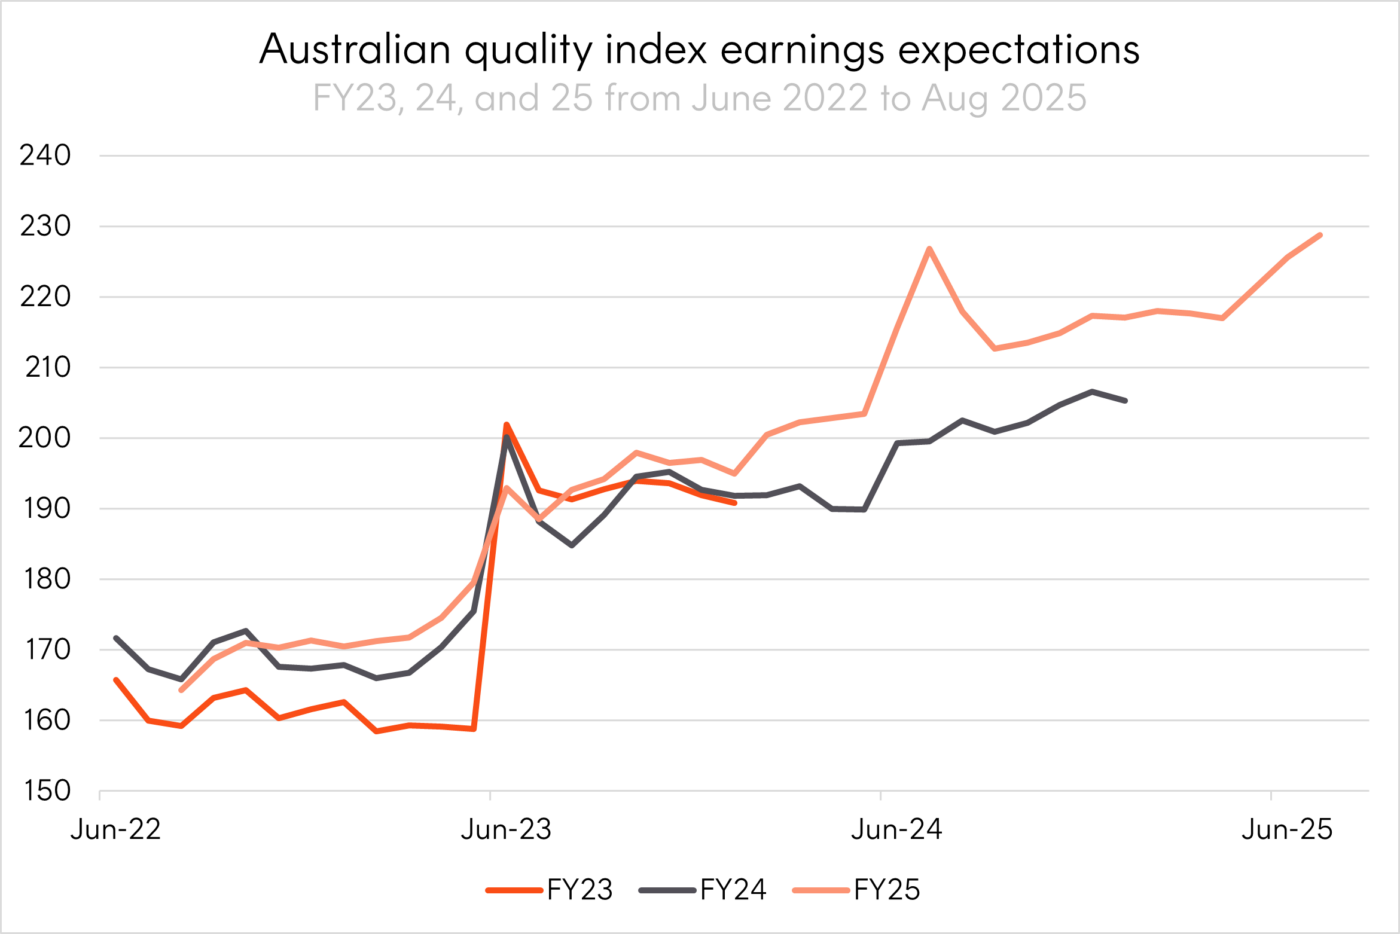
Source: Bloomberg. June 2022 to August 2025. Bloomberg analyst consensus forecast. Australian quality index represented by the Solactive Australia Quality Select Index. Actual results may differ materially from forecasts.
Investment implications
While the headline earnings picture for the ASX 200 looks softer than global peers, there are pockets of strength within Australia’s market. Communications, technology and consumer companies are seeing positive revisions and robust earnings growth, yet these sectors remain underrepresented in the index, overshadowed by the larger financials, energy and materials names.
This creates an opportunity for investors to look beyond the benchmark and focus on the parts of the market where fundamentals are stronger. Australia’s higher-quality mid-cap companies offer exposure to businesses with improving earnings profiles and long-term growth potential.
-
AQLT
Australian Quality ETF
- AQLT aims to track an index (before fees and expenses) that holds 40 companies comprising Australia’s large caps, re-weighted by their quality metrics rather than market capitalisation, and high quality mid- and small caps on the ASX.
- Despite AQLT’s largest active underweight position being CBA since fund inception, 4 April 2022, the fund has outperformed the S&P/ASX 200 by, on average, 4.8% p.a., including 6.5% over the past 12 months6.
Along with earnings, dividends have not kept up with the ASX 200’s growth. Australia still boasts one of the highest yielding share markets in the world, but the dividend yield on the ASX200 has fallen significantly and is now below 3.5% p.a.
Aside from the Covid dip, we haven’t had another time in the last 50 years where both the ASX dividend yield and RBA cash rate were below 4% at the same time. This has massive implications for Australian investors, particularly those that rely on investment income.
-
HYLD
S&P Australian Shares High Yield ETF
- HYLD is an Australian equity-income ETF designed to provide higher dividend income than the broader Australian share market, with screens that aim to exclude companies with unsustainable dividend yields and reduce the risks associated with many existing income focused strategies.
- HYLD’s Index has outperformed the S&P/ASX 200 Index by 1.69% p.a. (net of HYLD’s management fee) from HYLD’s Index inception date in July 2011 to 31 July 2025, at a slightly lower level of volatility7.
There are risks associated with an investment in each of the Funds. Investment value can go up and down. An investment in any Fund should only be made after considering your particular circumstances, including your tolerance for risk. For more information on the risks and other features of a Fund, please see the relevant Product Disclosure Statement and Target Market Determination, available at www.betashares.com.au.
Betashares Capital Limited (ACN 139 566 868 / AFS Licence 341181) (“Betashares”) is the issuer of this information. It is general in nature, does not take into account the particular circumstances of any investor, and is not a recommendation or offer to make any investment or to adopt any particular investment strategy. Future results are impossible to predict. Actual events or results may differ materially, positively or negatively, from those reflected or contemplated in any opinions, projections, assumptions or other forward-looking statements. Opinions and other forward-looking statements are subject to change without notice. Investing involves risk.
To the extent permitted by law Betashares accepts no liability for any errors or omissions or loss from reliance on the information herein.
Sources:
1. Source: Factset. As at 13 August 2025. ↑
2. Source: Factset. As at 13 August 2025. ↑
3. Source: Bloomberg. Bloomberg analyst consensus forecast. Actual results may differ materially from forecasts. ↑
4. Source: Bloomberg. As at 13 August 2025. ↑
5. Source: FactSet As at 13 August 2025. ↑
6. As at 31 July 2025. Past performance is not an indicator of future performance. ↑
7. Past performance is not an indicator of future performance. ↑