
Hugh Lam
5 minutes reading time
Uncertainty around tariff levels, the timing and form of trade deals, and substance of the One Big Beautiful Bill Act (OBBBA) were the main near-term risks of Trump’s first 8-months in office. However, as the Fed begins lowering interest rates and expansionary fiscal policy makes its way through the economy, there remains plenty of opportunities across asset classes if investors know where to look.
In this edition of Charts of the Month, we look at the growing role of companies beyond the Magnificent 7, and explore key themes from Asia technology, defence spending and cybersecurity which have all proven resilient so far in 2025.
1 – Growing beyond the big end of town
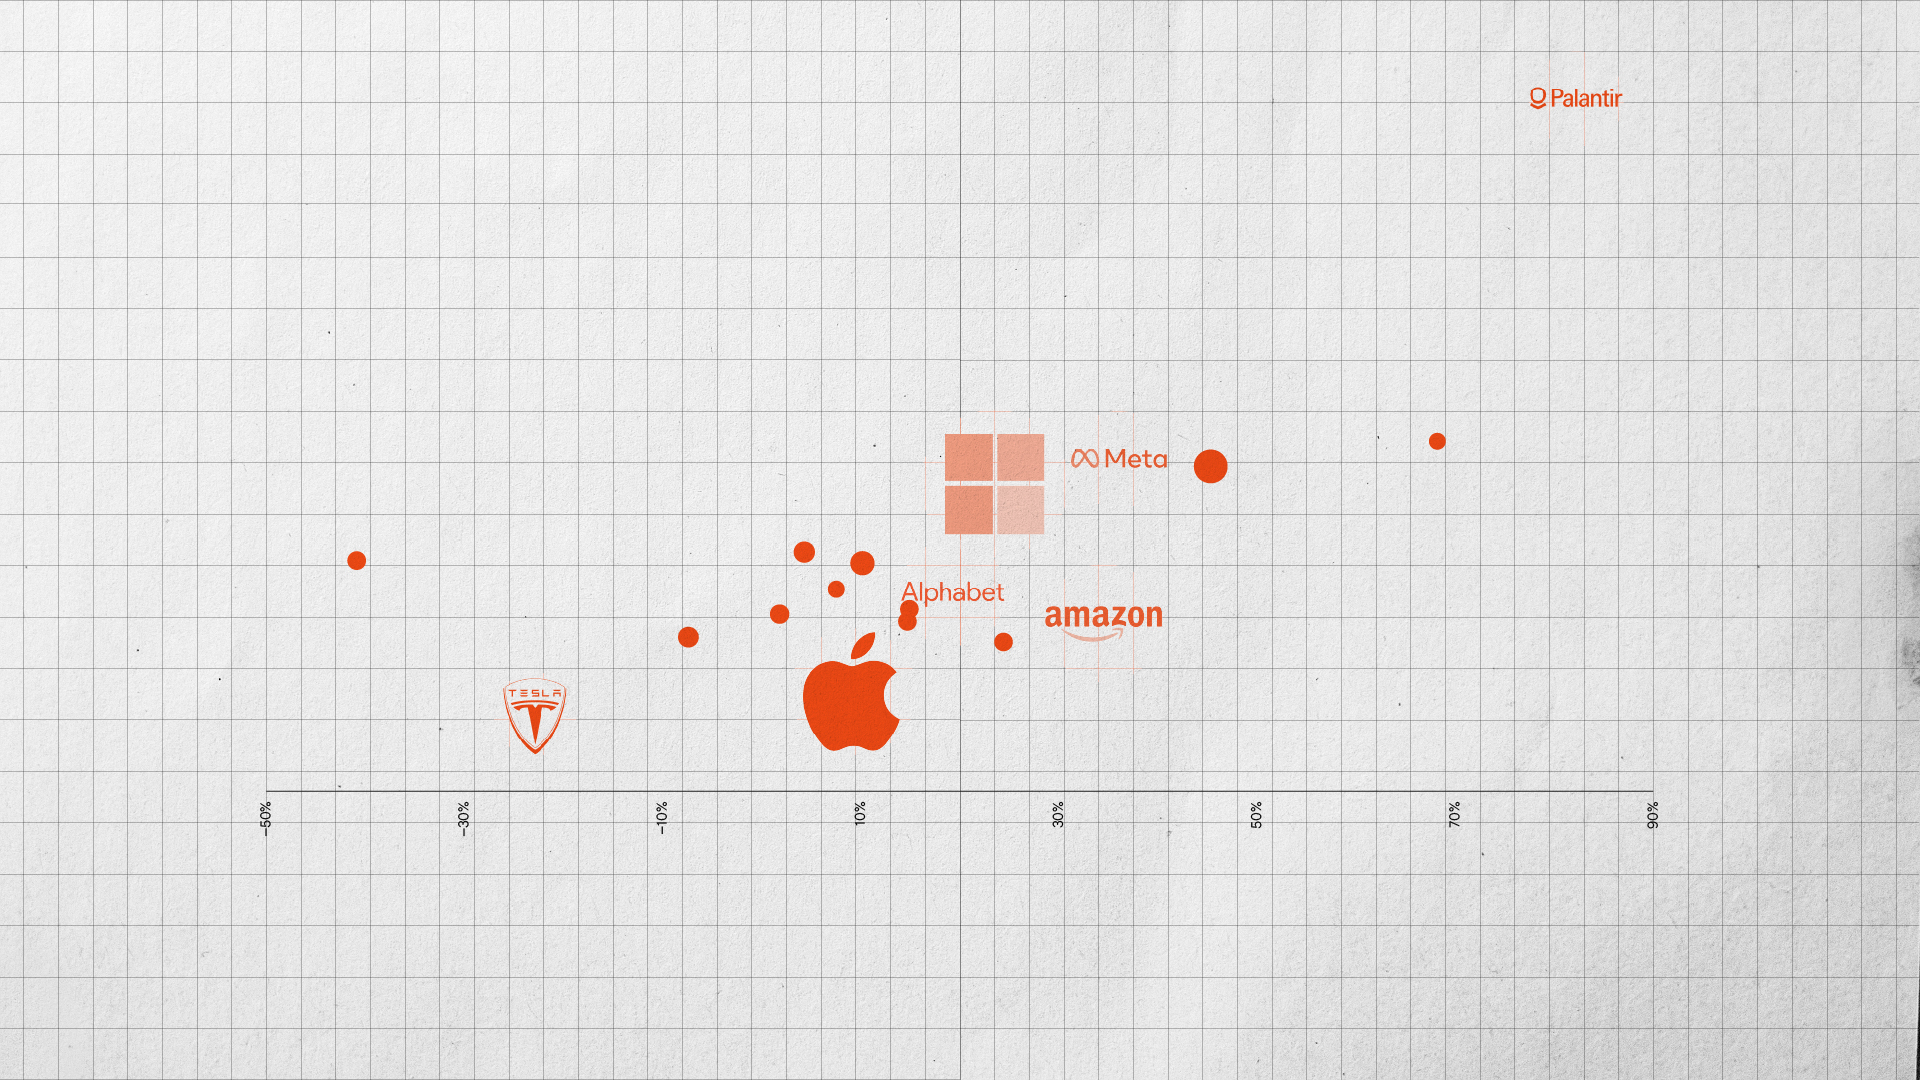
Beyond the Magnificent 7, there are other companies in the Nasdaq 100 index such as Palantir and Netflix which delivered stronger earnings growth in Q2.
With the AI narrative continuing to broaden out beyond US mega cap tech, investors can consider NDQ Nasdaq 100 ETF to gain exposure to other fast growing names that are scaling rapidly, improving margins, and capturing new profit opportunities.
Chart 1: Q2 2025 profit growth and YTD return of select Nasdaq 100 companies
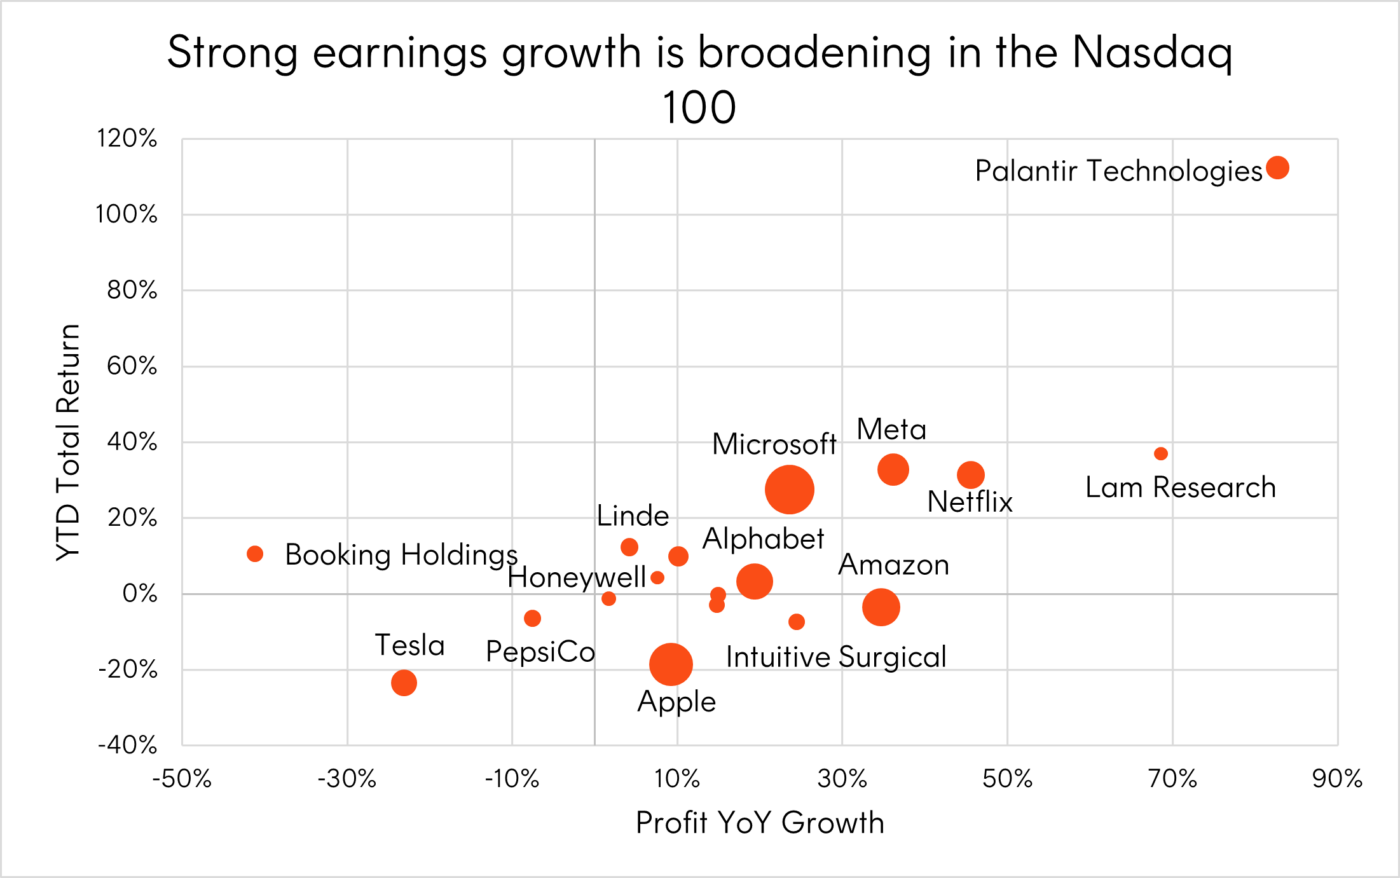
Source: Nasdaq Global Indexes, Factset. As at 4 August 2025. Past performance is not indicative of future performance.
2 – Opportunities in Australian quality
The earnings outlook for the ASX 200 appears challenged – competition and margin pressures are impacting Australia’s banks whilst falling commodity prices and higher production costs have seen profits falling at BHP and Rio Tinto.
Given this backdrop, investors could consider targeting areas of the Australian market with strong fundamentals with the aim of maintaining the elevated returns of recent years. Australia’s highest quality mid-caps are one such area. Rather than waiting for these future leaders to grow to higher weights in the ASX 200, forgoing their returns in the meantime, investors could look to increase their exposures now through AQLT Australian Quality ETF .
Chart 2: Solactive Australia Quality Select Index earnings expectations, June 2022 to August 2025

Source: Bloomberg. June 2022 to August 2025. Bloomberg analyst consensus forecast. Australian quality index represented by the Solactive Australia Quality Select Index, which is AQLT’s index. You cannot invest directly in an index. Actual results may differ materially from forecasts.
3 – Europe’s Growing Defence Bill
There has been a renewed push for defence self-sufficiency within Europe and the UK, providing potential spillover benefits for long term economic activity. Much of the increased spending will need to come from larger economies with the capacity to support domestic defence and related industries – notably Germany, France, and the UK.
Estimates from the Kiel Institute for the World Economy have suggested the potential for EU GDP to rise by 0.9% to 1.5% a year if governments meet new 3.5% NATO spending targets and move to buying home grown defence assets.
Chart 3: Estimated annual increase in European defence spending under NATO’s new 3.5% of GDP core defence commitment

Source: Goldman Sachs Investment Research, Company Filings, European Council, ECB Data Portal. 2025e are estimates. Scenarios are based on percentage of GDP spending using 2024 EU GDP. Actual results may differ materially from estimates and scenarios.
4 – Who are the other beneficiaries beyond the Magnificent 7?
Whilst the Magnificent 7 companies have become key beneficiaries from the AI hardware boom that has ensued in recent years, there are several Asian technology companies embedded in the AI supply chain which have done just as well.
Examples include Taiwan Semiconductor Manufacturing and SK Hynix which both play a crucial role in GPU production. Together, these companies capture more than half of Nvidia’s cost of goods sold.
Chart 4: Nvidia’s cost of goods sold by supplier
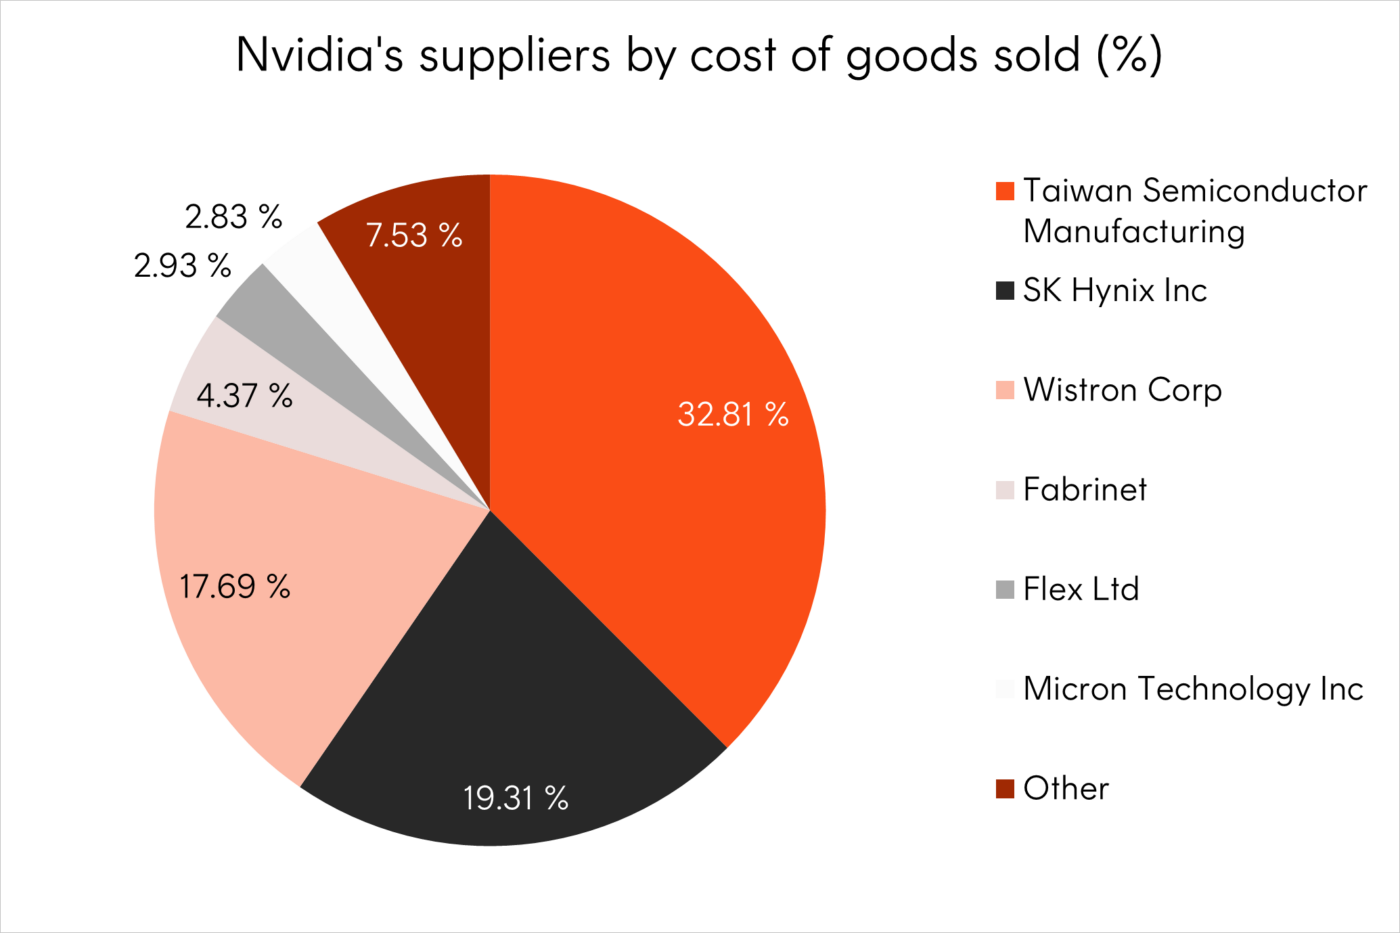
Source: Bloomberg. As at 9 July 2025.
5 – Strong dealmaking activity in cybersecurity
The evolving M&A environment has been a key driver of investor returns in the cybersecurity industry, particularly as enterprises look to streamline their operations and consolidate the number of security software licenses they have with various vendors.
Additionally, the resiliency of security software spending has become another driving force behind the strong levels of dealmaking activity we have seen in the cybersecurity industry.
Investors seeking exposure to the dynamic global cybersecurity ecosystem may consider HACK Global Cybersecurity ETF .
Chart 5: Major pure play cybersecurity companies in the Nasdaq Consumer Technology Association Cybersecurity Index (HACK’s Index) merged or acquired over the past 10 years
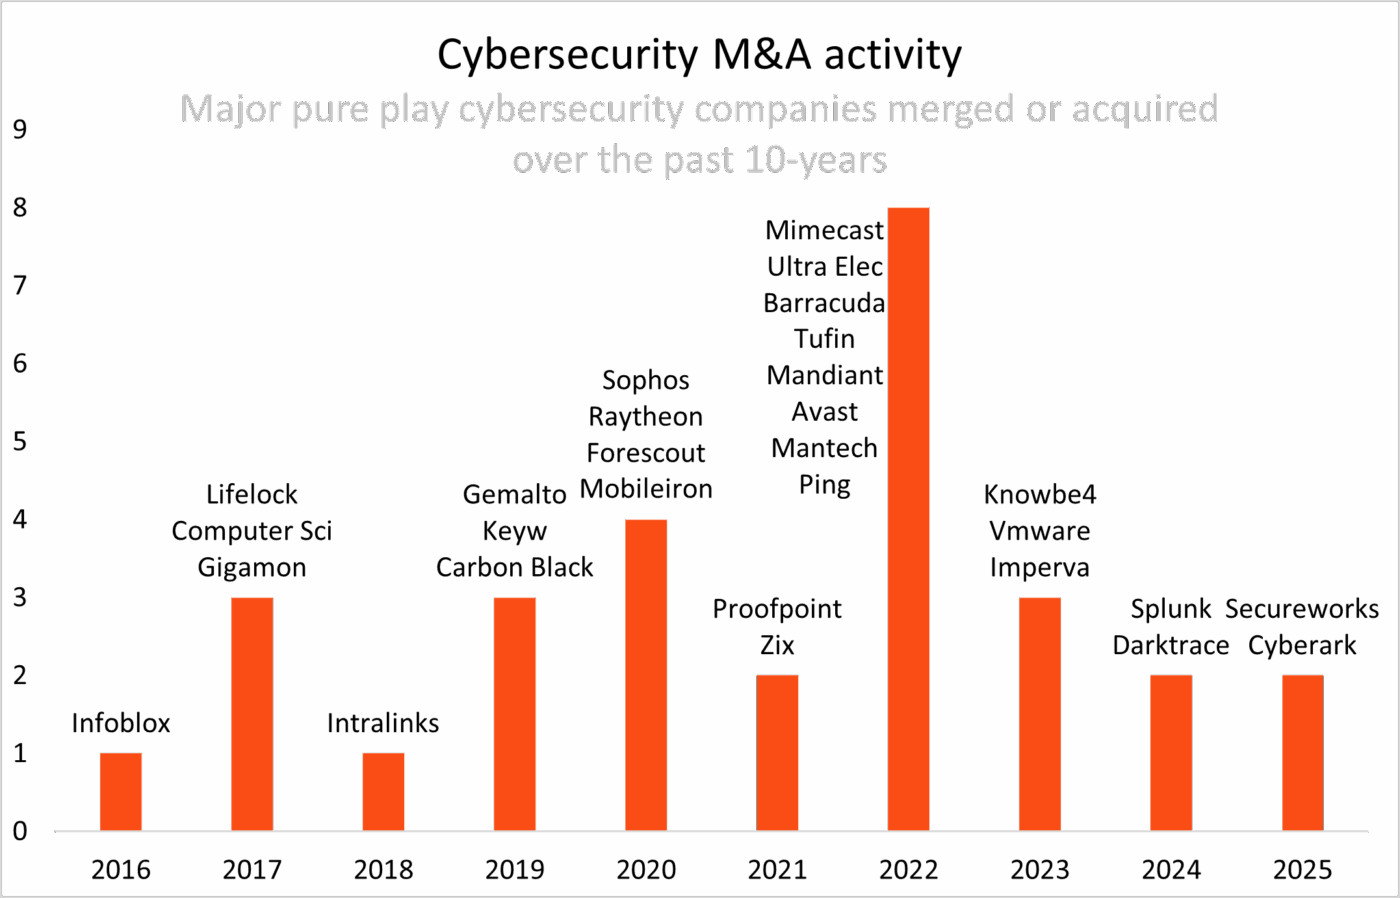
Source: Bloomberg and Tradar. As at 27 June 2025. Merger and acquisitions of companies in the Nasdaq Consumer Technology Association Cybersecurity Index.
That’s all for this edition of Charts of the Month. For more investment and market insights, visit the Betashares Insights page here.