
Chamath De Silva
9 minutes reading time
This information is for the use of licensed financial advisers and other wholesale clients only.
Commentary from the Betashares portfolio management desk by head of fixed income Chamath De Silva, providing an overview on fixed income markets.
Key points:
- How long duration issuance and yen weakness have combined with stronger growth to drive US yields higher
- Looking forward the issuance outlook, lower volatility, higher yields and market positioning are all potential catalyst for a rally
- With higher US deficits should we be worried about the return of the ‘bond vigilantes’
To say it’s been an eventful week in bonds would be an understatement. A trifecta of relatively dovish central bank meetings (BoJ, Fed, BoE) combined with a well-received Treasury refunding announcement (QRA) and a soft US payrolls print has potentially marked a short-term peak for global yields.
Before we assess the current state of play, it’s worth reviewing the recent sell-off, which pushed US yields to their highest levels in 15 years and real yields (i.e. inflation-adjusted) to their loftiest since 2009. This latest sell-off was distinguished by its bear-steepening nature, with several Treasury spread measures either un-inverting (e.g. 2s30s) or coming very close to it (2s10s).
A technical (and fundamental) story
In looking at the drivers behind the sell-off in bonds, a host of technical factors emerge, the most notable being supply indigestion.
The high levels of US government spending, unprecedented this deep into an economic expansion and against the backdrop of Fed QT, necessitated a significant rise in Treasury issuance in recent months. The specific catalyst for the recent sell-off was arguably a poorly received QRA in August, presenting a longer duration issuance composition than anticipated. The effect of issuance on bond yields is intricate, but crucially, for Treasuries, it’s not the dollar amount of issuance that matters but the amount of duration being supplied, as the latter must be absorbed by risk-sensitive balance sheets.
Besides the influx of more duration recently, complications arose from Japan. Yen weakness prompted authorities to pin USD/JPY at 150, necessitating the sale of reserves, notably Treasuries. This created a self-reinforcing loop: higher US Treasury yields pushing USD/JPY higher, compounded by the BoJ’s continued purchase of JGBs, mandated sales of USD reserves to support the JPY, with sales primarily in Treasuries, causing further upward pressure on US yields. Whether or not there is still actual intervention going on at 150 is now a moot point, given the market has anchored to it as the key level.
While supply factors were a headwind, they offer only a partial explanation. The fundamental story revolves around the US economy’s resilience amidst the most aggressive tightening cycle in a generation. A prime example was the Q3 GDP print showing the US economy grew by 4.9% annualised, possibly the sole major economy growing significantly above trend. This wasn’t unexpected as the closely watched Atlanta Fed GDPNow model had anticipated a hot CPI print for some time. However, the expansion’s drivers – robust consumer spending and inventory rebuilding – hint at a thriving US consumer and budding manufacturing rebound. The GDP report also followed a very strong jobs report for September, and while jobs growth moderated significantly in the most recent print, the labour market remains very strong.
Against this backdrop of robust activity, a strong labour market, and a Fed on hold, the bear-steepening sell-off was hardly surprising. This may have been made worse by an escalation of geopolitical tensions in the Middle East, which contributed to a push higher in inflation breakevens.
In Australia, the narrative resembled the US, with technicals combining with a hotter-than-expected Q3 CPI print to produce a local sell-off. The higher than expected trimmed mean CPI will prompt the RBA to upgrade its inflation forecasts in Friday’s Statement on Monetary Policy, and cemented a 25 basis point hike at this week’s meeting. Although the move wasn’t fully priced in by cash rate futures, the statement skewed dovish and it’s likely the local bond market will increasingly focus on global developments over the coming weeks.
Issuance was also a focal point here, marked by the new 30-year ACGB, the first ‘ultra’ issuance in three years. Such 30-year deals are significant in Australia, primarily because of their infrequency (unlike the US Treasury’s quarterly long bond issuance). This can lead dealers to take time digesting the supply, exerting additional steepening pressures and alongside the RBA now in-play, contributed to the Aussie-US 10-yr spread returning to positive territory.
It’s worth noting that while inflation remains sticky and the labour market relatively strong, we don’t have the extremely hot levels of economic activity as seen in the US, with real growth in Australia now below trend, with the RBA also forecasting below trend growth to continue.
Is a counter-trend short-covering rally now upon us?
Where does that leave us?
In my view, the November FOMC didn’t actually produce any major surprises. The key takeaway that markets jumped at was that Powell didn’t counter the notion that the bond market’s recent selloff might’ve done some of the Fed’s heavy lifting in tightening financial conditions, hinting the Fed might halt hikes.
This might change, particularly if an ensuing ‘everything rally’ inadvertently relaxes financial conditions, misaligning them with the Fed’s intended policy restraint. Nevertheless, a counter-trend rally seems likely, and even those most bearish on bonds and duration might admit Treasuries were possibly oversold in the short-term.
Moreover, with the upcoming QRA indicating a more bill-skewed issuance and the BoJ intimating a gradual normalisation (with the YCC tweak merelshort coveringg from a strict 10yr JGB yield ceiling of 1% to a flexible one), there are catalysts for a significant short-term rally on the back of a moderation in rate vol and short-covering from CTAs that have amassed large short positions in Treasury futures.
The moves across asset markets over the past three sessions have been substantial, leading to the largest weekly easing in Goldman Sachs’ US financial conditions index in a year. If this “everything rally” continues, it will be due to a renewed narrative shift combining the goldilocks outcomes of a soft landing with a Fed pause. While most of the key risk events this month are now in the rearview window, which should help rate volatility further moderate, it’s worth knowing we still have a CPI print to get through, so any euphoria might be short-lived if the October print were to confirm a reacceleration in headline pressures.
The bigger picture
Looking beyond the next few months, the elephant in the room is the elevated level of US government spending. It’s unprecedented to witness such pro-cyclical fiscal policy, with the deficit reaching 8% of GDP in Q2, and still around 6% despite strong private sector growth. Numerous drivers, including the Inflation Reduction Act, the CHIPS Act, and cost of living adjustments on social security payments, have underpinned both consumption and investment. They might even support a resurgence in inflation pressures and inflation expectations if the Fed overly relaxes financial conditions. Many are discussing the notion of ‘fiscal dominance’, wherein the central bank becomes subordinate to fiscal authorities. While it’s perhaps too early to make this conclusion, such a narrative will gather momentum if spending remains elevated outside a recessionary period.
Whether the so-called ‘bond vigilantes’ of yesteryear return to the US Treasury market is debatable. While a 2022 gilt-style crisis shouldn’t be discounted, the Fed would likely intervene promptly should Treasury market trading turn dysfunctional. The bear steepening we saw, while significant, wasn’t disorderly and was arguably supported by fundamentals.
Even though Treasury issuance and government spending will likely remain topical for some time, I don’t believe the US government will face funding challenges, simply by the nature of how the US financial system is set up. For sovereign bond investors, the focal point should be the macro fundamentals, and not short-term technical blips. As long as a government issues debt in its currency, it should always manage its funding (given the central bank and regulated entities like banks and insurance companies can always be compelled to hold bonds if push came to shove).
Fiscal policy matters fundamentally matters for bond yields not because there’s more issuance to digest, but because it drives nominal economic growth. For long-term US Treasury and Australian government bond yields, it’s not issuance volumes that matter over the long-term, but rather how growth and inflation expectations influence the long-run neutral policy rate and how the volatility of the macro fundamentals influences the term premium.
However, accelerating government issuance might have an enduring impact on issuers lower in the pecking order, potentially crowding out corporates and other issuers of USD debt. As we’re still some time away from a major corporate debt maturity wall, credit spreads are yet to be meaningfully impacted, but as we move into 2024, that may well change.
While the focus of this update is on rates, it’s important not to forget the credit story, as slow moving as it is, and I’ll turn my attention to that in next month’s update.
Chart 1: US 10-year Treasury Yield
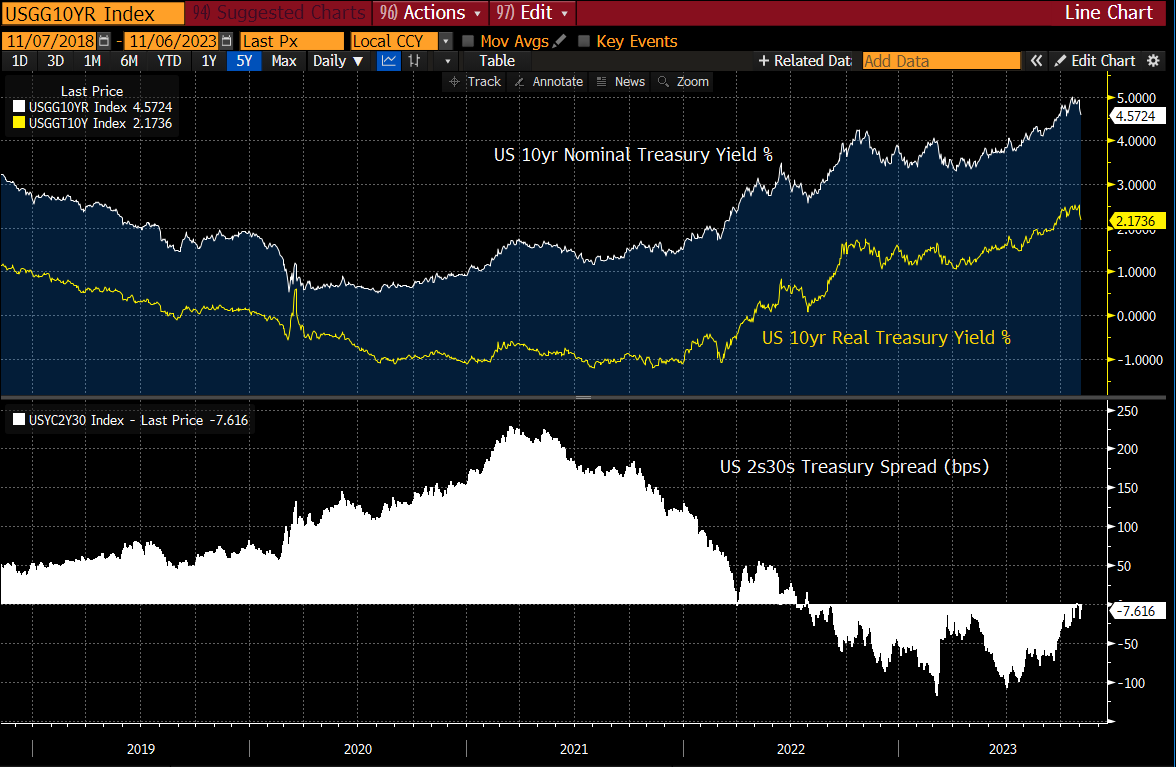
Source: Bloomberg
Chart 2: US yields and USD/JPY
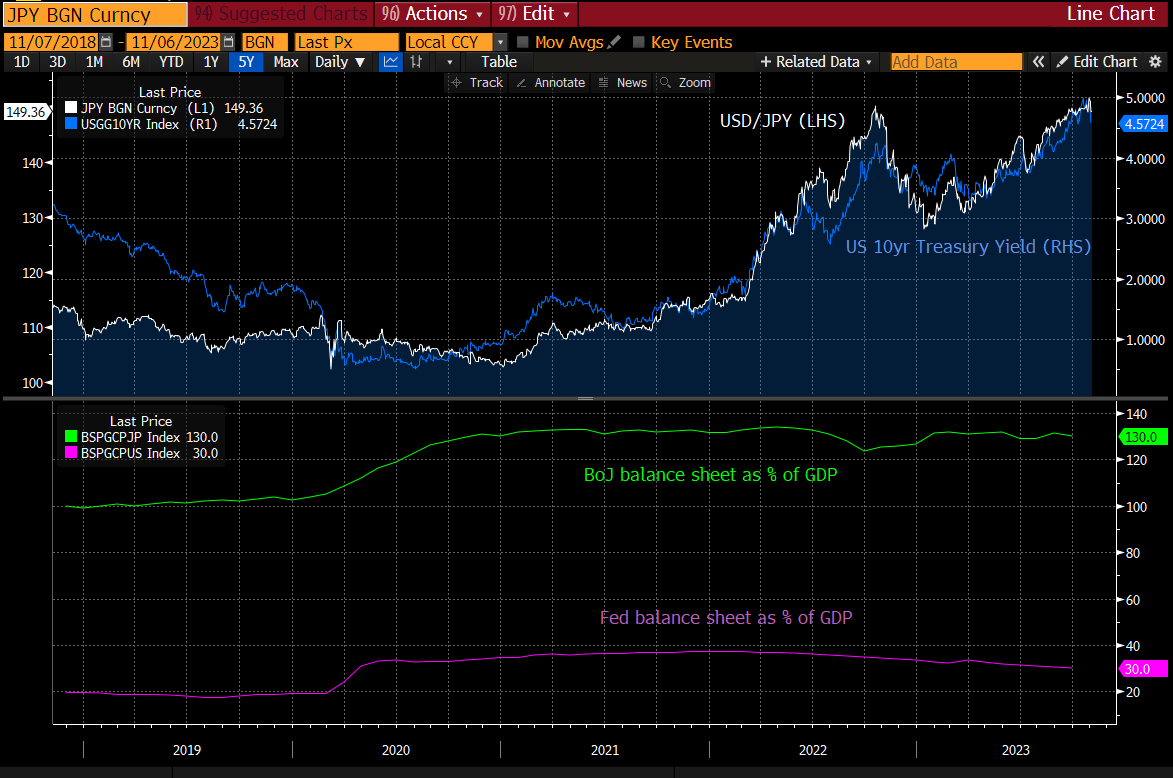
Source: Bloomberg
Chart 3: Australia-US 10yr Yield Spread
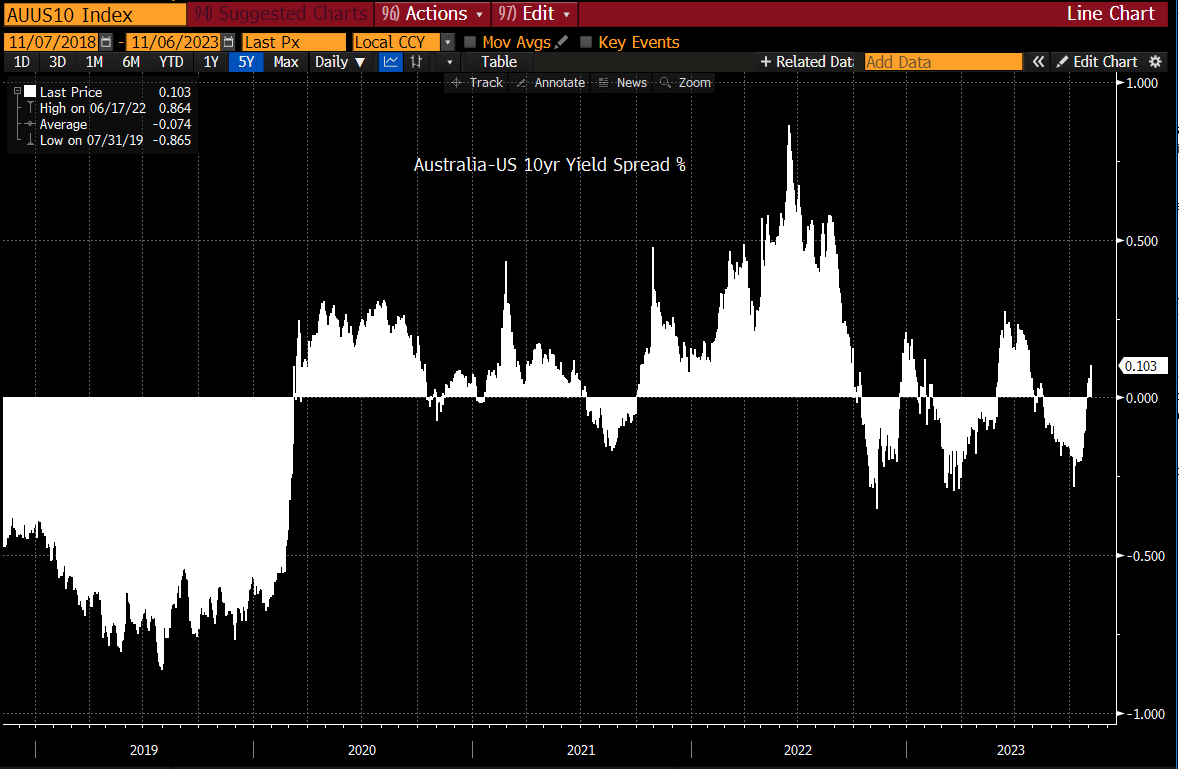
Source: Bloomberg
Chart 4: Weekly USD returns in various markets
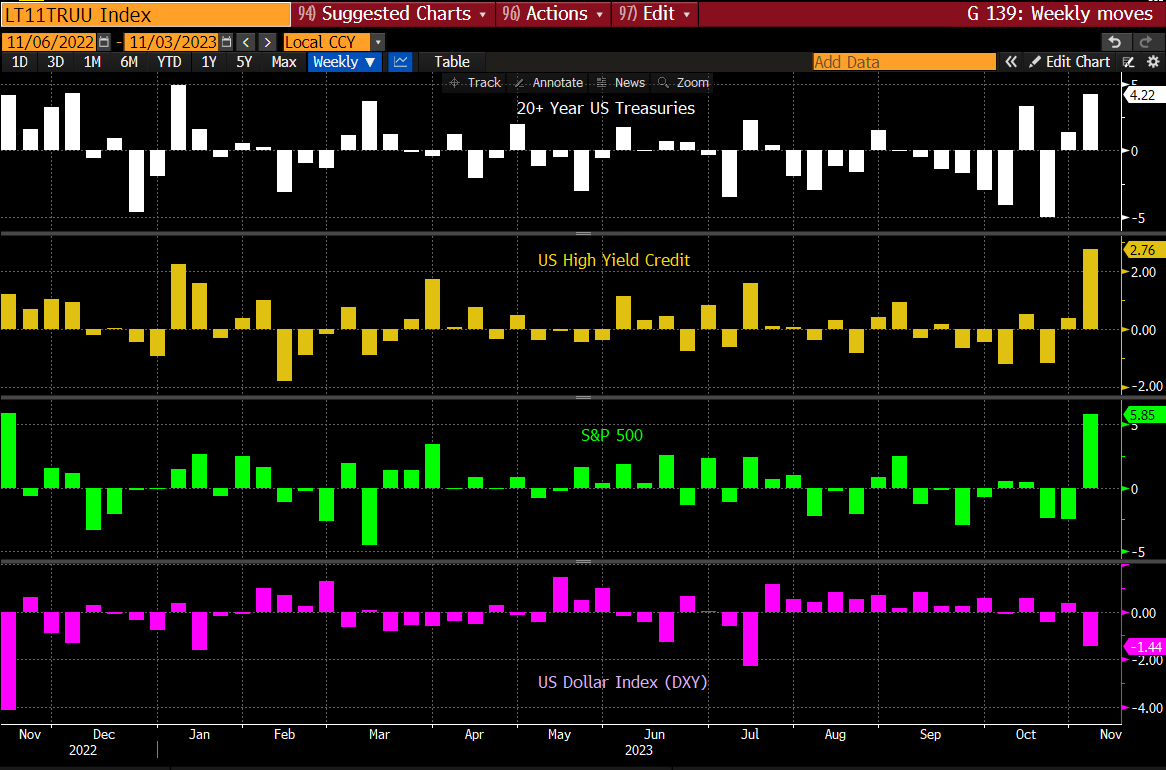
Source: Bloomberg
Chart 5: Goldman Sachs US Financial Conditions Index
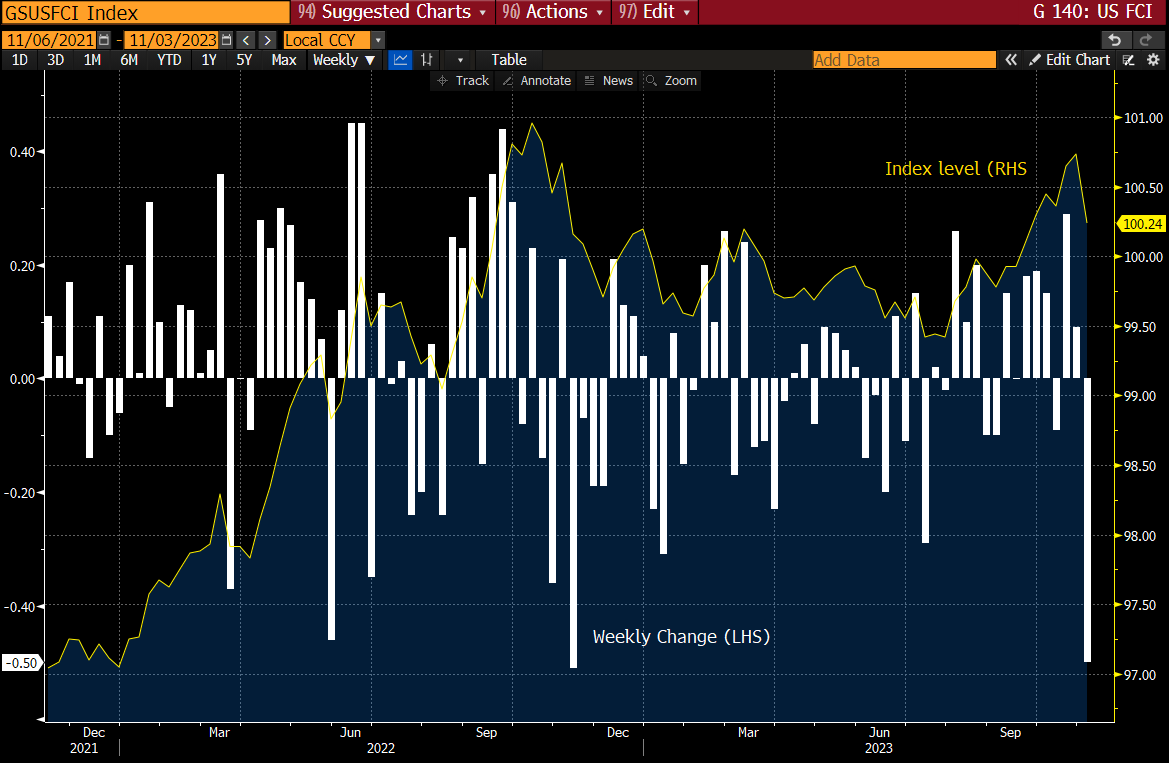
Sources: Goldman Sachs, Bloomberg
Chart 6: Spec positions in US Treasury Futures
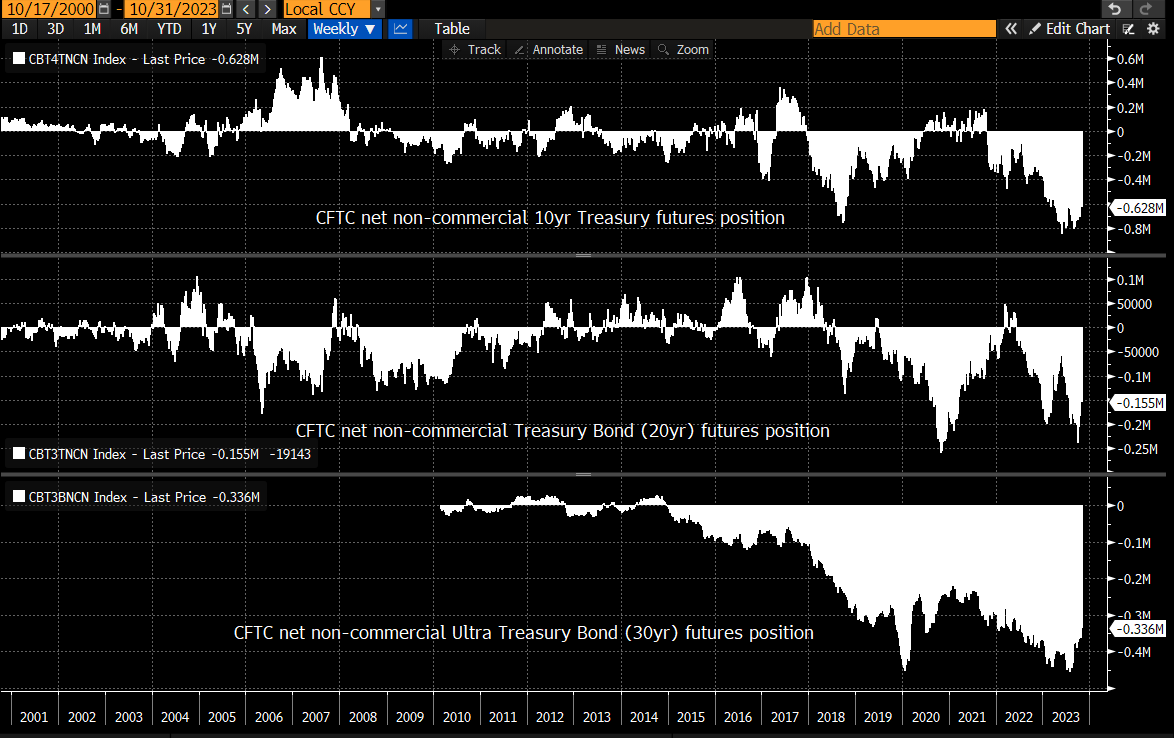
Sources: CFTC, Bloomberg
Chart 7: US federal budget deficit as % of GDP
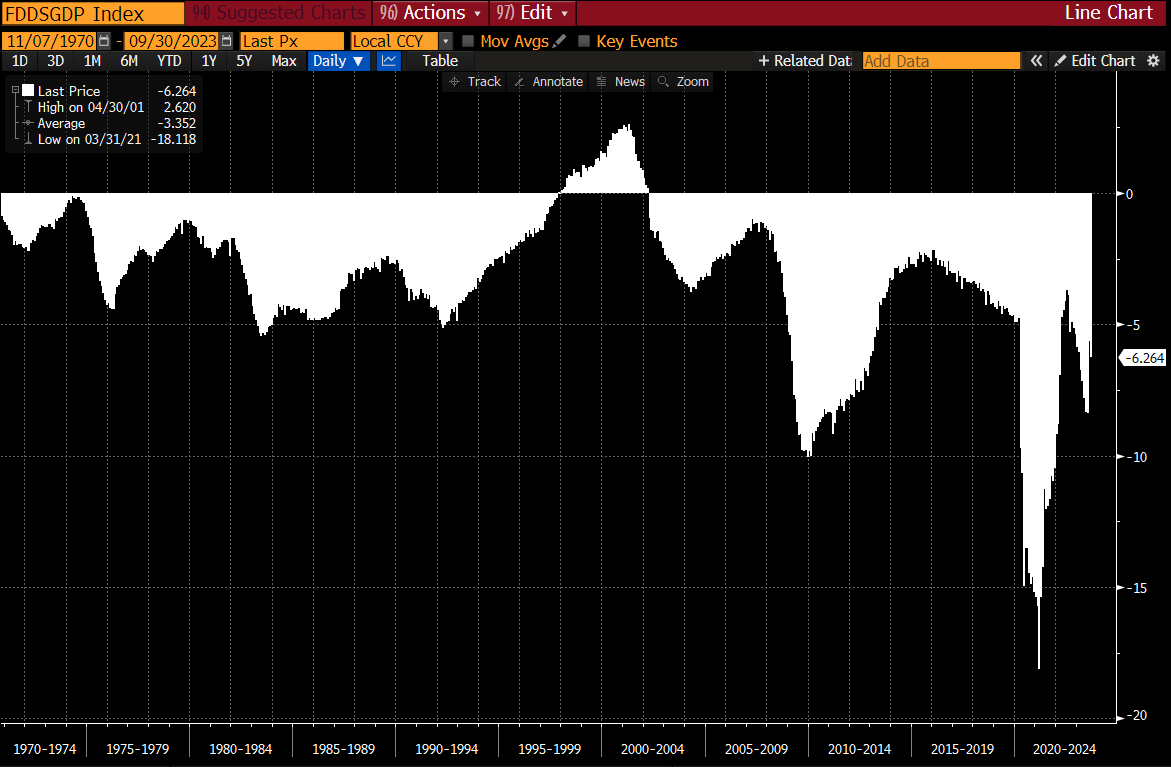
Sources: US Treasury, Bloomberg