
Parker Guan
6 minutes reading time
There’s never a bad time to talk about performance.
Since inception, HCRD Interest Rate Hedged Australian Investment Grade Corporate Bond ETF ’s index has delivered an outstanding 8.99% p.a. return (net of HCRD’s management fee) with just 1.27% annualised volatility. As at 30 May 2025, it has topped the league table in our closely watched fixed income universe.
Not only has it outperformed its older sibling CRED Australian Investment Grade Corporate Bond ETF ’s index (8.60% p.a.), but also our major bank hybrid and subordinated debt ETFs.
Over the same period, generic bond indices struggled. For example, the Bloomberg AusBond Composite Index, which returned 4.14% p.a. even lagged our cash fund AAA Australian High Interest Cash ETF at 4.23% p.a.
|
Index Returns (except for AAA) |
Total Return % p.a. |
Volatility % p.a. |
|
Betashares Fund Indices |
||
|
Solactive Australian Investment Grade Corporate Bond Select DH Index (HCRD’s index) |
8.99% |
1.27% |
|
Solactive Australian Investment Grade Corporate Bond Select TR Index (CRED’s index) |
8.60% |
5.75% |
|
Solactive Australian Major Bank Subordinated FRN Index (BSUB’s index) |
7.04% |
0.73% |
|
Solactive Australian Banking Preferred Shares Net TR Index (BHYB’s index) |
5.16% |
2.37% |
|
Betashares Australian High Interest Cash ETF (ASX: AAA) |
4.23% |
0.16% |
|
Generic Bond Indices |
||
|
BBG AusBond Credit 0+ Index |
6.31% |
2.89% |
|
BBG AusBond Credit FRN 0+ Index |
5.35% |
0.28% |
|
BBG AusBond Composite 0+ Index |
4.14% |
4.65% |
Source: Bloomberg. Betashares funds’ performance shown are index returns (except for AAA) and are net of management fees and costs. Generic Bond Indices’ performance shown do not take into account any management fees and costs. All index performance shown are based on the same period from 14 November 2022 to 30 May 2025. AAA’s performance is based on the NAV total returns of the fund. BHYB’s index performance are net of franking credits. You cannot invest directly in an index. Past performance is not an indicator of future performance of any index or ETF.
While HCRD has shown strong historical performance, the natural question is: what’s next?
HCRD was launched into a “perfect” environment for credit markets. Since then, AUD investment grade corporate bond spreads have compressed over 100 basis points.
Some may argue, much of the “easy” gain is behind us, as AUD corporate bond spreads approach a very tight level in recent memory. However, if we expand the chart to a longer horizon, it may seem the cycle could have further room to run, especially after the recent “Liberation Day” event.
Looking at the below chart, the current AUD credit spread level is still above its historical lows and present a better relative value proposition than its US equivalents. This is supported by a strong macro backdrop in Australia and, of late, strong investor appetite for AUD credits from investors in Asia.
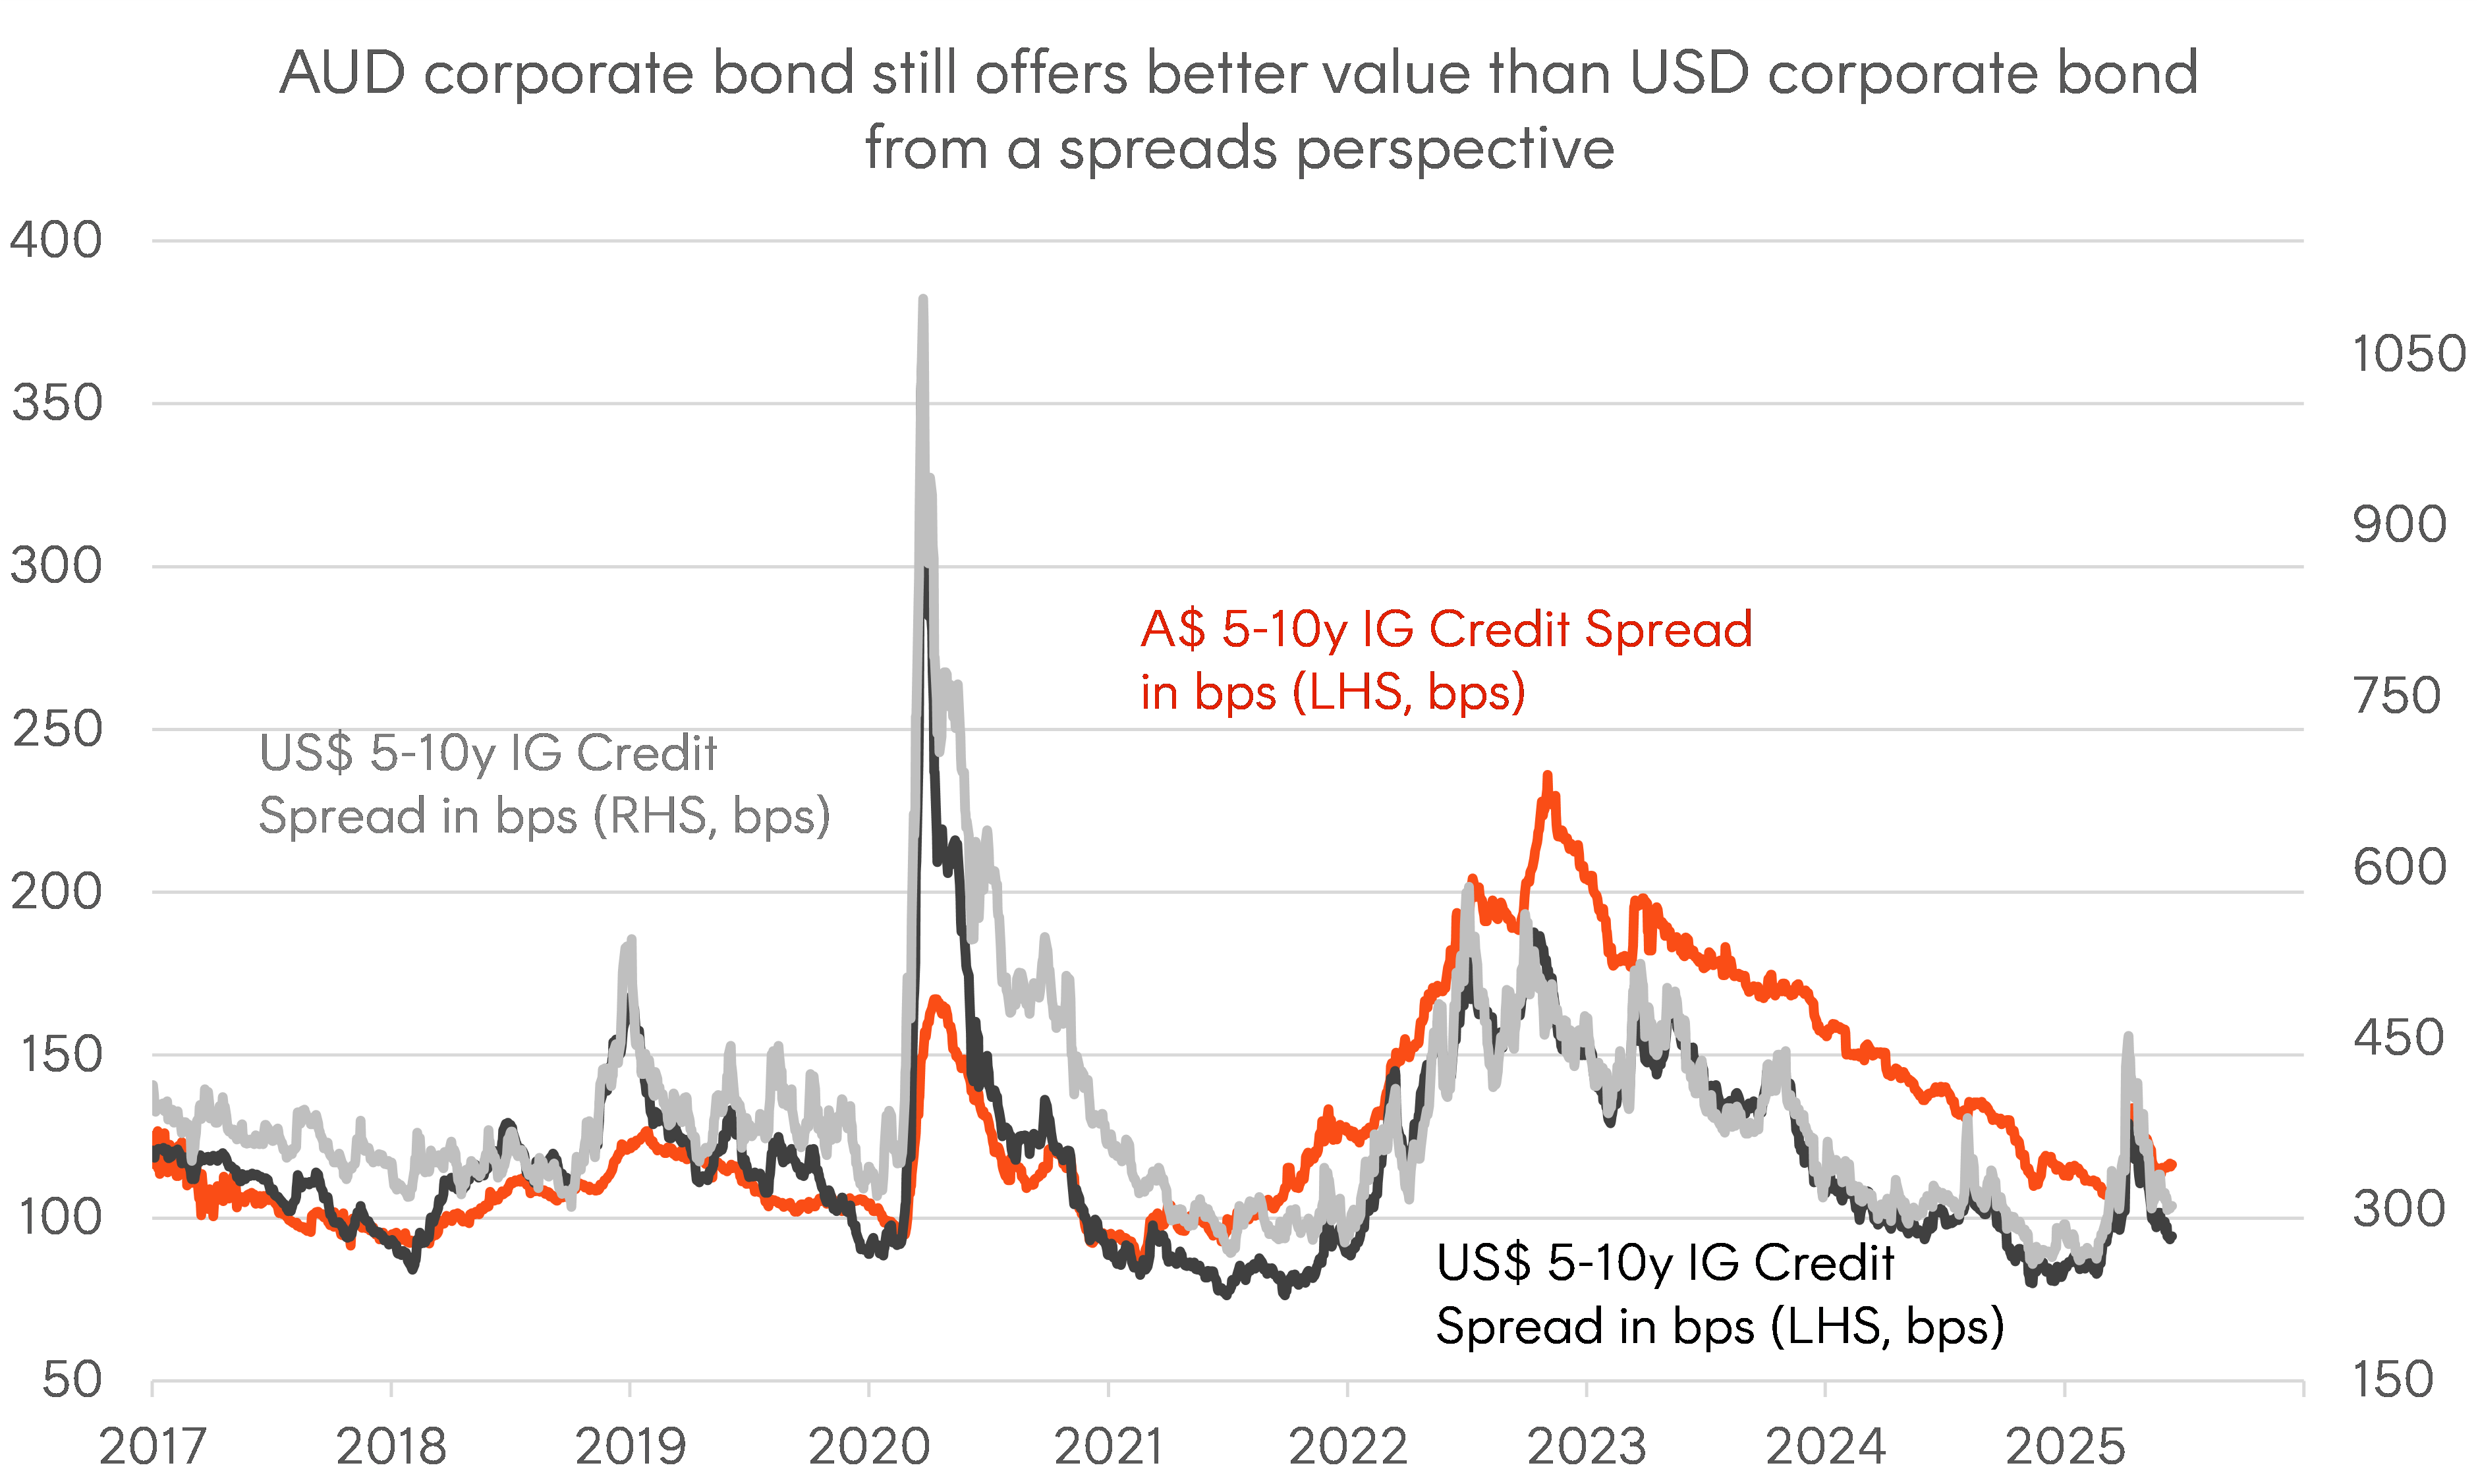
Source: Bloomberg. As at 30-May-2025. Credit spreads are defined by option-adjusted spreads against equivalent government bonds. Past performance is not an indicator of future performance.
While credit spread compression played a key role in HCRD’s historical performance, the main driver has been the portfolio yield carry. It is true HCRD was designed to be a pure investment exposure to the credit markets, in which case credit spreads matters a lot for the performance of the fund.
Too often people forget, for fixed income securities, income usually is the dominant source of return, not capital gains. Notably from HCRD’s attribution analysis below, the majority of HCRD’s total return (roughly 70%) was generated from the portfolio income component (yield carry), while the remaining 30% came from the “once in a lifetime” credit spread compression.
Even without further credit spread compressions, HCRD has the potential to generate good performance by getting exposure to high-yielding AUD corporate bonds through CRED, thanks to its smart-beta indexing approach.
|
Per annum |
CRED |
HCRD |
|
Average portfolio yield (p.a.) |
6.23% |
5.95% |
|
Value changes from Government bond yield (p.a.) |
-0.97% |
0.18% |
|
Value changes from credit spread |
3.08% |
2.95% |
|
Curve roll down return |
1.01% |
0.97% |
|
Fund Management Fees and Costs |
-0.25% |
-0.29% |
|
Total |
8.86% |
9.41% |
Source: Bloomberg and Betashares. Period 14 November 2022 to 30 May 2025. Attribution analysis conducted by Betashares based on the Net Asset Value of Betashares Interest Rate Hedged Australian Investment Grade Corporate Bond ETF (ASX: HCRD) and Betashares Australian Investment Grade Corporate Bond ETF (ASX: CRED). All numbers are annualised. Average portfolio yield is Yield to Worst (YTW) and represents the annualised total expected return of a Fund’s portfolio if the underlying bonds are held to maturity or called and do not default, and the coupons are reinvested at the YTM. Government bond yield is the YTW of the benchmark 10-year government bonds. Credit spreads are defined by option-adjusted spreads against equivalent government bonds. Curve roll down return is estimated where holdings weights in different bond maturity buckets are applied to the average duration of the sector or issuer curve. Assumes that the yield compression follows the current yield curve shape over the next 12 months. Past performance is not an indicator of future performance. Yields are subject to change.
Looking forward, with RBA expected to cut benchmark cash rates 3 more times this year*, there is a case to be argued for a duration exposure. For investors who can extend duration, CRED can be a great implementation vehicle. However, for those who prefer floating-rate exposures and investors who want to redeploy maturing bank hybrid capital, HCRD remains a viable solution.
Subordinated debt, so far, has emerged as the go-to replacement trade for bank hybrids, but it’s worth reminding investors, it is not the only game in town. As it currently stands, HCRD offers similar credit spread and outright yield levels to BSUB Australian Major Bank Subordinated Debt ETF , albeit being a senior bond exposure. However, what sets HCRD apart is the additional roll-down yield inherent in its smart-beta index which targets the steepest part of the AUD corporate bond curve, of around 5 to 10 years currently, see chart below. The additional 0.75% estimated roll return for HCRD compared to BSUB’s 0.45%**, is likely to put HCRD ahead of subordinated debt exposures.
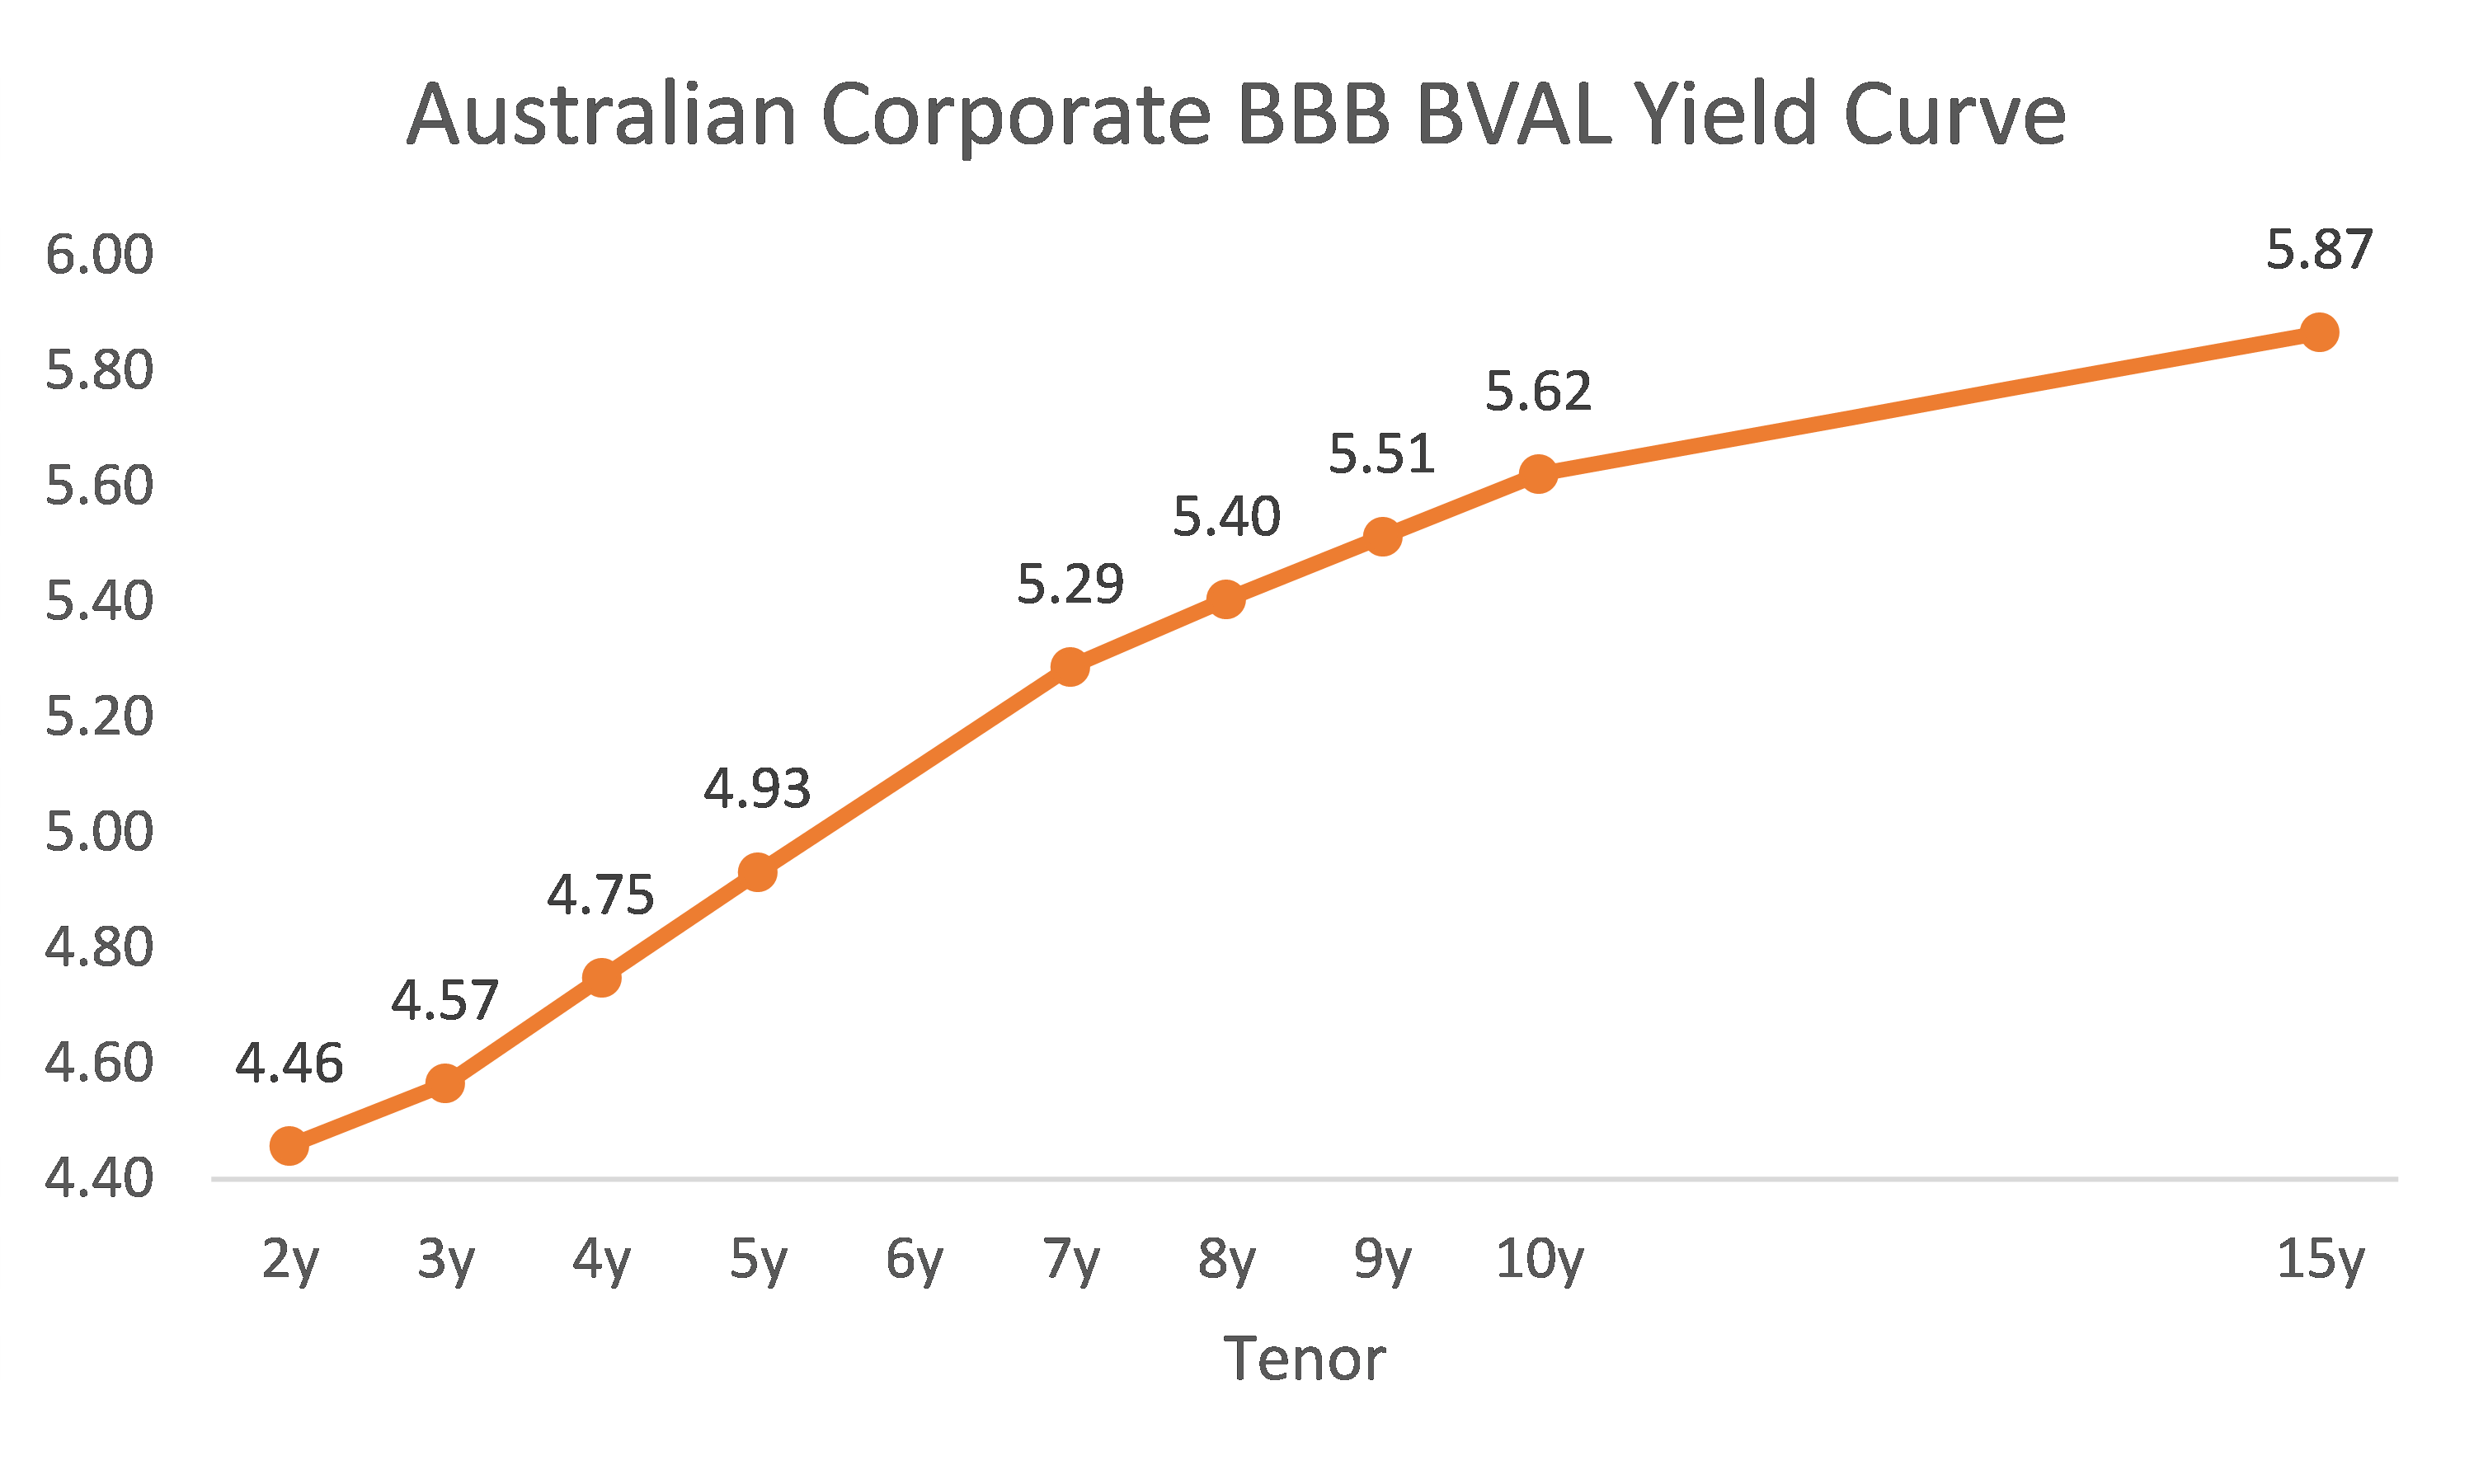
Source: Bloomberg. As at 13-Jun-2025; AUD Australian Corporate BBB BVAL Yield Curve. Curve roll down return is estimated where holdings weights in different bond maturity buckets are applied to the average duration of the sector or issuer curve. Assumes that the yield compression follows the current yield curve shape over the next 12 months. Yields, duration and ratings are subject to change.
Disclaimer:
This information is for the use of licensed financial advisers and wholesale clients only. It must not be distributed to retail clients.
Future results are inherently uncertain. This information may include opinions, views, estimates and other forward-looking statements which are, by their very nature, subject to various risks and uncertainties. Actual events or results may differ materially, positively or negatively, from those reflected or contemplated in such forward-looking statements. To the extent permitted by law Betashares accepts no liability for any loss from reliance on this information.
There are risks associated with an investment in HCRD, including interest rate hedging risk, credit risk, market risk and index tracking risk. Investment value can go up and down. An investment in HCRD should only be considered as a part of a broader portfolio, taking into account your particular circumstances, including your tolerance for risk. For more information on risks and other features of HCRD, please see the Product Disclosure Statement and Target Market Determination, both available on this website.