

Betashares
3 minutes reading time


ETF industry on the cusp of $300 billion milestone after strong inflows
- Elevated inflows, combined with positive market performance, pushed the Australian ETF industry to a new record high of $299.4B in funds under management– a rise of $10.2B or 3.52%
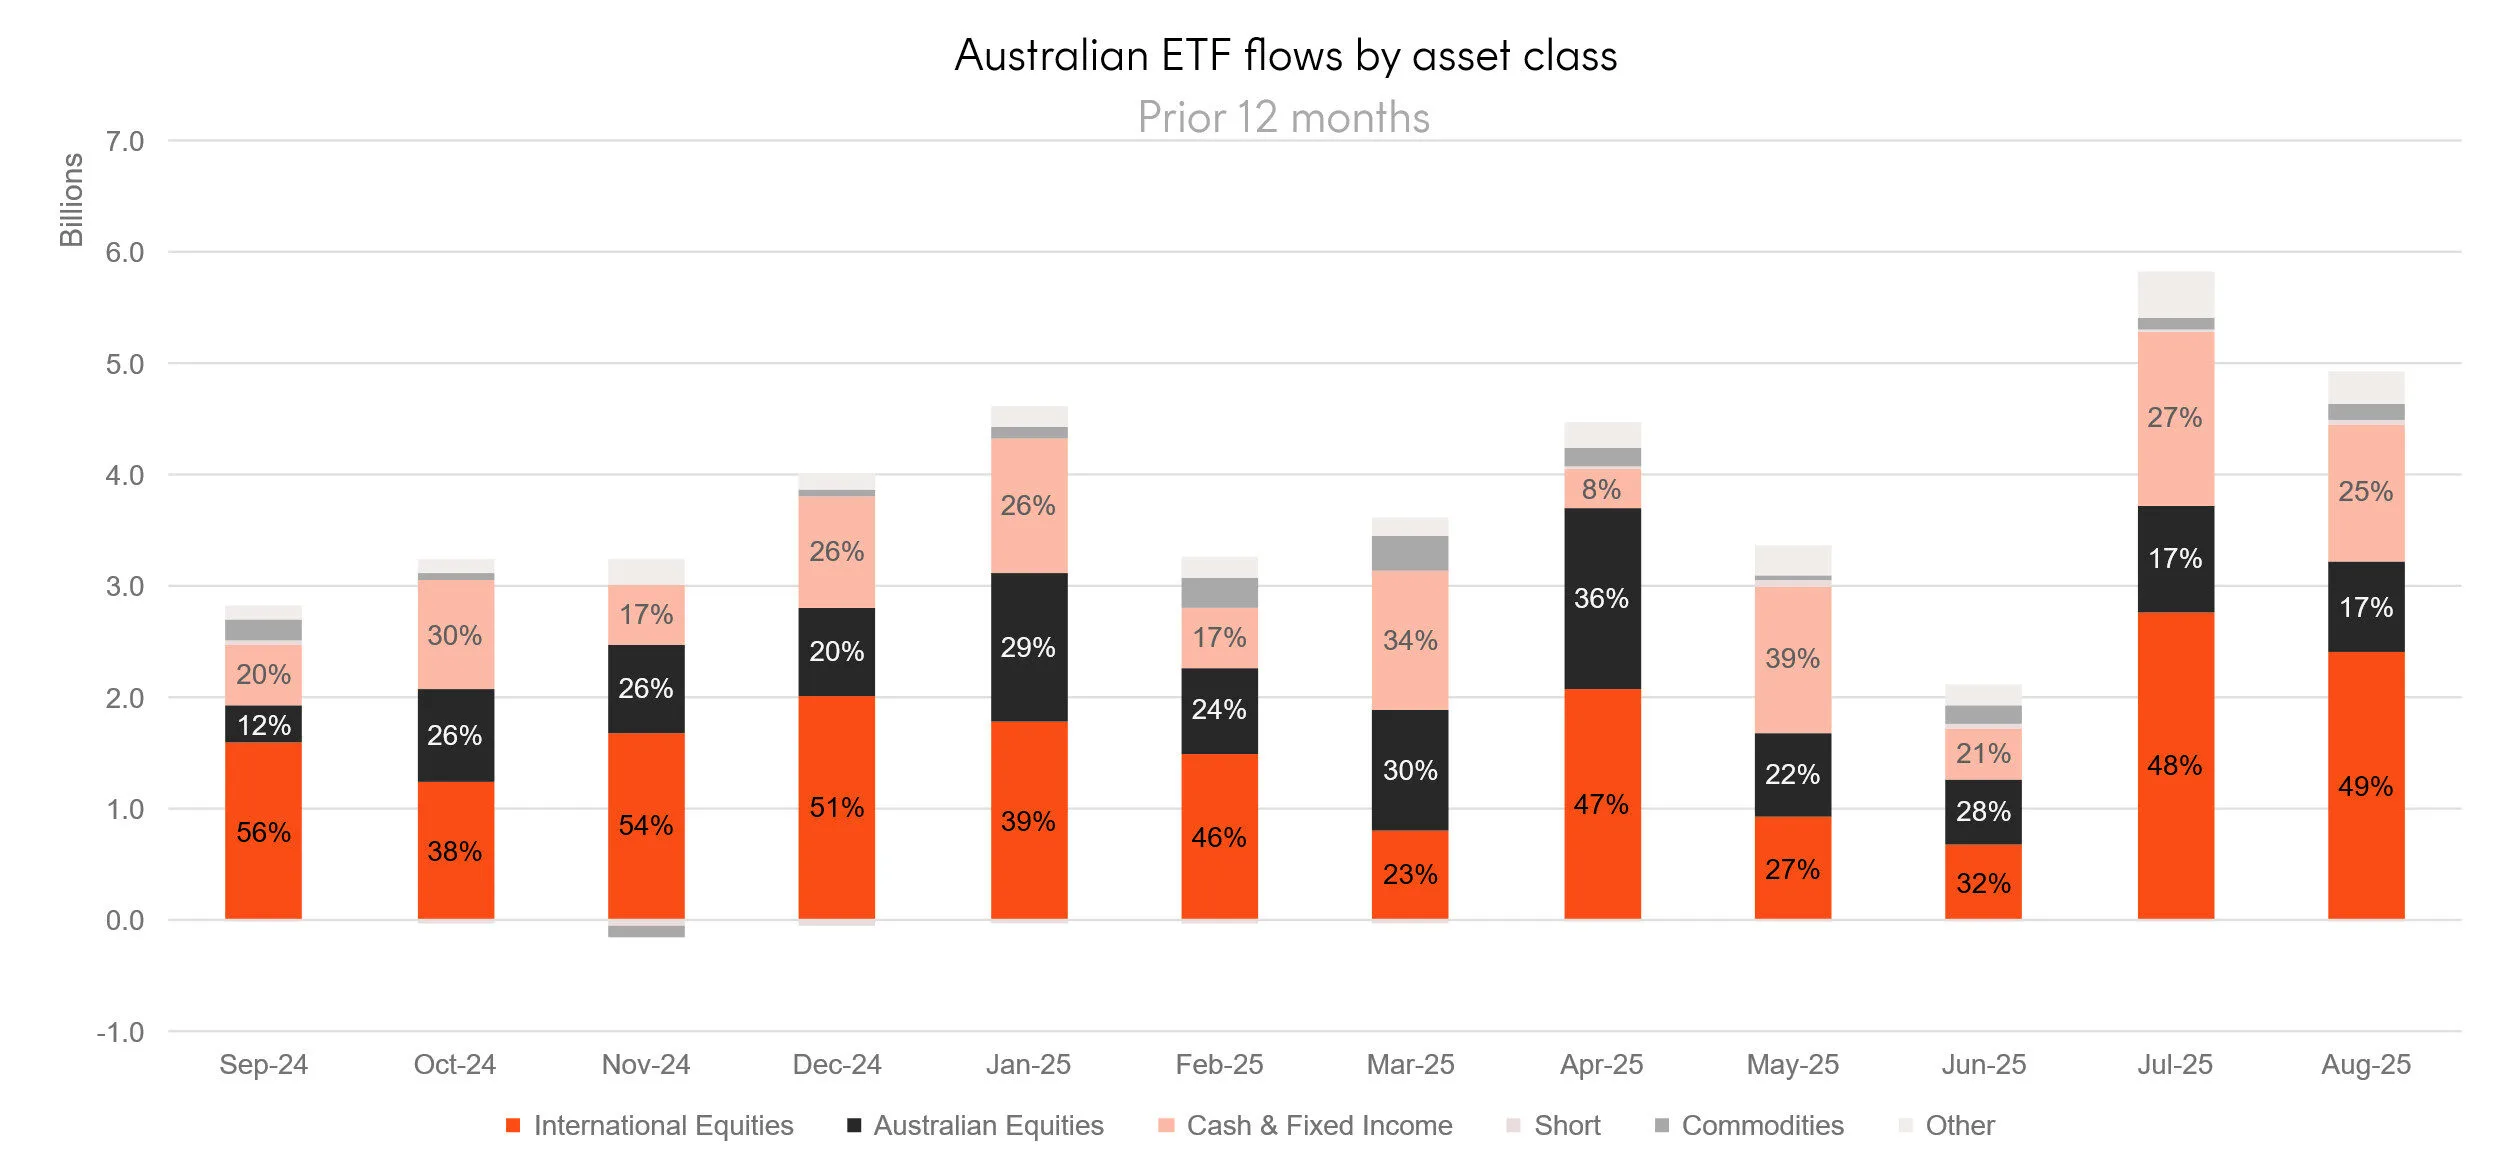
- Industry inflows for the month were an elevated $4.9B – the second highest amount on record, although down on the record $5.8B of inflows last month
- ASX trading value was ~$15B in August – an elevated level but less than the record set in May this year
- Over the last 12 months the Australian ETF industry has grown by 36%, or $79.2B
- Product development returned with 6 new funds launching in August – including a High Yield Australian Shares Fund (ASX: HYLD) , an Emerging Markets Equity Fund (ASX: BEMG) and a Global Bond Fund (ASX: WBND)
- Global gold miner ETFs, including the Betashares Global Gold Miners – Currency Hedged ETF (ASX: MNRS), were the best performers last month
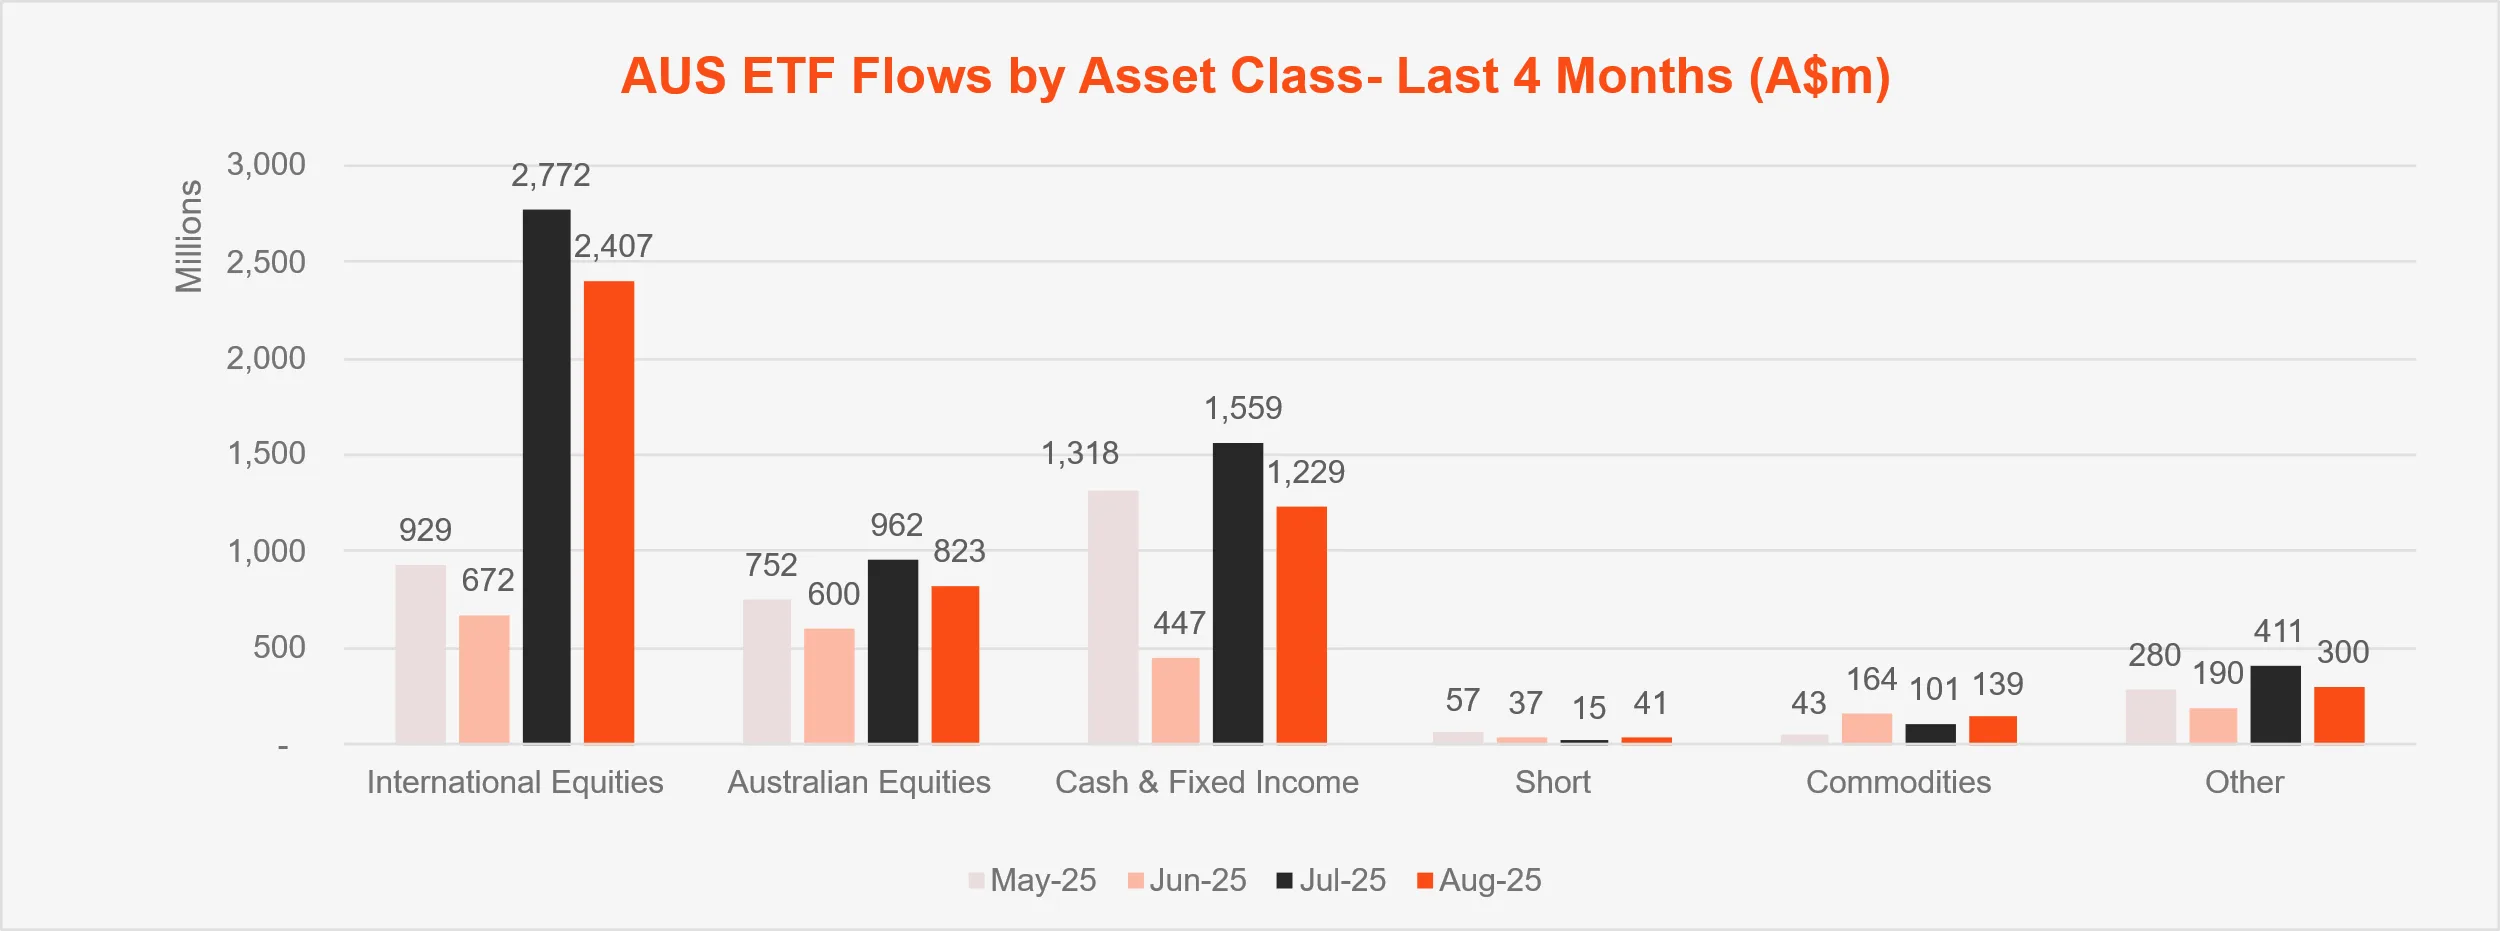
- International Equity ETFs continued their streak of receiving the highest level of flows with $2.4b, while Fixed Income ($1.2b) took second, followed by Australian Equities ($823m) in third.
Australian ETF Industry AuM: July 2001 – August 2025
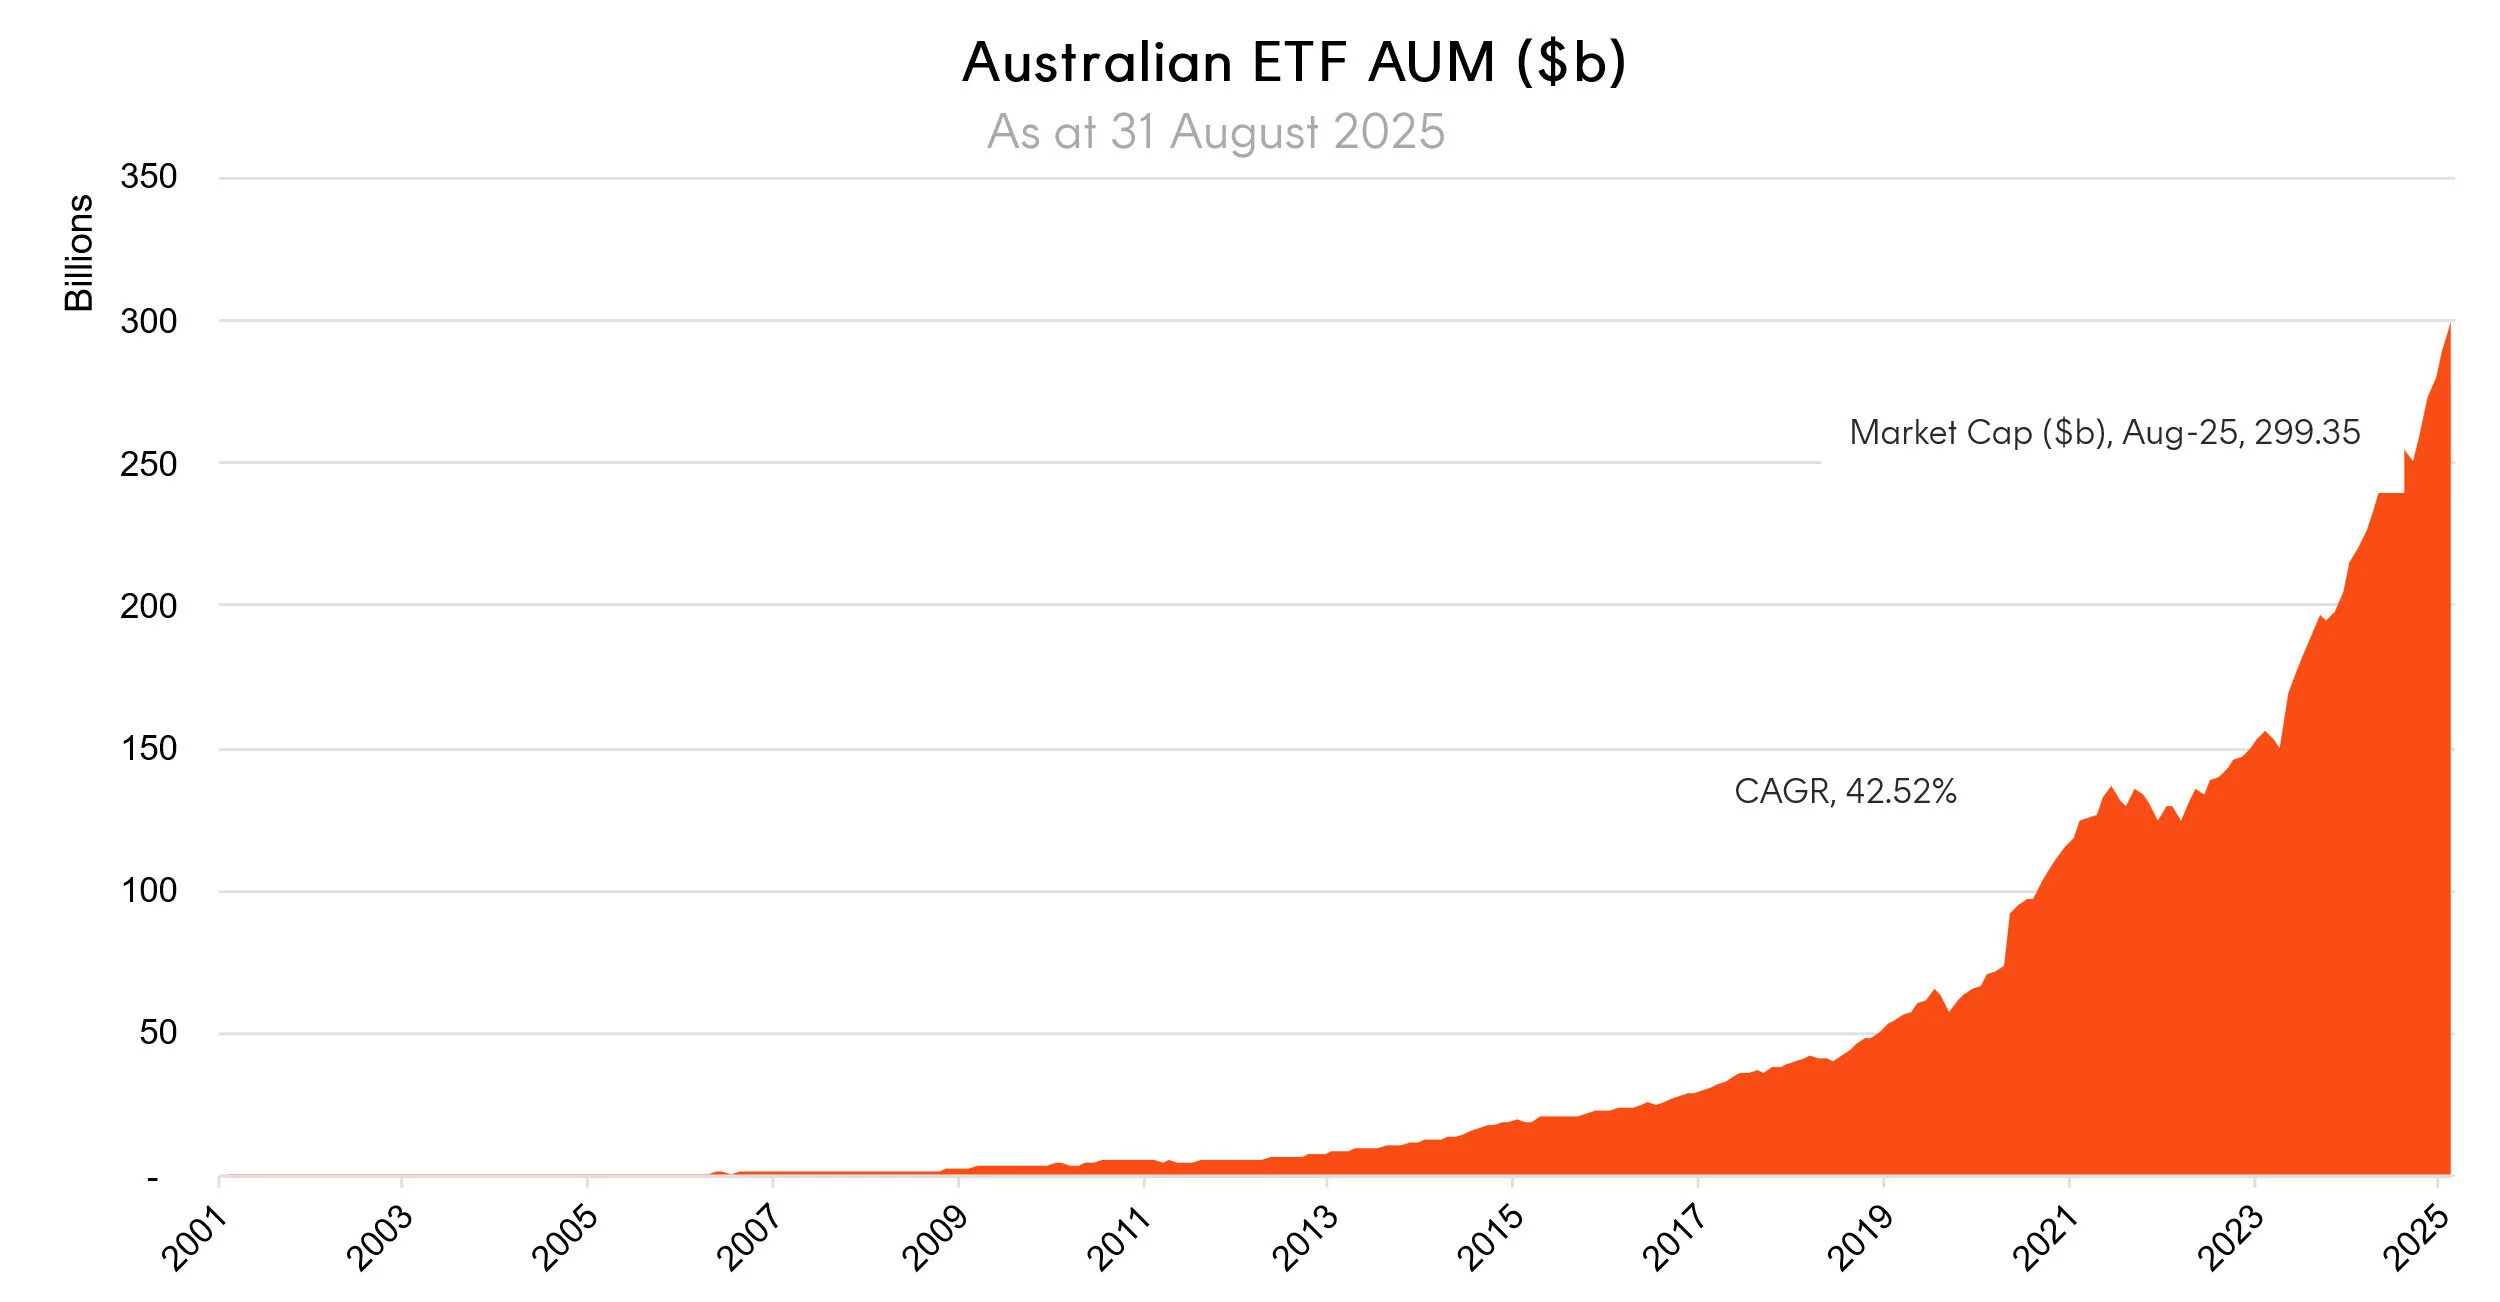
CAGR: Compound Annual Growth Rate. Source: ASX, CBOE
Market Cap
- Australian Exchange Traded Funds Market Cap (ASX + CBOE)$299.4B – all time high
- ASX CHESS Market Cap: $255.67B[1]
- Market Cap change for July: 3.52%, $10.2B
- Market cap growth for last 12 months: 36%, or $79.1B
New Money
- Net inflows for month: $4.9B
Products
- 436 Exchange Traded Products trading on the ASX & CBOE
- 6 new funds were launched in August – including a High Yield Australian Shares fund, an Emerging Markets Equity Fund and a Global Bond Fund
Trading Value
- ASX trading value was ~$15B in August
Performance
- Global gold miner ETFs, including MNRS Global Gold Miners Currency Hedged ETF, were the best performing funds last month
Industry Net Flows
Top Category Inflows (by $) – Month
|
Broad Category |
Inflow Value |
|
International Equities |
$2,406,641,783 |
|
Fixed Income |
$1,196,770,226 |
|
Australian Equities |
$823,262,751 |
|
Multi-Asset |
$216,522,883 |
|
Commodities |
$138,795,008 |
Top Sub-Category Inflows (by $) – Month
|
Sub Category |
Inflow Value |
|
International Equities – Developed World |
$1,174,940,817 |
|
Australian Bonds |
$779,849,576 |
|
Australian Equities – Broad |
$688,787,738 |
|
International Equities – US |
$505,296,310 |
|
Global Bonds |
$393,219,903 |
Top Category Outflows (by $) – Month
No outflows recorded by broad category
Top Sub-Category Outflows (by $) – Month
|
Sub-Category |
Inflow Value |
|
Australian Equities – Geared |
-$31,177,336 |
|
Australian Equities – Sector |
-$18,443,075 |
|
International Equities – E&R – Sustainability |
-$9,591,885 |
|
Australian Equities – Large Cap |
-$5,832,502 |
|
International Equities – Geared |
-$2,886,524 |
Performance
Top Performing Products – Month
|
Ticker |
Product Name |
Performance (%) |
|
GDX |
VanEck Gold Miners ETF |
19.70% |
|
MNRS |
Betashares Global Gold Miners Currency Hedged ETF |
19.33% |
|
GMTL |
Global X Green Metal Miners ETF |
16.60% |
|
DRGN |
Global X China Tech ETF |
15.15% |
|
QETH |
Betashares Ethereum ETF |
14.25% |