



Investing $200 a fortnight may not sound like the start of a wealth story. It’s $5,200 a year, or $52,000 over a decade. Stashed under a mattress, that’s exactly what you’d have at the end, and it would be worth less if you account for inflation.
However, if that money was invested in Australian shares with dividends reinvested, historical returns suggest it could become a good deal more.
Here’s what the numbers show, and what changes when return, risk and routine change.
The base case
Over the 30 years to 30 June 2026, Australian shares returned 9% a year, based on the S&P/ASX All Ordinaries Total Return Index1. That index tracks around 500 of the largest companies on the ASX and assumes every dividend is reinvested.
Apply 9% a year to $200 every fortnight and after 10 years you could have roughly $82,400. You’d have contributed $52,000, while the other $30,400 would be investment growth.
By year 10, investment growth would account for more than a third of the balance.
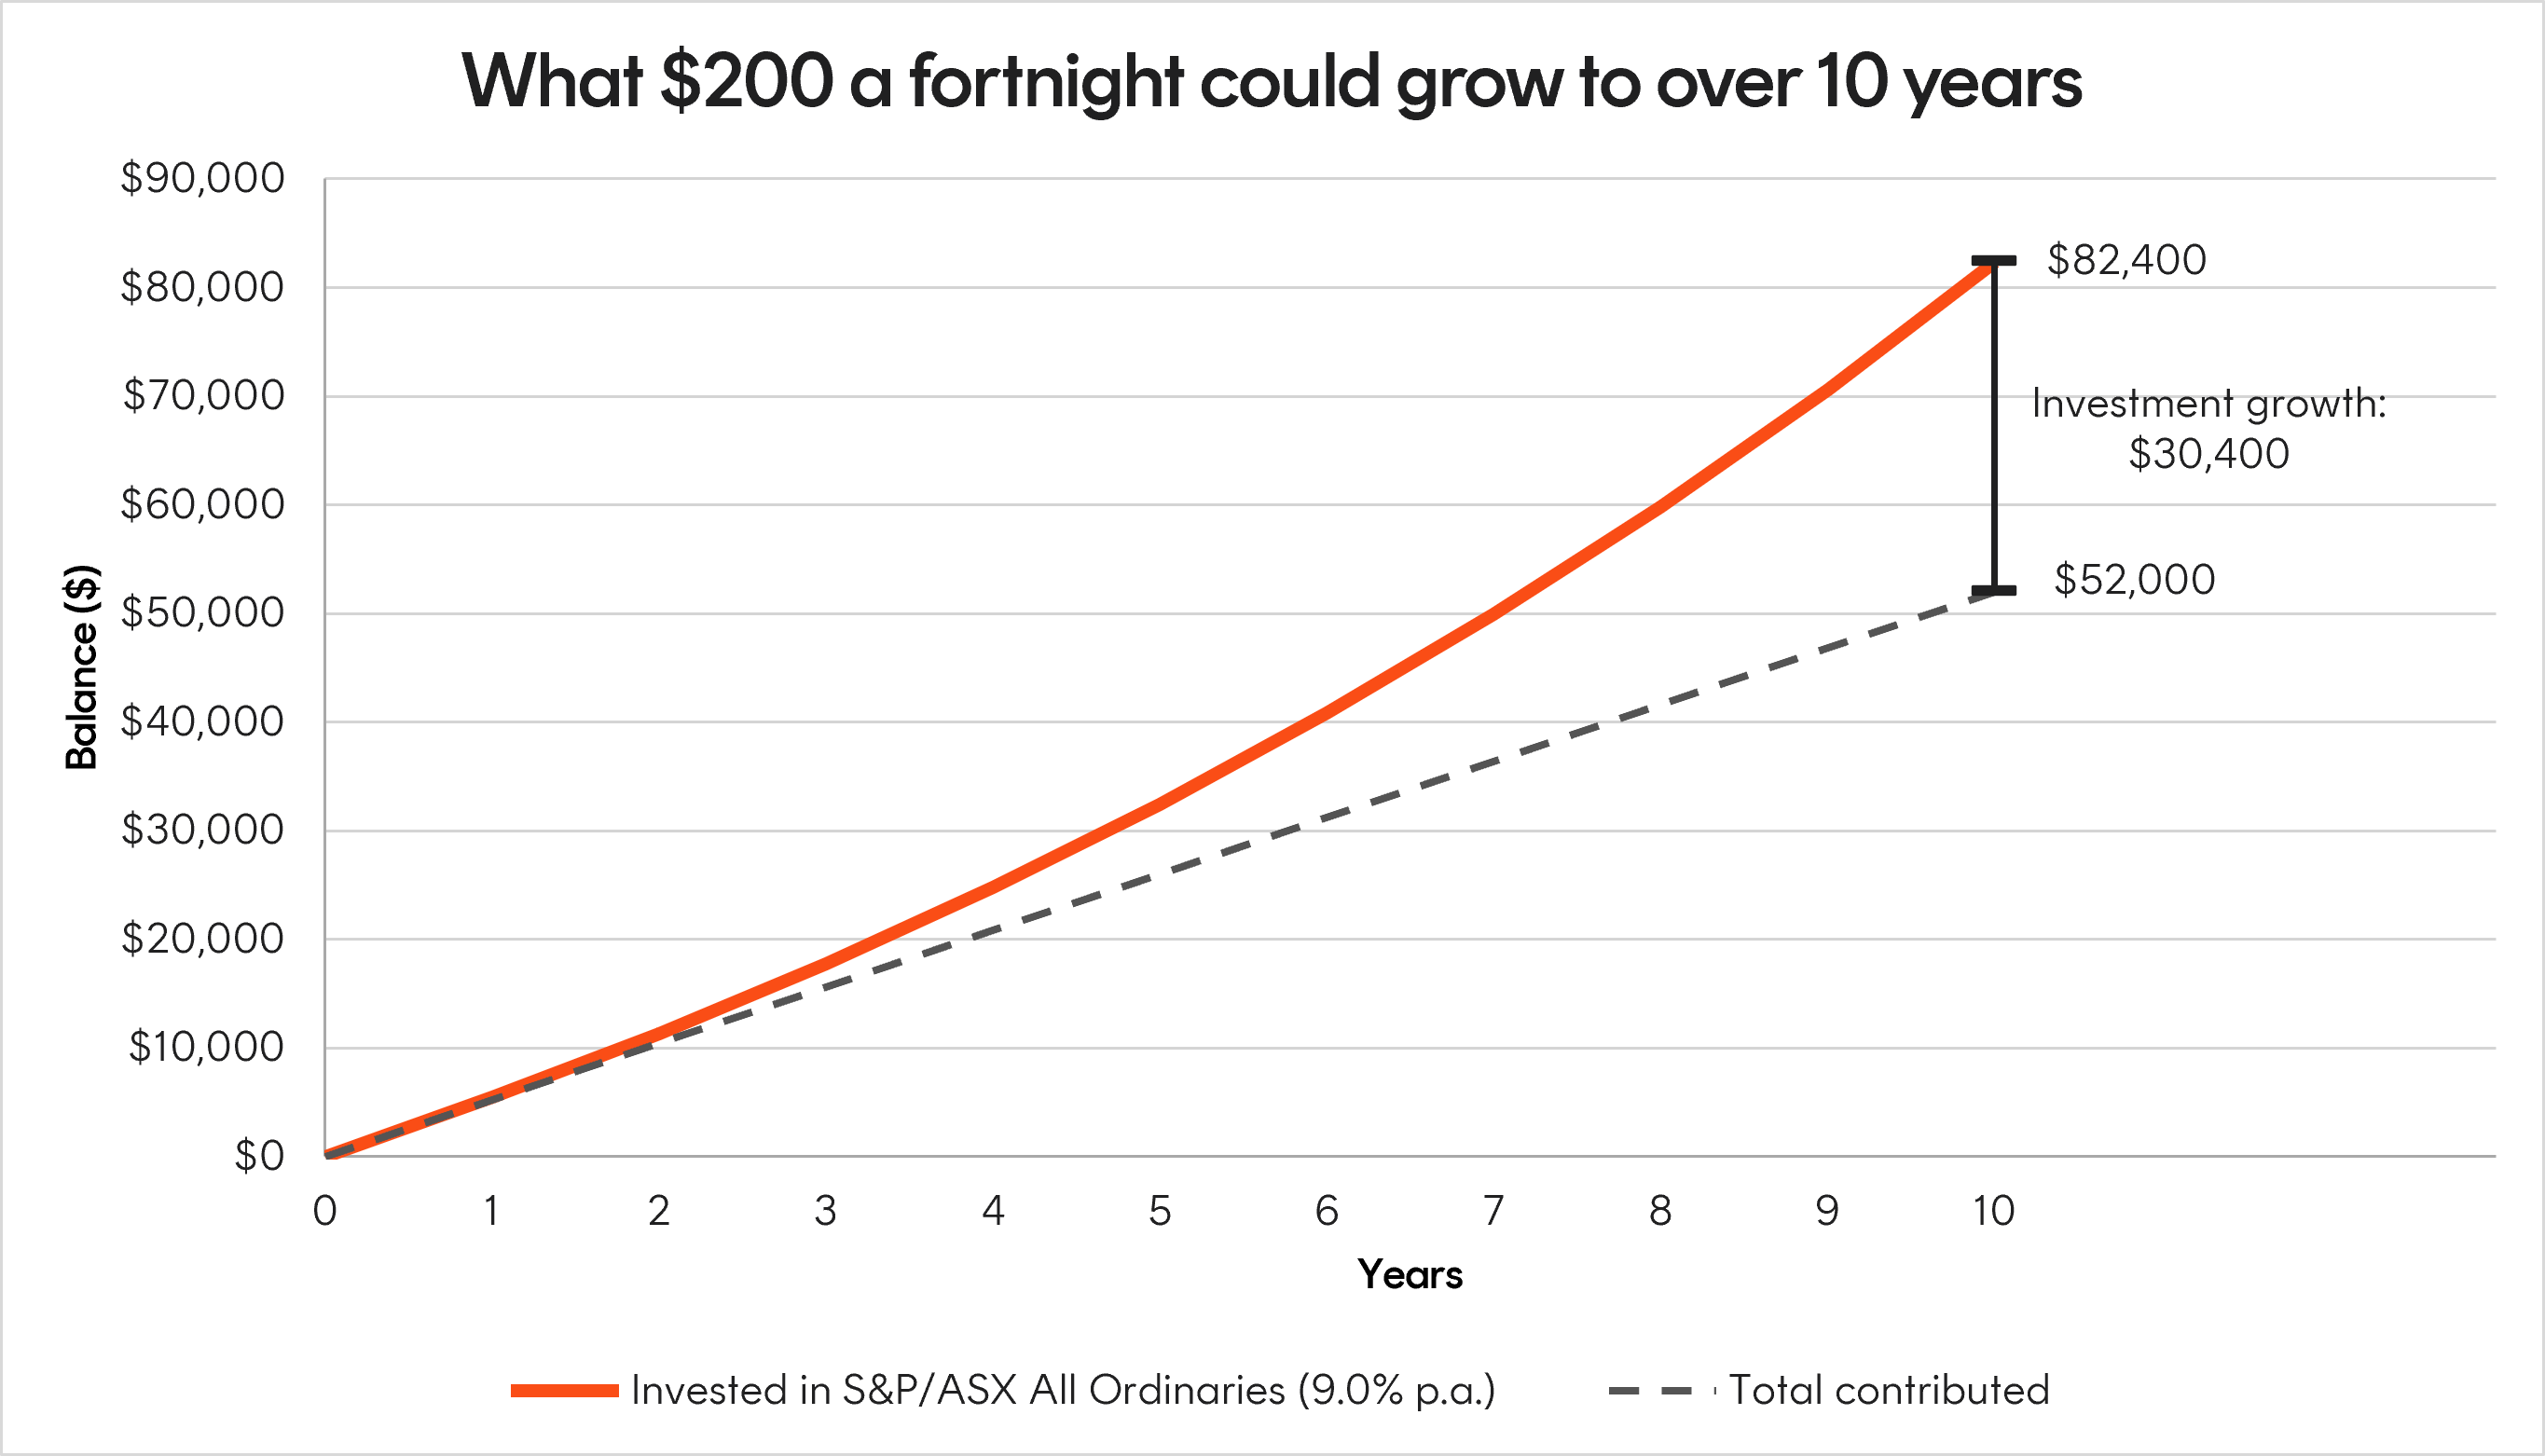
Source: Bloomberg. Illustrative only. Assumes a constant annual return; excludes fees, brokerage and tax. Past performance is not an indicator of future performance.
Return changes the destination
Small differences in return compound into meaningful differences in outcome. At 8% a year, the same habit ends at about $78,200. At 10%, it reaches about $86,800. Just one percentage point either side of the long-run average moves the result by roughly $4,000 to $4,500.
Time is the power here as it gives compounding longer to work. If you increase the time frame to 20 years, you’d have around $277,000 from $104,000 of contributions. The second decade does far more heavy lifting than the first, because growth is now being earned on a much larger base.
Risk changes the ride
The 9% figure is an average, and it’s important to point out that averages hide a lot. On the All Ordinaries Accumulation Index, 2008 delivered a loss of 40.4%, followed by a gain of 39.6% in 2009. Over the 30 calendar years from 1996 to 2025, Australian shares finished higher in 25 and lower in five, roughly one losing year in every six1.
Ten-year periods can differ sharply too. The All Ordinaries returned 9.5% a year over the decade to June 2026, but only 7.2% a year over the 20 years to the same date. That implies the decade before, from mid-2006 to mid-2016, which included the global financial crisis, returned only around 4.9% a year.
Two points are worth holding onto. First, past patterns aren’t promises; the performance in a future decade could be worse than any on record. Second, regular investing changes how volatility feels. Early in the journey, falls let you buy more units at lower prices. However, late in the journey, when the balance is larger, a sharp fall could do more damage in dollar terms.
Routine is the part you control
Markets may set the return, but you control the routine, and that’s what can matter the most.
If you were to pause contributions for 12 months in year three, the year-10 balance drops to about $72,500. That’s nearly $9,900 less, even though you only skipped $5,200 of contributions, because those missed dollars also missed seven years of compounding.
Go the other way and lift contributions by 3% each year, roughly in line with wage growth, and the balance reaches about $92,500 from $59,600 contributed.
What the numbers leave out
This is a simplified model assuming a constant annual return, which markets never deliver, and excludes fees, brokerage and tax. Inflation matters too: consumer prices rose 2.7% a year over the same 30 years, so $82,400 in a decade would buy roughly what $63,000 buys today, if that rate continued. Still well ahead of the $52,000 put in, but a useful reality check.
The takeaway
Investing $200 a fortnight won’t make you rich overnight. What it does is put time and compounding to work. History suggests the return will vary, sometimes uncomfortably. The habit is the one variable fully within your control and, over a decade, it’s the one that makes the biggest difference.