
Hugh Lam
8 minutes reading time
Passive investing has transformed the investment landscape over the last three decades.
Providing low cost, tax-efficient exposure to a range of asset classes, indexed strategies have become a popular tool for many investors to build diversified portfolios. And as the majority of active managers continue to underperform their respective benchmarks across time, the rise of passive investing should only continue from here.
That said, there has also been a healthy dose of skepticism around this very trend with some claiming that passive investing is distorting prices and creating a stock market bubble. While we invite a balanced discussion around the age-old passive vs active debate, factual inaccuracies can often be made.
In this note, we explore three common misperceptions about passive investing through the lens of CBA given its position as the largest ASX 200 constituent and rapid share price rally in recent years.
Myth 1: Passive owns most of the market
It’s often claimed that passive funds effectively ‘own’ the share market and drive most price action, leaving little room for active decision-making.
Last year, Morningstar published an article that showed passive funds overtaking active funds in terms of funds under management, but was widely misinterpreted as suggesting that passive owned more than half the US share market.
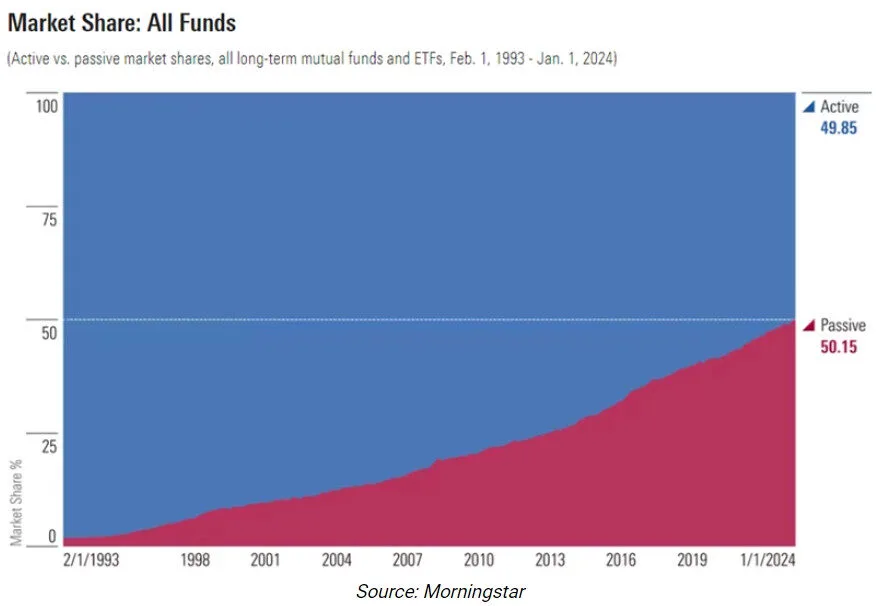
Source: Morningstar.
However, this is certainly not the case. Bloomberg estimates that passive funds only own about 13% of the entire US stock market.1
We also found that the amount of assets across Australian equity ETFs make up just a fraction of the ASX 200 at just 2.6%2, a significantly lower share than many would think.
To illustrate this point further, we looked into some of the dynamics behind CBA as a useful case study given its share price rally in recent years and position as Australia’s largest stock. If any company’s share registry should be dominated by passive funds, it would be a Big Four bank given their large weights within the ASX 200.
That’s a conclusion that Barrenjoey came to after releasing a report earlier in June that claimed index funds’ share of CBA’s share register had increased from ~18% in 2017 to ~29% this year. But digging into the numbers shows a different picture.
We find these figures are vastly overstated as it classifies a firm’s “investing style” without considering any underlying beneficial owners/mandates that may be in non-index-based assets. For example, a conglomerate like Blackrock may be classified as “passive”, even though it may have many other active, quantitative or multi-asset mandates.
Instead, we took a more granular approach to looking an ownership across ASX 200 banks and found passive funds do not dominate the share registry at 17.8% (as at 30 June 2025). In fact, a substantial portion of ownership remains with active managers, super funds and retail investors are the largest owner type as shown below.
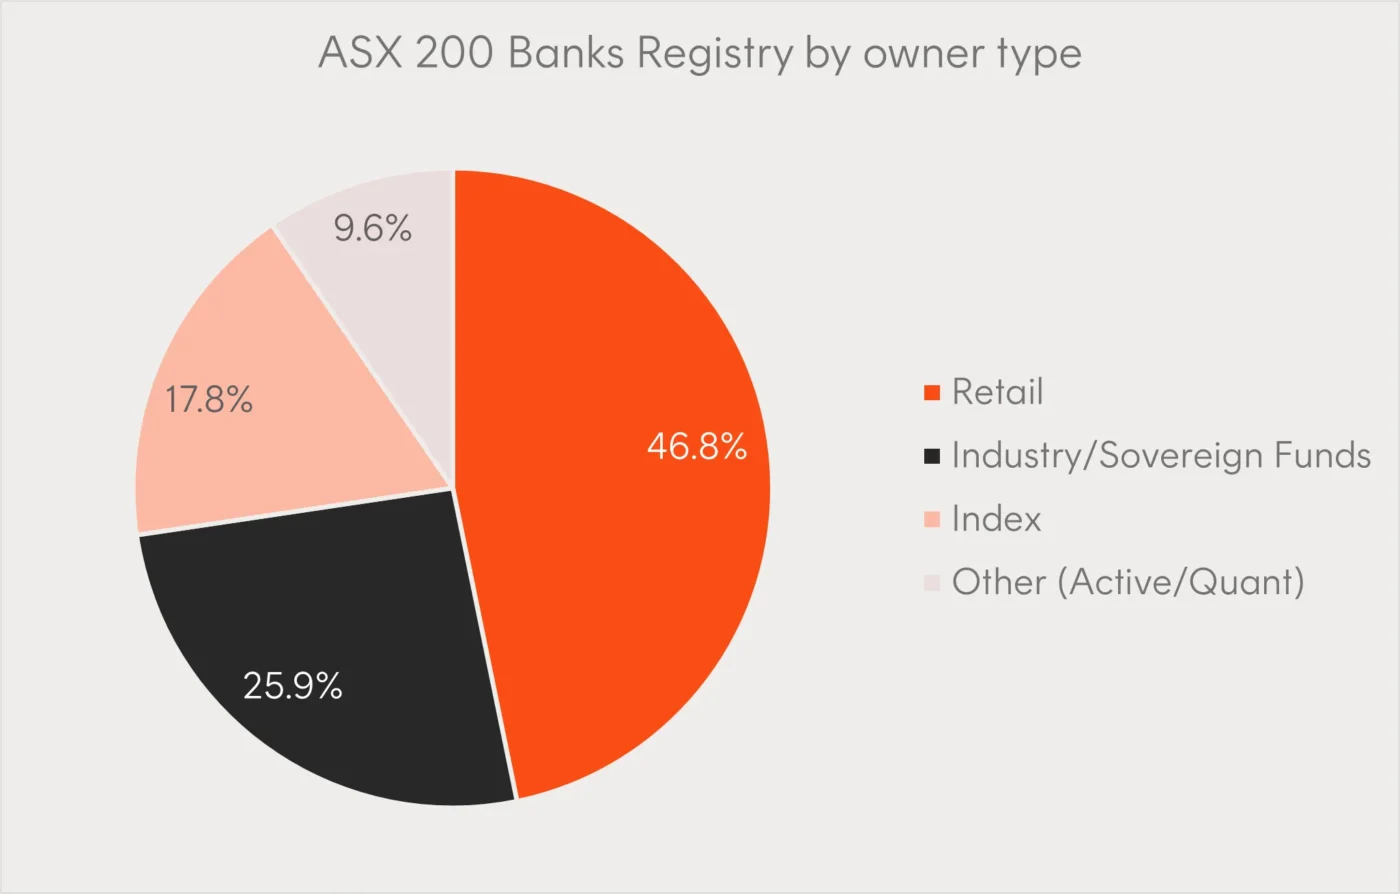
Source: Betashares, MUFG, as at 30 June 2025.
What this analysis shows is that even in Australia’s most indexed names such as CBA, passive capital does not necessarily set prices nor ‘own’ most of the market.
Myth 2: When stock prices go up passive funds are forced to buy more
Another common myth about passive investing is that rising share prices automatically force passive funds to buy more of the same stock, amplifying momentum and decoupling prices from fundamentals. But this is not how index investing actually works.
Take market capitalisation weighted ETFs, when a stock’s price increases by more than the index as a whole, then that stock’s price weight within the index will automatically increase. However, this dynamic does not cause the ETF to transact in those shares. The ETF does not add to buying pressure for a stock that is appreciating (or selling pressure for a stock that is depreciating).
The only times a market capitalisation weighted ETF will buy or sell underlying securities, is on an index rebalance (which largely only impacts the stocks “at the tail” of the index that are being added/removed), a corporate action or when units of the ETF are created or redeemed.3 None of these actions explain the recent outperformance of a stock like Nvidia or CBA. The idea of passive being a “forced buyer” also ignores the diversity within passive products.
Many non-market capitalisation index strategies such as smart-beta ETFs are designed to rebalance against price appreciation or apply some form of single stock cap to limit concentration. Take the chart below which shows three Australian equity smart-beta ETFs.
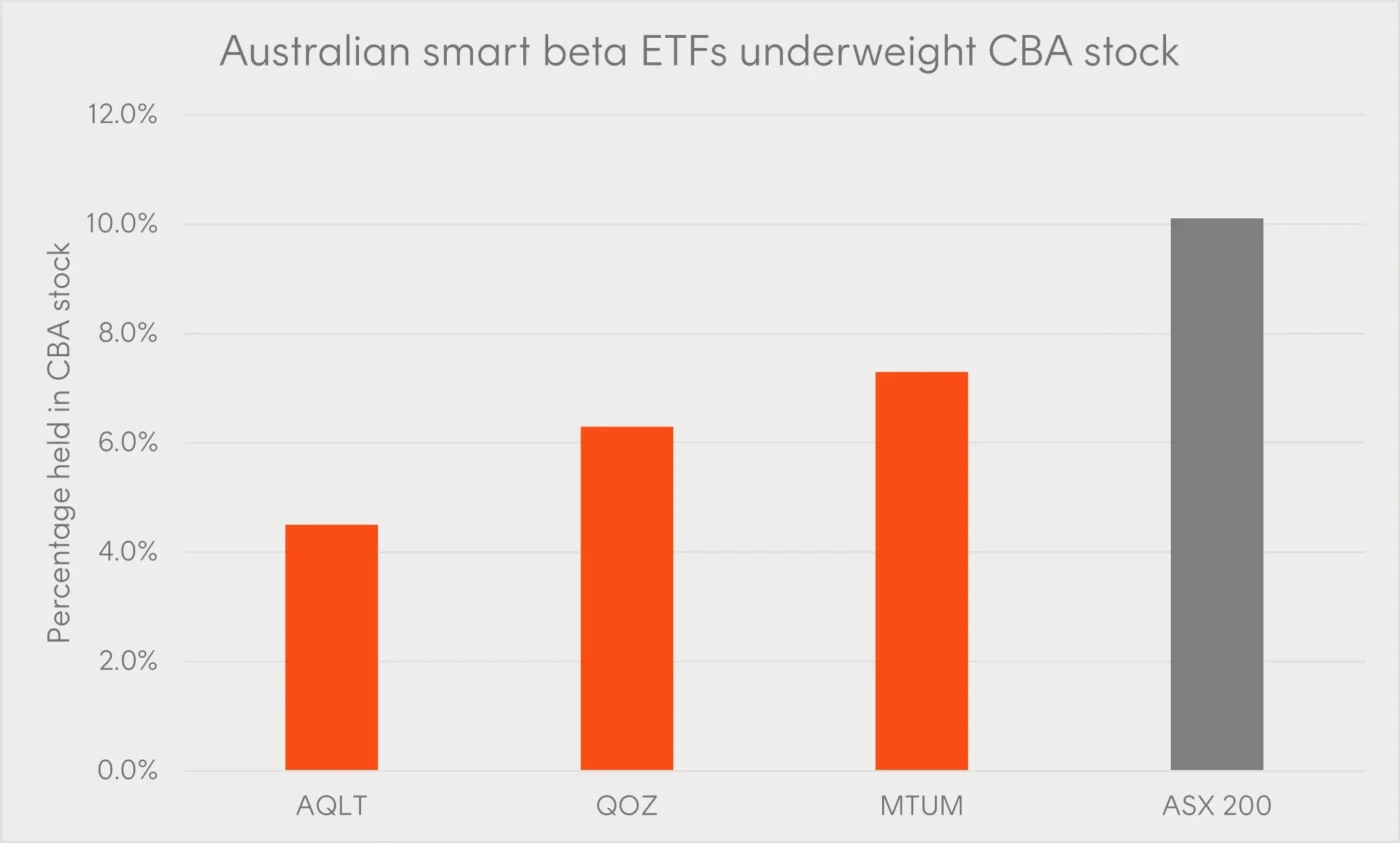
Source: Betashares. As at 20 November 2025. AQLT is the ticker for the Betashares Australian Quality ETF. QOZ is the ticker for the Betashares FTSE RAFI Australia 200 ETF. MTUM is the ticker for the Betashares Australian Momentum ETF.
What we see is that all three ETFs have a meaningful underweight position to CBA stock compared to the broader ASX 200. If we take QOZ as a fundamentally weighted ETF example – its methodology assigns weights based on cashflows, earnings and book value which results in selling an outperforming stock at the next rebalance date and reallocating to securities whose prices have fallen and have become “undervalued”.
So, market capitalisation weighted ETFs don’t buy a stock just because its price rises, and certain other smart beta ETFs can actually in fact contribute to selling pressure when a stock price goes up.
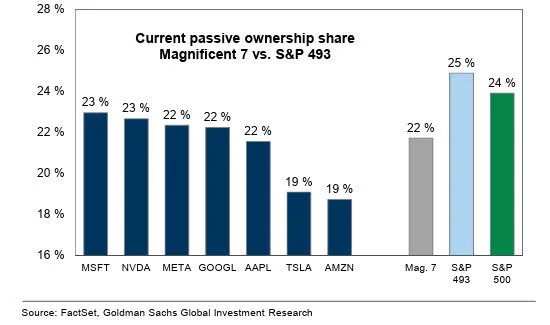
Similarly, a report published by Goldman Sachs last year found that passive ownership of the larger stocks within the S&P 500 (namely the Magnificent 7) was actually lower than the remaining 493 stocks in the index, and that the relationship between market cap and passive ownership appeared to be slightly negative.
Myth 3: Inflows into passive are driving CBA’s share price rally
The final myth that may seem intuitive is that rising passive ETF flows are mechanically pushing CBA’s share price higher given it is the largest stock in the ASX 200 index. However, the relationship simply doesn’t show up.
The chart below plots CBA’s monthly share-price returns against monthly net flows into Australian equity ETFs over the past five years.
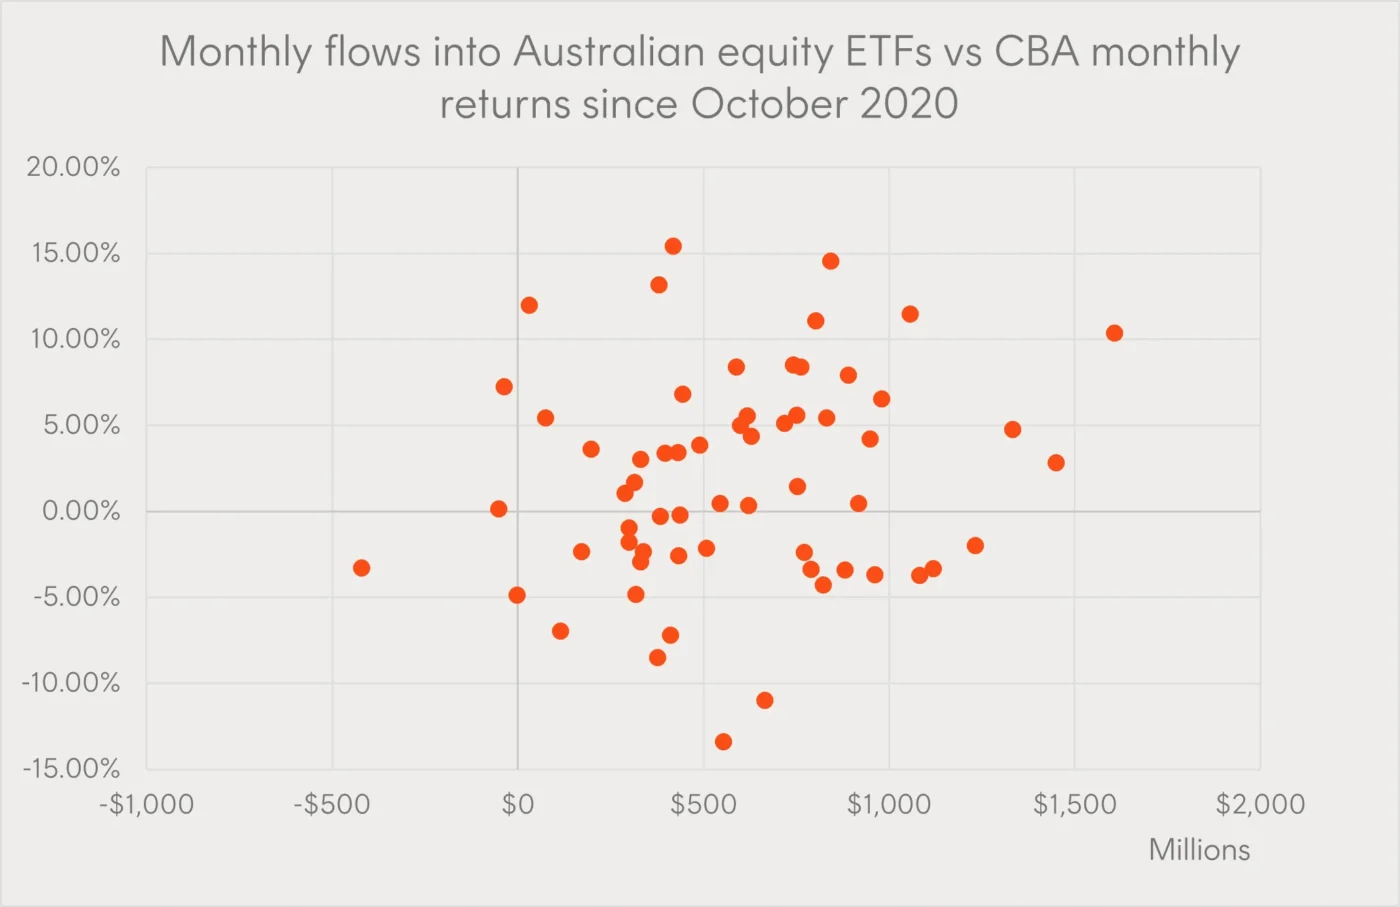
Source: Bloomberg, ASX. As at 31 October 2025
If passive inflows were a meaningful driver of CBA’s rally, we would expect to see some visible relationship — at least in direction, if not in magnitude. Instead, the chart shows a random scatterplot with no statistical significance between the two variables. In fact, just 2% of the variation in CBA’s monthly returns can be explained by monthly inflows into Australian equity ETFs over the selected period.
Further to this, a different large cap stock, CSL, has continued to underperform the index, despite the same passive inflows being proportionally added to CBA, CSL and each of the other stocks that make up the index.
This lack of visible correlation reinforces a key point about how passive investing actually works: market-cap ETFs do not buy stocks because their prices rise. They buy only in proportion to the entire index, and only when new money enters the fund. And because flows into Australian equity ETFs have been relatively modest compared to the increase in CBA’s market cap and the broader ASX 200, even large monthly inflows are too small to exert stock-specific upward pressure.
Conclusion
The evidence shows that many criticisms of passive investing are overstated. Even in Australia’s most indexed names such as CBA, passive funds remain a minority holder, with active managers and other investors still driving marginal price moves.
Likewise, passive ETFs do not mechanically buy more of a stock simply because its price rises; flows are distributed proportionally across the index, while many rules-based smart beta strategies routinely rebalance against price appreciation rather than reinforce it. The lack of any correlation between ETF inflows and CBA’s recent rally also confirms that price action has not necessarily been shaped by passive flows.
Ultimately, passive funds are just one participant among many in a complex market structure. They have fundamentally changed the investment landscape and how capital is allocated, but not the mechanisms of price discovery. Recognising this helps investors maintain a more balanced understanding about the real drivers of stock returns, rather than overstating the influence of passive flows.
Sources:
1. Bloomberg, “Passive’s no bubble as active retains market control” January 2025. ↑
2. As at 21 November 2025 ↑
3. The following section, Myth 3, addressed the question as to whether ETF creations and redemptions create market inefficiencies. ↑